Virtual reality in Urban Search and Rescue
Lisa Fischell – B.Sc. Applied Geography
- a time and accuracy assessment of the use of
Virtual Reality as a tool for Urban Search and Rescue
after earthquakes
Virtual reality for Urban Search and Rescue
-
a temporal requirement and accuracy assessment of the use
of Virtual Reality as a tool for Urban Search and Rescue
after earthquakes
Master thesis written by Lisa Fischell
Supervised by Dr. Christian Kray M.Sc. Holger Fritze
Dr. Michael Gould
As a requirement for the Erasmus mundus
Master of Geospatial Technologies
At the Westfälische Wilhelms-Universität MünsterIn collaboration with Universidade Nova de Lisboa
&
i. Authors declaration
I, Lisa Fischell (Martikelnummer 447020), hereby confirm that the following Master Thesis titled
“Virtual reality for Urban Search and Rescue
- a temporal requirement and accuracy assessment of the
use of Virtual Reality as a tool for Urban Search and Rescue after earthquakes “
was completed by myself as a requirement for the M.Sc. in Geospatial Technologies. All other work, diagrams and tables used in this work have been truthfully referenced.
especially in the field of human computer interaction, patience and support has been invaluable, and I cannot thank him enough. I would also like to express my profound gratitude to my two co-supervisor Holger Fritze and Dr. Micheal Gould. Mr. Fritzes advice, especially in the field of Disaster Management, but also during the development of the user study and all its complexities, has been incredibly valuable. I would also like to thank him for his always constructive criticism, that has helped me to grow as a scientific researcher but more importantly has allowed me to challenge myself.
To my teachers at NOVA IMS and IFGI, thank you for creating a learning environment that was always challenging, welcoming and supportive all at the same time. I would like to express my gratitude to Dr. Marco Painho and Dr. Mário Caetano whose classes have been amongst the best during my education. I would also like to thank the staff at, IFGI, NOVA IMS and UJI, their warm-hearted support has been much apricated. I would especially like to thank Karsten Höwelhans for his support and splendid humour during my two semesters at IFGI.
I want to express my profound gratitude to Dr. Ana Cristina Costa for her advice and support during this thesis, especially in the field of statistical analysis. Another warm thank you to all the users who generously gave me their time for my user study.
A big thank you to Mr. Kadinopoulos, without his support I would never be where I am today. As a teacher you have made the most valuable impact in my life and I could not thank you enough, truly.
Dear, Adam Scammell, Caitlin Thorn, Karl Morales, Marcleo de Lima Gavãlo, Yves Zeplichal and last but not least Qadir Mamode Ally, I could not imagine completing this degree without you. Thank you for being my dear friends during my time abroad and in Germany. I would also like to thank my English parents, Mike and Patricia. Thank you for helping me during the final stages of this thesis when it was most needed.
Most importantly I want to thank my family, especially my parents Sandra and Alexander, for their never-ending support, advice, and love. To my grandparents Heike and Giuseppe, thank you for always being there and keeping me well fed. To my grandfather Klaus whose phone calls always made my day, I thank you for the bottom of my heart. To Tom, my favourite brother, thank you for always being my partner in crime. It is my family that I dedicate this thesis to.
iii. Abstract
This thesis investigates the elements of both time and accuracy that Virtual Reality (VR) has to offer in support of Urban Search and Rescue (USAR) following an earthquake disaster. After an earthquake, most casualties are found in or under collapsed buildings. With limited nutritional resources and potential injuries, survival rates decrease rapidly after 72hrs. To quickly and accurately assess the overall and individual damage grade of buildings is therefore of fundamental importance to the recovery of victims. The utilised strategies of USAR teams are currently challenged by several limitations. Virtual Reality has been used to visualise three-dimensional data across many scientific research areas. The special characteristics of VR allow a more immersive and engaged interaction for the user. So far VR has been utilised to train USAR personnel, but it has not been applied as a data visualisation method. This concept could support USAR teams across the globe by enabling them to assess overall structural damage extent, visually inspect inaccessible areas and identify optimal access points in a three-dimensional environment. This thesis therefore compares standard USAR approaches, such as Street View images, 2D aerial images and videos, to 3D building models in Virtual Reality. A user study was conducted to investigate the accuracy of information obtained from the different USAR methods, as well as the time it took for the users to obtain the required information. After an explorative data analysis, a Friedman test followed by a Wilcoxon test was applied to results of the user study. The results of the test showed a significant difference between VR and Aerial Imagery. However, the trends in average task completion time as well as task completion rate suggest that VR can be identified as a useful tool to Urban Search and Rescue, improving both temporal requirement and accuracy assessment in comparison to current methods.
iv. Table of contents
i. Authors declaration ... ii
ii. Acknowledgements ... i
iii. Abstract ... ii
iv. Table of contents ... iii
v. List of Tables... iv
vi. List of Figures ... v
vii. Abbreviations and Acronyms ... vi
viii. Keywords ... vi
1. Introduction ... 1
a. Motivation ... 2
b. Concept and Idea ... 3
c. Research goals ... 5
d. Chapter overview & thesis organisation ... 6
2. Literature Survey ... 7
a. Background ... 7
b. Current USAR methods... 10
c. Development of 3D data from UAV collected imagery ... 17
d. VR, and its application in 3D-GIS and disaster response ... 18
e. User studies and analysis methods in both HCI and VR ... 19
f. Results and summary of Literature Survey ... 21
3. Research Method ... 23
a. Research Hypothesis ... 23
b. Study design ... 23
c. Equipment ... 25
d. Data collection process ... 25
e. Product design ... 25
f. Approach to data analysis ... 29
4. User study results ... 30
5. Discussion and Conclusion ... 46
a. Discussion of results ... 46
b. Limitations ... 48
c. Conclusion ... 49
Annex ... 58
INSARAG Field Guideline ... 58
Building grading scheme ... 59
Building Models used in User Study ... 60
User study Script and plan ... 64
Standard Questions ... 66
Task Questions ... 67
Comparative Questions ... 68
Raw user study results for the comparative questions ... 68
Raw results for the standard questions ... 69
Raw Results Task “Use” ... 70
Raw Results Task “Type” ... 71
Raw Results Task “Plan” ... 72
Raw Results Task “Damage Grade” ... 73
Raw Results Task “Local Damage” ... 74
Raw Results Task “Local Damage Identification” ... 75
Raw Results Task “Access Point” ... 76
v. List of Tables Table 1 – ASR Levels – adapted from (INSARAG and OCHA, 2012)... 12
Table 2 – Standard statistics for building use question ... 31
Table 3 – Standard Statistics for building type question ... 33
Table 4 – Standard Statistics for building plan question ... 35
Table 5– Standard Statistics for damage grade question ... 37
Table 6 – Standard Statistics for local damage question ... 39
Table 7 – Standard Statistics for local damage identification question ... 39
Table 8 – Standard Statistics for access point identification question ... 42
vi. List of Figures
Figure 1 – Thesis concept and focus area (in green) ... 4
Figure 2 - European Marcoseismic Scale – EMS 98 (Grünthal, 1998) ... 11
Figure 3 – SfM Concept (Westoby et al., 2012) ... 17
Figure 4 - Adapted from (Milgram et al., 1995) ... 18
Figure 9 –User Study setup ... 24
Figure 5 – Aerial Imagery used in user study ... 26
Figure 6 – Direct view image used in user study ... 26
Figure 7 – Screenshot of a video used in user study ... 27
Figure 8 – Screenshot of VR model used in user study ... 28
Figure 9 – Gender distribution ... 30
Figure 10 – Career status ... 30
Figure 11 – Prior experience of VR ... 30
Figure 12 – User study question about building use ... 31
Figure 13 – Average time for “use” task completion showing S.D in error bars ... 32
Figure 14 – Task completion rate for “use” ... 32
Figure 15 – User study question about building type ... 33
Figure 16 – Average time for “type” task completion showing SD in error bars ... 34
Figure 17 – Task completion rate for “type” ... 34
Figure 18 – User study question about building plan ... 35
Figure 19 – Average time for “plan” task completion showing S.D in error bars ... 36
Figure 20 – Task completion rate for “plan” ... 36
Figure 21 – User study question about damage grade ... 37
Figure 22 – Average time for “damage grade” task completion showing S.D in error bars... 38
Figure 23 – Task completion rate for “damage grade” ... 38
Figure 24 – User study question about local damage and local damage identification ... 39
Figure 27 – Average time for “local damage” and “local damage identification” task completion ... 40
Figure 28 – Task completion rate for “local damage” & “local damage identification” task ... 41
Figure 29 – Average time for “Can you identify any access points” task completion ... 43
Figure 30 – Task completion rate for “Can you identify any access points” task ... 43
Figure 31 - Which method felt of most natural use? ... 44
vii. Abbreviations and Acronyms
viii. Keywords
Virtual Reality, VR, Urban Search and Rescue, USAR, UAV ASR Assessment, Search and Rescue. EM-DAT Emergency Events Database
FEMA Federal Emergency Management Agency
FPS Frame rate per second
FPV First Person View
GIS Geographic Information System GPS Global Positioning System
HCI Human Computer Interaction
HMD Head Mounted Display
INSARAG International Search and Rescue Advisory Group I.S.A.R. Germany International Search And Rescue Germany LEMA Local Emergency Management Authority
ML(x) Richter Scale
OCHA UN Office for the Coordination of Humanitarian Affairs
SAR Search and rescue
SDK Software Development Kit
SfM Structure from Motion
TBE Time based efficiency
THW Bundesanstalt Technisches Hilfswerk
UAV Unmanned Aerial vehicle
UN United Nations
UNISDR United Nations Office for Disaster Risk Reduction USAR Urban Search and Rescue
prone regions has risen dramatically. As a result of this the importance of disaster management is also proportionally increasing. Over the last decade earthquakes have been the cause of over 50% of natural disaster related deaths. Research has shown that the majority of these victims have been trapped either in or beneath collapsed buildings. If the victims are not located and rescued within 72 hours of the earthquake their chance of survival becomes significantly reduced. Therefore, it is of the utmost importance to locate and assess building damage as efficiently as possible.
USAR (Urban Search and Rescue) , a specialised team of Search and Rescue, has been established specifically to operate in highly populated urban areas which have suffered an earthquake. Following an earthquake event, the main challenges faced by USAR personnel are twofold, firstly the need to respond within the shortest time frame as possible and secondly exhaustion caused through extreme exertions from walking up to 12 hours per day over altitudes between ground level and 1500m.
USAR personnel utilise a range of data collection methods to enable prioritisation of action required including pre-event maps (not always available), satellite and UAV imagery as well as visual inspection - none of which are without problems. Each of these is discussed in the literature survey.
Using the above methods, USAR teams only receive a two-dimensional visualisation of the data this is extremely limited when dimensional information is required to analyse not only spatial extent but also the grade of damage to collapsed buildings. To reduce this two-dimensional limitation this thesis posits the use of Virtual Reality (VR) for use in Urban Search and Rescue. The concept and idea of this thesis is discussed in the next Chapter.
a. Motivation
This thesis explores the potential that virtual reality has to offer in supporting USAR personnel during their building damage assessment. The motivation is therefore academic, but also has practical applications.
1. The lack of a structured system to collect information of building damage:
As described in the background Chapter, although many different forms of data acquisition methods currently exist, they are still subject to considerable limitations. Providing a system for USAR personnel to collect and visualise three-dimensional and georeferenced data could help to reduce levels of physical exhaustion and lead to more effective decision making in a more time efficient manner.
2. The lack of research regarding both VR in disaster response and the use of VR to acquire information on damaged buildings:
VR has previously been used in several ways to train USAR and emergency personnel in disaster response. However, the use of VR during a disaster or earthquake event itself has not yet been investigated. In order to conclude whether VR could be an advantageous tool, the time frame and accuracy to assess the obtained models have been investigated in this thesis.
3. Future work:
Another, more personal, motivation for this thesis is the potential for the further development of an integrated system. Such a system, could convert drone collected imagery into VR models which could be shared on an online platform and facilitate the support of remote experts or crowdsourced damage assessment.
b. Concept and Idea
Through an in-depth Literature Survey, Virtual Reality (VR) has been identified as a tool to aid in the damage assessment of buildings by USAR. Due to its special characteristics, which are discussed later in the Literature Survey, VR offers a new perspective to view three-dimensional data.
Three-dimensional models from UAV data have already been developed not only for research, but also practical applications in many scientific fields. These three-dimensional models have so far been used as a tool to collect and preserve data, e.g. to keep the heritage of landforms or monuments at risk of destruction. More recently, some studies have utilised these three-dimensional models after earthquake events. This will further be examined in the Literature Survey.
These three-dimensional models provide a new perspective for USAR personnel. However, viewing three-dimensional data in a two-dimensional environment still leads to severe limitations. Using First Person View (FPV) in a Virtual Reality Environment can vastly reduce these limitations.
This method of visualising information for USAR has not yet been studied, and neither have applied projects been developed. Furthermore, no studies that compare current methods of building damage assessment after earthquakes have been found to date.
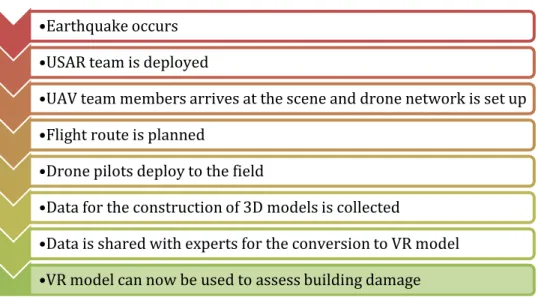
The idea behind this thesis is to investigate how VR can support USAR missions. Due to the time limitation of this degree, only a small proportion of the overall research topic has been investigated. Figure 1. displays the conceptualised idea behind this thesis and the way that VR would be integrated into USAR damage assessment progress.
Figure 1 – Thesis concept and focus area (in green)
During the Literature Survey it became apparent, that time frame as well as information accuracy were of the utmost importance during USAR deployments. These two factors were therefore explored in a user study which is further discussed in Chapter 3.
This concept could support USAR teams across the globe by enabling them to assess overall structural damage extent, visually inspect inaccessible areas and identify optimal access points in a three-dimensional environment.
The digital data collection would negate the necessity for USAR teams having to extensively survey the area, an otherwise exhausting temporal and physical effort. This visualisation method requires reduced levels of local knowledge and less manpower, whilst making data accessible to multiple organisations and support communities during the reconstruction process. It would additionally allow experienced disaster managers to remotely assess the situation and provide strategic support.
•Earthquake occurs •USAR team is deployed
•UAV team members arrives at the scene and drone network is set up •Flight route is planned
•Drone pilots deploy to the field
•Data for the construction of 3D models is collected
•Data is shared with experts for the conversion to VR model •VR model can now be used to assess building damage
c. Research goals
This thesis explores the prospect that virtual reality could provide more accurate information or more time efficient information on the damage to buildings after an earthquake event. To do so the following research goals were established:
1. Conduct a Literature Survey to:
a. Establish current methods and tools employed by USAR personnel b. Investigate development of 3D building models from UAV data. c. Investigate the use of VR itself and its use in GIS and USAR.
d. Identify the optimal methodological and analytical approach for the user study.
2. Create imagery, Video, and VR environment products to simulate a destroyed city for a user study.
3. Conduct a user study to:
a. Investigate the level of accuracy obtained when using standard method for building damage assessment compared to VR.
b. Investigate time requirements for building damage assessment comparing standard methods to VR.
4. Evaluate the user study to establish the accuracy and temporal effort of the use of VR in comparison to standard methods.
d.
Chapter overview & thesis organisation This thesis is organised into 6 chapters as follows:Chapter 1 introduces the thesis topic, explains the thesis motivation as well as the concept and the idea of the thesis. The research goals were also set in this Chapter.
Chapter 2 is concerned with the Literature Survey of this thesis. In addition to achieving one of the research goals, it additionally provides an insight into the chosen methodology of the research approach and the methodology of the user study.
Chapter 3 describes the methodology and user study process. This includes the research hypothesis, the design of the study, the equipment used during the study as well as the design of the product.
Chapter 4 presents the results of the user study.
Chapter 5 discusses the results of the user study, describes the limitations of this thesis and provides a final conclusion.
2. Literature Survey
The Literature Survey for this thesis has been divided into three sections. The first one provides a background to the thesis topic. The second discusses methods and tools that USAR teams are currently using to obtain information on the state of buildings after earthquake disasters as well as their limitations. The third section examines the development of 3D building models from UAV imagery to establish the process and time frame required to get imagery VR ready, as well as limitations of this method. The current use of VR itself, and its application in GIS and in USAR, are discussed in section three. Combined, these sections provide an overview of the current baseline of methods used by USAR teams, the state of technology of both the establishment of 3D models from UAV imagery, the use of VR in USAR, and limitations of all the above. They also provide the basis for some development of the user study and the first research goal.
a. Background
Disaster Management is concerned with the “organization, planning and
application of measures preparing for, responding to and recovering from disasters” (UNISDR, 2017). Sometimes used interchangeably with the term
“Emergency management”, it is important to note that developed strategies are aimed at reducing the risks of disasters and increasing preparedness rather than eradicating the cause of the event itself. With an increasing percentage of the global population at risk, Disaster Management is becoming an interdisciplinary ever-growing field.
During the last decade, different types of disasters resulted in over 800,000 deaths, 2 million injuries and left approximately 15 million victims homeless (EM-DAT, 2018). According to the United Nations, 55% of disaster related deaths are directly related to earthquake events with a magnitude above ML7 (Holzer and Savage, 2013; UNISDR, 2016).
Because of these high mortality rates, the cause of death in earthquakes has been intensively investigated, both in case studies, and also in technical papers. All papers studied in the initial investigation during the development of this thesis concept conclude that the main cause of deaths in earthquakes is the collapse of buildings (Alexander, 1985; Coburn and Spence, 1992; Spence et al., 2011). Although building style and material have been identified to cause significant variations in the extent of the damage, this is where most victims are recovered. The unpredictable nature of an earthquake prevents evacuation and leaves victims trapped in voids, or under debris and collapsed structures.
The survival rate of earthquake victims decreases significantly as time passes, especially after 72 hours. This has been reported by many case studies and also by medical journals. (Schultz, Koenig and Noji, 1996; MacIntyre, Barbera and Smith, 2006; Qi et al., 2016; Kang et al., 2017).
The lack of pre-warning and the rapid onset of an earthquake elevates pressure on Disaster Management in conjunction with Search And Rescue (SAR) personnel. SAR personnel are often first and secondary responders. Their primary assignment is to determine the location of potential victims, move and remove debris, and most importantly identify, rescue and recover injured victims (Baker et al., 2016; Silk et al., 2018). Schweier and Markus (2006) argue that, in order to recover victims, the correct building damage assessment is of vital importance (Schweier and Markus, 2006).
Increased global population has led to rapid urbanisation in earthquake prone regions (Hewitt, 1997). The increased potential risk in densely populated areas has led to the establishment of Urban Search and Rescue Teams, a select task force of SAR personnel. The Federal Emergency Management Agency of the United States (FEMA, 2018) states that “Urban
Search and Rescue (US&R) involves the location, rescue (extrication), and initial medical stabilization of individuals trapped in confined spaces”.
The terms SAR and USAR are often used interchangeably in literature, but a distinct differentiation needs to be made. The teams often have different training backgrounds and perform different duties during their missions. Since most earthquake casualties are found in collapsed buildings, this thesis refers specifically to USAR personnel throughout the document.
Gathering accurate and reliable post-event data of the spatial extent and distribution of destruction has been a major limitation and challenge for USAR personnel. As aforementioned, the collapse of buildings is the primary cause of death in earthquakes. It is considered that the first 36-72 hours are of fundamental importance towards the recovery of victims (Fiedrich, Gehbauer and Rickers, 2000). In addition to the temporal pressure, USAR personnel often face exhaustion from performing tasks that require a high physical effort.
Silk et al., (2018) investigated the activities which USAR personnel perform while deployed. It was found that 83% of USAR personnel identified “Perform moderately paced walking over slightly undulating open
terrain” as a task that they undertake frequently. This includes a walking
duration of 8-12 hrs over varying altitudes (up to 1500m) per day.
Incoming USAR personnel, with limited or non- existing spatial knowledge of the area, regularly face challenges when attempting to identify areas in need of the most urgent help, and gain access to those areas. To combat the shortage of access to information, a range of methods have been suggested as a solution to this problem.
Pre-event maps, visual inspection and satellite imagery as well as videos and imagery acquired from Unmanned Aerial Vehicles (UAVs), have been used to identify damaged buildings (Renwick, Klein and Hamann, 2016). Various problems have arisen with these currently used methods, which will be further discussed in the Literature Survey.
Once data on the spatial extent and damage grade has been collected, and the analysis phase has started, USAR personnel are faced with a further challenge. The previously described and currently applied techniques visualise the data using only a two-dimensional system. As aforementioned, most victims are found in collapsed buildings, an environment where dimensionality is of substantial importance.
In order to reduce the limitations that USAR personnel face, this thesis posits the use of Virtual Reality for Urban Search And Rescue. The next section will discuss the concept and idea of this thesis.
b. Current USAR methods
USAR teams make use of several strategies to gain information on the state of buildings after earthquakes. These range from simple excursions on foot to complex analytic algorithms. This section will discuss a number of those strategies.
Before doing so, it is important to note that the approach and scale of damage assessment vary between different USAR teams, literature, and organisational guidelines. An often-used damage assessment scale in both literature and practical application is the European Macroseismic Scale (EMS) by Grünthal, Figure 2. The EMS classes different levels of structural damage to buildings into a range of Grades. These range from 1-5 where Grade 1 signifies no damage and Grade 5 means total destruction.
Figure 2 - European Marcoseismic Scale – EMS 98 (Grünthal, 1998)
On foot search:
The simplest and most often utilised approach to Search And Rescue is the simple “on foot” search. It is often practiced by first responders who do not follow any strategy when they are searching for victims. Mirhashemi et al., (2007) provide an overview of the first response during the 2003 Bam earthquake. They found that 89.2 % of first responders were local, out of which 59.5% were relatives, 29.7% local residents and 10.8% were other local groups. This type of search is often unorganised and responders use basic tools or their bare hands (Statheropoulos et al., 2015). Consequently, damage to the buildings are not assessed and subsequent risks for both first responders and the victims are high. In addition, no data is gathered on the damage extent, whether the building has been searched, or the number of victims.
Once the first professional USAR teams arrive, they conduct a simple on foot search to gain an overview of the damage grade and extent. The search and rescue missions on foot are conducted by Light and Medium USAR teams (INSARAG and OCHA, 2012).
USAR teams employ a range of tools to support their missions. These range from specialised search dogs, UAVs, small robots and medium duty equipment. Following large scale earthquake disasters, the United Nations Office for the Coordination of Humanitarian Affairs (OCHA) coordinates the operation of all international USAR teams. A guideline called
“Assessment, Search and Rescue levels” (INSARAG, 2012) is then
implemented. After the first wide area assessment (ASR Level 1) OCHA divides the affected areas into sectors in communication with the International Search and Rescue Advisory Group (INSARAG) and the USAR. They then conduct primary, secondary, and full coverage search and rescue. These Levels scan be seen in Table 1, which was adapted from the earlier mentioned INSARAG & OCHA Guidelines.
Table 1 – ASR Levels – adapted from (INSARAG and OCHA, 2012)
During each level, data on the state of buildings is collected and communicated to the OCHA communication centre. It is then placed in an overall database. A major limitation to this method is that performing a simple foot search is a long and exhausting process. As previously described, SAR personnel spend ca. 8-12 hrs conducting searches and as a result are often exhausted whilst carrying out the actual victim recovery (Silk et al., 2018).
ASR Level
Description Definition & Purpose Carried out who/ when 1 Wide area
assessment
Preliminary survey of the affected areas for developing the Sectorisation plan, BoO options and overall plan of action
LEMA/UNDAC/first Responder few USAR teams in country at the onset
2 Sector assessment
Fast pace methodical assessment to identify viable live rescue sites within assigned sector
USAR teams assigned to respective sector
3 Primary Search & Rescue
Conduct in early stages – Fairly rapid progress through assigned worksite to maximize lifesaving opportunities
USAR team(s) assigned to respective side
4 Secondary Search & Rescue
Thorough search through all survivable voids involving full range of USAR capabilities usually at one worksite
USAR team(s) assigned to respective side
5 Full Coverage Search & Rescue
Complete search of entire worksite to locate all life and deceased victims. 2 options for use complete delayering of collapsed structures or room to room clearance of non-collapsed structures
LEMA, sometimes together with USAR teams at the of rescue phase
To combat the disadvantages of simple on foot searches, other technology-based methods have been developed, studied, and applied. This includes the use of 2D Street View images collected by USAR personnel, 2D aerial optical images collected either by satellites or, more recently, UAVs. UAVs are also used to collect videos of the destroyed buildings. These methods will be discussed in the following sections.
Street View images
During ASR Levels 1 and 2, Street View images are often collected to document the assessed areas. These images are shared between the USAR teams assigned to each specific sector and are used as a reference for later assessments. The functionality of these images has not been scientifically investigated; however, since social media has become a tool to share information on damage extent and grade, researchers have increasingly focussed on their use to assess building damage (Hwang, Evans and Hanke, 2017; Nguyen et al., 2017).
Aerial imagery
High resolution satellite imagery has long been utilised to identify and grade building damage after earthquakes. An aerial perspective, with a high pixel resolution, provides much data on a large spatial coverage. More recently, research has focussed on the use of UAVs to collect this data, because of the existing limitations which are discussed further on.
To assess building damage using aerial imagery two analysis types have proven promising - one using single images collected after an earthquake and the other using multiple, pre-and post-earthquake imagery.
A method called visual interpretation is often used in crowdsourced or targeted damage assessment. Visual interpretation is defined as an “interpretation of images based on the feature’s tone, pattern, shape, size,
Initially, the user visually identifies and grades the observed damage to a building. This data is then either digitised or GPS point referenced. The accuracy of visual interpretation has long been challenged, and is arguably dependent on a) the quality of the imagery and b) the training or experience of the user.
In research, varying conclusions about visual interpretation have been made. Saito et al., (2004) assessed imagery of the 2001 Gujarat Earthquake, and conclude that visual interpretation provides results accurate enough for search and rescue missions. However, they do not provide any form of accuracy assessment. Yamazaki et al., compared results from visual interpretation to a later conducted ground survey and concluded, that visual interpretation produced only “reasonably accurate results” (Yamazaki, Yano and Matsuoka, 2005) . This finding was also confirmed by a later study from Kerle, who concluded that data obtained can support USAR personnel but does not provide accuracy results (Kerle, 2010). One limitation to this analysis method has long been the low spatial and temporal resolution of satellite imagery and the potential obstruction by high cloud cover. This limitation has been vastly nullified due to the use of very high-resolution imagery collected by UAVs, which provide multiple advantages over traditional satellite imagery.
These advantages include the ability to a) collect data at any time or on any day b) collect data without visual obstruction c) collect data from different oblique angles. In addition, the imagery collected can be of much better pixel resolution and can be taken at different angles to the object of interest. When UAVs are utilised to collect data for disaster response, a few limitations have been identified by Erdelj et al. (2017). The first, and most important one, was found to be the battery life of the UAV itself.
This limitation arises when data over a large spatial area needs to be collected, as the battery life of a UAV is limited. It is also argued that these limitations can be compensated for when the integration of UAVs is a part of the disaster preparedness stage, and the so called “Duty-cycling” of the UAVs has been carefully planned. Other limitations were found to be the skill of the UAV pilot, the ability to ensure personal freedom to members of the public, and the careful optimisation strategies required to successfully collect data (Erdelj et al., 2017).
Another analysis technique for aerial imagery is the use of semi- or self-automated mapping processes, where a system is trained to identify damaged buildings using pre-and post-event imagery. Both methods are based on changes in the colour composition, texture and structure of pixels in the same geographic location (Tu et al., 2017), or they investigate the change in the geometric shape of objects (e.g. buildings or large structures) (Bitelli et al., 2004). This requires the availability of pre-earthquake collected aerial imagery, which is not always available at the required quality (Cao et al., 2016). Because the collection of suitable data, the process of training the system, and the analysis of the complex data output is very time intensive, it is rarely used to support USAR missions.
UAV videos
Since the use of UAVs in USAR missions has become more established, and technology has improved, video recordings have become an often-used tool to collect data on both specific buildings and also overall damage assessment.
Following the emergence of video data for disaster response in the early 90s, many analysis methods have been investigated. As in the case for aerial imagery, visual interpretation and automated analysis approaches have been applied.
Due to the complexity of automated analysis in a moving image frame, this approach has only delivered limited success (Kerle et al., 2005). Subsequently, visual interpretation has been established as the main analysis method for UASR.
During the Literature Survey, it became apparent that few research papers that have been published that specifically relate to earthquake building damage. Often, the use of UAVs to collect video data is mentioned, but no further analysis is conducted. On the contrary, an explorative web search found many reports about the use of UAV videos in USAR. In 2014, OCHA released a paper supporting the use of UAVs that highlighted the general use of UAV videos for humanitarian causes. It did not however, specify any particular scenario (OCHA, 2014). The Bundesanstalt Technisches Hilfswerk (THW) and the International Search And Rescue Germany (I.S.A.R Germany) also note the use of UAVs on their webpage and also the use of live video transmission (I.S.A.R Germany, 2017; THW, 2017)
One multi-mission study was found. After the 2013 Lushan Earthquake (ML7), where a UAV was used to support search and rescue personnel and
the concluding results were examined. It was found, that the collection of aerial videos, in real-time and recordings, were more valuable in the analysis than static images (Qi et al., 2016).
While it can be argued that the collection of videos is currently the most established use of UAVs in damage assessment for USAR, the lack of available research-specific literature is a limitation of this Literature Survey.
c. Development of 3D data from UAV collected imagery
Ever since UAVs have been able to collect high resolution imagery, the development of 3D Models of structures has been an often-used approach in numerous multidisciplinary research fields.
Most often, for the development of 3D models from UAV imagery, a Structure from Motion (SfM) technique is used. A number of overlapping aerial 2D images (ca. 100 per building) are fed into software for 3D feature extraction. Figure 3 provides a schematic overview of the SfM concept. (Westoby et al., 2012). It is also argued that the use of ground images notably increases the quality of the obtained 3D models (Yamazaki et al., 2017).
Figure 3 – SfM Concept (Westoby et al., 2012)
After the L'Aquila earthquake in 2009, drone imagery was collected to develop three-dimensional models of buildings for damage assessment (Dominici, Alicandro and Massimi, 2017). This imagery was successfully utilised for detailed damage assessment but was not used to support USAR. In literature, it has often been suggested that the development of such models would require too much processing time for a successful implementation in rapid USAR (Kerle et al., 2005). Two recent studies have proved that, with a prepared set up, generating this data would be possible within a sufficient time frame. (Hein et al., 2017; Verykokou et al., 2017).
d. VR, and its application in 3D-GIS and disaster response Since its development in the early 90s, many applications of Virtual Reality (VR) have been developed across a range of scientific research fields. The definition of VR has long been sought, but has been difficult to establish (Portman, Natapov and Fisher-Gewirtzman, 2015). The most suitable definition was found in the English Oxford Living Dictionaries and is worded as follows: “The computer-generated simulation of a
three-dimensional image or environment that can be interacted with in a seemingly real or physical way by a person using special electronic equipment, such as a helmet with a screen inside or gloves fitted with sensors.” (English Oxford Living Dictionaries, 2018). Milgram et al., (1995)
discuss the relationship, or “continuum” as they call it, between VR and the real world. This relationship results in multiple special characteristics that make VR such a valuable tool.
Figure 4 - Adapted from (Milgram et al., 1995)
These special characteristics provide an immersive and interactive visualisation, whist enabling the user to maintain a sense of space and mass (Richards-Rissetto et al., 2013). VR also allows the “existence” of the user, either through a First Person View (FPV) operation or provided through different levels of perception (Steuer, 1992; Kamel Boulos et al., 2017). To successfully utilise VR many requirements must be met. First, the accuracy of a VR model must nowadays meet certain criteria. The expectation of the “realness” of a VR environment have increased with the availability of 360 videos and VR gaming engines (Portman, Natapov and Fisher-Gewirtzman, 2015). In addition, the frame rate and image quality must meet specific standards which vary greatly depending on the device used to view and interact with the VR model. The current high standard of GIS data usually meets these specific requirements.
A long-discussed issue of many GISs has been the representation of a three-dimensional space in a two-three-dimensional system (Boér, Çöltekin and Clarke, 2013). This is where the use of Virtual Reality as a GIS tool can provide a new perspective.
In the context of USAR, VR has been utilised as a training tool in multiple studies. Some of the training was developed for specialised USAR missions, while others were focussed on preparing individuals on how to act in case of an earthquake disaster (Tarnanas and Manos, 2001; Li et al., 2017; Takahashi et al., 2017).
A Literature Survey using the following, or a mix of, keywords did not result in the identification of relevant literature for the use of VR for USAR, USAR, SAR, VR, damage assessment, earthquake, visualisation.
e. User studies and analysis methods in both HCI and VR
This section describes the Literature Survey conducted for both the user study itself and the statistical analysis methods chosen.
As discussed by Kosara et al., (2003) user studies provide useful insights on the task completion rate when users are provided with a range visualisation methods. In a review by Kim, (2012) it was found that most studies use less than 24 uses. The review also states that the number of participants in user studies is likely to rise. In consideration of the review and the central limit theorem a participant number of over 30 was found to be optimal for this thesis.
Designing a user study that incorporates the use of a Head Mounted Display (HMD) requires a number of special precautions (Sousa Santos et
al., 2009). To reduce any safety hazards the users should complete the
tasks in a hazard free environment. In addition, recording answerers that users give after finishing a task have to be recorded by the researchers
Nausea or virtual reality sickness was also identified as a potential limitation for user studies using HMD or VR in general (McGill et al., 2015). It is suggested to keep the time that users spend to a minimum and consider a number of design guidelines (Jerald, 2016), these are further described in Chapter 3.
When analysing result of user studies in VR a number of factors need to be considered. Jared (2016) discusses that due to the fact that researchers and users cannot see the information displayed miscommunication can be an issue. He also states that due to high sensory response to VR environments users can perceive time and space differently as they otherwise would in the real world.
The statistical analysis of the data is depended on the distribution of the data itself. A descriptive data exploration should be conducted (Young and Wessnitzer, 2016). Since the user study was conducted in an within-group style (one user gets exposed to all test methods) the type of statistical test chosen must be a repeated measures test (Fry, Wazny and Anderson, 2016). As the there were more than two matched groups that were compared a repeated measure ANOVA and the Friedman test were identified as the best option for the data analysis (Wobbrock and Kay, 2016). To further confirm these results, a post hoc test should be applied, in the case of this thesis data the Wilcoxon Signed Rank test was identified as the prime option.
f. Results and summary of Literature Survey
The research goals of the Literature Survey have been set as follows. Each section contains the relevant findings.
Goal a: Establish current methods and tools employed by USAR personnel.
The most commonly used methods were found to be – On-foot search, Street View imagery, Aerial Imagery and UAV collected Videos. Each of these methods were found to be susceptible to multiple limitations.
On- foot search, which is the simplest form of SAR, was found to be limited because of the time it consumed. Also, data is either not collected or of poor quality. When a mission is planned, the lack of accurate pre-event maps or other outdated geoinformation can lead to increased deceleration of victim recovery.
Street View imagery was found to only have limited use in USAR. The images were often used for reference and not the assessment of building damage.
Aerial imagery was found to be used in many research papers as well as USAR missions. Both UAV and satellite collected imagery were utilised in different studies. Depending on the analysis method, the use of aerial imagery produced varying accuracy results in a range of time frames. Both visual interpretation, and semi- or fully automated analyses were found to be susceptible to a number of constraints. The quality and repetition time of satellite acquired imagery were identified as a drawbacks, while the necessity for exceptional pilot skills as well as quality of image were the drawbacks of UAV imagery.
As with Street View imagery, only a small range of research papers relating to the use of UAV videos for USAR were found. When mentioned, it was found that the long review time was a predominant problem. No studies
Goal b: Investigate development of 3D building models from UAV data.
This Literature Survey identified Structure from Motion (SfM) as the main method to extract three-dimensional models from both UAV- collected videos and imagery. The processing time of different software was found to vary greatly depending on the quality of the images as well as the technical equipment used.
Goal c: Investigate the use of Virtual Reality itself and its use in GIS & USAR.
VR has been applied in a number of GIS based projects, especially in Urban Planning and Archaeology. Its characteristics were identified to be the immersive First-Person View (FPV) and the retention of dimensions and mass, as well as the interactive operation. A downside to the use of VR can be nausea and motion sickness.
Goal d: Identify the optimal methodological and analytical approach for the user study.
In order to create a VR Environment that a suitable for a user study a number of requirements have to be met. The special characteristics of a Head Mounted VR require further precautions when it comes to the data collection, these can be more practical – such as health and safety or based on the actual data collection itself – how the data is collected when the users cannot fill out questionnaires. As an analysis method repeated measured ANOVA or Friedman test were identified as the best analysis option depending on the distribution of the data. In both cases, if significance is found, a post hoc test needs to be applied.
3. Research Method
This chapter is split into four sections. One contained with the design of the user study itself, one focussed on the data collection process, one describing the product design and finally the approach to the data analysis.
a. Research Hypothesis
In order to investigate both the temporal requirements as well as the accuracy obtained when assessing building damage using current USAR methods the following research hypothesis were developed.
H1 = There is no significant difference in the temporal requirements that users need to assess building damage after an earthquake when using Aerial Imagery, Street View Imagery, Video and a head mounted VR.
H2 =There is no significant difference in the successful task completion rate when users assess building damage after an earthquake when using Aerial Imagery, Street View Imagery, Video and a head mounted VR.
b. Study design
The user study was designed based on the findings of the Literature Survey. In order to investigate the user study hypothesis, 32 users were asked to complete a set of tasks, of which each set of tasks were concerned with a specific visualisation method. These Tasks can also be found in the Annex. The tasks which the users completed were established from the current baselines of disaster response data collection and reports as well as practical guidelines from the UN, INSARAG and OCHA. The users were asked to identify multiple aspects of the buildings, including use, type, plan, damage grading (according to EMS98), local damage, and the identification of possible voids and access points. The time the users took for each individual task was timed and a pressure environment, to mimic the time pressure in a search and rescue mission, was created by maximally allowing the users 2 minutes to answer per question and orally announcing the 30 second, 1 minute and 1 minute and 30 second mark.
To control the learning effect, the user was first provided with a training set of one aerial image, a street view image a video and a virtual reality environment so that they could accustom to each method. To reduce the effect further, the task sets and the task within the sets were randomised. A script was written to ensure that all candidates were guided with the same instructions and standards. A copy of the script is provided in the Annex. To start, the users answered a set of standard questions as well as questions about previous VR experience and any known adverse effects, which can be found in the Annex.
The users were then given a set of forms including the informed consent form and the standard question form. A randomised user identification number was assigned to each candidate to anonymise the study.
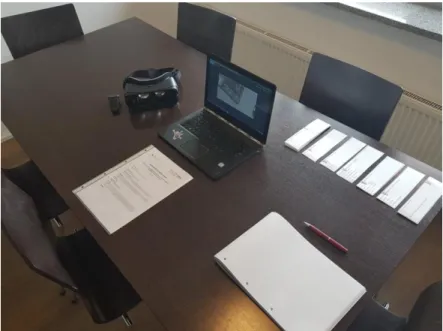
After each task section the users answered comparative questions. At the end of the study the users were asked to comparative questions regarding the different data collection methods. Both of these documents can be found in the Annex. Figure 9 is an example of the standard set up used during the user study.
c. Equipment
For the user study a Samsung Gear VR was used together with a Samsung Galaxy S8. This set up can also be seen in Figure 9. A notebook was used to manually record the results of the user study (time taken for the user to complete a task). This time was taken on a phone which cannot be seen in Figure 9 as it was used to record the image.
d. Data collection process
The data for the user study was collected from different online platforms such as turbosquid.com and assetstore.com. Four main packs were used, “Ruined City” by Dexsoft Games, Builings & Ruins by Neckom Entertainment, Destroyed City by Profi Developers and Free HDR Sky by Proassets.
e. Product design
The data for the user study was collected from different online platforms such as turbosquid.com and assetstore.com. A grading scheme was developed to assess which buildings were the most suitable for the user study. The grading scheme can be found in the Annex. The individual buildings were selected based on factors such as floorplan, use/type, architecture, and spatial extent. The selection of the building and their location pattern, e.g. detached, semi-detached, terraced, as well as the scenes were, in all cases based on a survey undertaken. The individual models were then compiled into mini city scenes in Unity (Unity, 2018). To do so thirteen countries with the highest frequency of earthquakes were researched and building styles for both rural and urban areas were investigated. This allows a more realistic representation of the challenges faced by USAR personnel. To reduce learning effects 12 buildings were selected and the questions within the visualisation types were randomised. The development of each of the products are described in the following section. The process was the same for all the selected buildings to reduce any potential bias. A control building with no damage was also
Aerial imagery
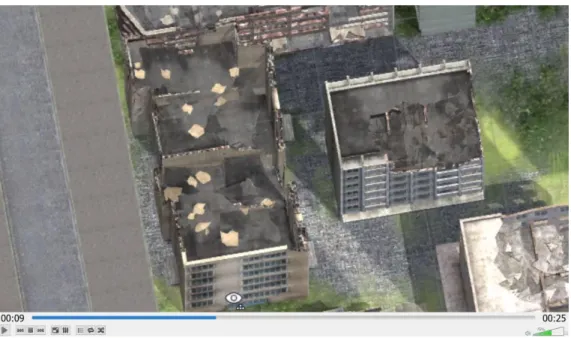
Standard 2D products were created to mimic the use of orthophotos from both, high resolution satellites and drones. The product was generated by obtaining bird eye view images of each building. Figure 5 is an example of an image used in the user study.
Figure 5 – Aerial Imagery used in user study Direct view images
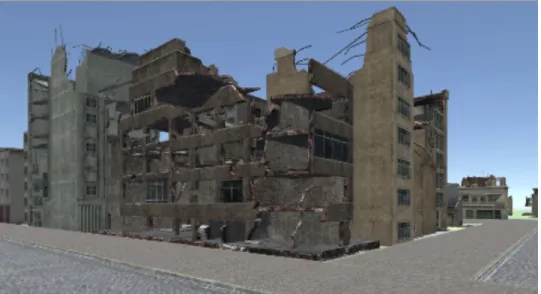
The direct view images were creating by mimicking the view a human would have when viewing the building directly. The product was generated by obtaining FPV images of each building. Again, Figure 6 is an example of an image used in the user study.
Video
The videos for the user study were produced to represent a drone video. The videos were recorded based on flying plans observed from USAR videos which were available to the public on a range of platforms.
Figure 7 – Screenshot of a video used in user study Virtual Reality
The Virtual Reality model was also created from the obtained Unity files. A range of factors have to be considered when developing Virtual Reality models for HCI. These were extensively investigated by Jerald (2016). He discusses object and subject relativity which was considered when selecting the range of damaged or destroyed buildings. This mostly effected the mesh structure as well as surface structure of the objects. In addition, perceptual modalities such as colour were also considered when setting shading effects and colour saturation when creating the final VR models for the user study. Jerald also ranks perception of space as an important factor to consider when designing VR environments. It was decided to re-create space as it would be found in urban environments. During the initial investigation for building styles it was found that urban environments in earthquake prone regions were sometimes extremely densely populated. For the ease of users who were expected to have no prior experience of VR the distances towards the objects when first entering the VR environment were slightly increased.
The users could alter this distance themselves when moving towards and away from the objects through tracked head movements. This allowed the continuous perception of space in the most realistic way. It was also suggested to remove any task-irrelevant objects to reduce the performance of users. Originally the obtained building models were often covered with ivory or other vegetation objects. These were removed. In order to maintain a complex visual scene other stimuli such as rubble were added to the scene instead. An often-discussed limitation of VR is motion sickness and eye strain. The scenes were designed with a calm sky and object colours were kept in a matching colour scheme to reduce this effect. Under the consideration of the above described factors a range of available SDKs (Software Development Kit) were utilised to make the created models ready for their use in the Gear VR. The main kits used were Java SE Development Kit 8u161 (Java and Oracle, 2018), to allow set up of handling options, Android Nougat 7.0 SDK with an API of 27 (Google, 2018) to allow the VR models to function on the mobile phone as well as Oculus’ Platform SDK 1.20 and Avatar SDK 1.20 (Oculus, 2017). to allow compatibility of the VR model, the mobile device, and the Gear VR display. Frame rate was set to 60 FPS which allows the most realistic simulation of the real world and the texture compression was set to Adaptive Scalable Texture Compression to compress the file size. To finally run the game on a Samsung Galaxy 8 the phone was set into developer mode and USB debugging was enabled.
f. Approach to data analysis
The user study was developed to investigate the perspective that virtual reality can bring to Disaster Management in earthquake disasters. In the user study 32 participants were asked to complete randomised tasks collecting information on buildings similar to a situation of an earthquake disaster. The tasks were based on UN, INSARAG and OCHA Guidelines and can be found in the Annex. To measure the factors which are relevant to obtaining the data required the user study metrics, discussed in Chapter 3, were chosen to be the following:
1. Success rate
The success rate measures the number of successfully completed tasks.
2. Descriptive statistics
An exploratory data analysis was undertaken using descriptive statistics.
3. Friedman Test
A Friedman test was conducted for the data analysis as the data was found to not be normally distributed. A Friedman test is used to test for differences within a group. To further specify the result, a post hoc Wilcoxon test was also applied after the Friedman test. For this the alpha value was changed to 0.666 by applying the Bonferroni correction (number of groups compared was always 3).
4. User study results
User study demographics
This section will describe some of the user study demographics that were recorded with the standard questionnaire in the beginning of the study.
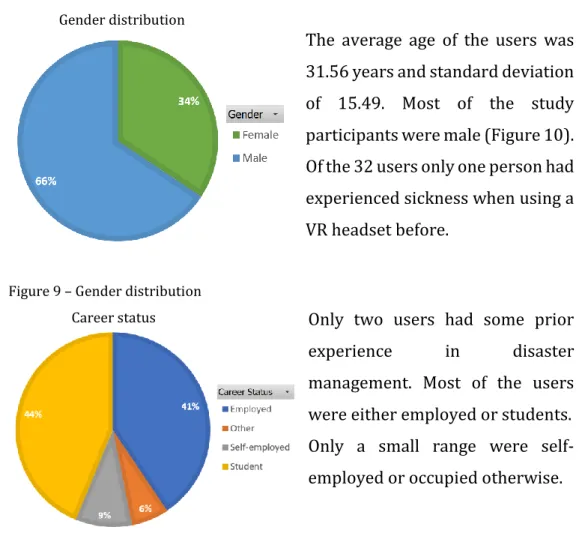
The average age of the users was 31.56 years and standard deviation of 15.49. Most of the study participants were male (Figure 10). Of the 32 users only one person had experienced sickness when using a VR headset before.
Figure 9 – Gender distribution
Only two users had some prior experience in disaster management. Most of the users were either employed or students. Only a small range were self-employed or occupied otherwise.
Figure 10 – Career status
There was a higher number of users with none than users with prior experience with Virtual Reality. The users experience was (as stated) mostly based on gaming experiences or movies but no scientific applications.
Figure 11 – Prior experience of VR
Do you have any prior experience of virtual reality? Gender distribution
Building use
The users were asked to identify the use of the buildings with the following question:
Figure 12 – User study question about building use
The standard statistics for the collected data was found to be the following:
Table 2 – Standard statistics for building use question
The minimum time for a user to complete this task was 1.51 seconds while classing the use of the building by a Street View images. The maximum time for a user to successfully complete the task was 49.62 seconds. The standard deviation was found to range between 6.13 and 11.68 seconds, considering the maximum and minimum values the standard deviation is rather high. All of the tested assessment methods were highly skewed.
Aerial Imagery Street View Video VR Mean 16.92333333 12.3792 19.47423077 14.83692308 Standard Error 1.585057207 1.82031123 2.291125634 1.608751907 Median 16 10.53 16.015 12.79 Standard Deviation 6.138900165 9.101556149 11.68249431 8.203057366 Skewness 1.605530266 1.432652574 1.105008759 2.9276751 Minimum 10.28 1.51 4.96 6.4 Maximum 33.9 38.2 49.62 48.29
The average time for the users to complete the tasks was the lowest for users who classified the building use via Street View imagery (7.8 seconds). This was then followed by the VR, aerial imagery and finally by the video with the highest average of 19.47 seconds.
Figure 13 – Average time for “use” task completion showing S.D in error bars
The task completion rate was over 50% for all the assessment methods. Video and both that the highest completion rates. Both video and VR had the highest task completion rate with 81.25%.
Figure 14 – Task completion rate for “use”
Aerial Imagery Street View Video VR Series1 16.92333333 7.8 19.47423077 14.83692308 0 5 10 15 20 25 30 35 A ve ra ge com pl et io n tim e in s econ ds
Average time for users to complete the task "How would you class the use of this building?"
Aerial Imagery Street View Video VR Series1 53.12% 78.12% 81.25% 81.25% 0.00% 10.00% 20.00% 30.00% 40.00% 50.00% 60.00% 70.00% 80.00% 90.00% Pe rce ntage of s ucce sf ul ly com pl et ed ta sk s
Task completion rate
Building type
The users were asked to class the type of the buildings based on the following question:
Figure 15 – User study question about building type
The standard statistics for the collected data was found to be the following:
Table 3 – Standard Statistics for building type question
The minimum values for all tested assessment methods were under 6 seconds with the lowest one being Street View with a value of 1.22 seconds and Aerial Imagery being the highest 5.61. Aerial Imagery was also found to have the highest maximum value (94.71) seconds. All of the tested assessment methods were slightly positively skewed. The standard deviation was the highest for Aerial Imagery and the lowest for Street View Imagery.
Aerial Imagery Street View Video VR
Mean 48.56307692 8.5235 23.805 19.06182 Standard Error 7.154786759 1.49045477 2.603516 1.893278 Median 46.6 6.765 24.3 17.17 Standard Deviation 25.79695053 6.66551635 11.64328 8.880259 Skewness 0.117374833 0.84074593 0.159349 0.440439 Range 89.1 22.23 41.74 30.29 Minimum 5.61 1.22 3.82 5.49 Maximum 94.71 23.45 45.56 35.78
Figure 16 – Average time for “type” task completion showing SD in error bars
Users using Street View imagery completed the tasks with an average of only 8.52 seconds, followed by VR and Video. Aerial imagery had a higher average in comparison to the other methods. The standard deviation error bars indicate a significant difference between Aerial Imagery and other methods.
Figure 17 – Task completion rate for “type”
The task completion rate was found to be over 50% for Street View, Video and VR. Only aerial imagery had a lower task completion rate (40.62%). The standard deviation bars do suggest no significant difference in the task completion rate.
Aerial Imagery Street View Video VR Series1 48.56307692 8.5235 23.805 19.06181818 0 10 20 30 40 50 60 70 80 A ve ra ge com pl et io n tim e in s econ ds
Average time for users to complete the task "How would you class the type of this building?"
Aerial Imagery Street View Video VR 40.62% 59.37% 62.50% 68.75% 0.00% 10.00% 20.00% 30.00% 40.00% 50.00% 60.00% 70.00% 80.00% 90.00% 100.00% Pe rce ntage of s ucce sf ul ly com pl et ed ta sk s
Task completion rate
Building plan
The users were asked to class the plan / outline of the buildings based on the following question:
Figure 18 – User study question about building plan
The standard statistics for the collected data was found to be the following:
Aerial Imagery Street View Video VR
Mean 6.794138 29.26333 31.05727 25.15577 Standard Error 0.696882 4.169958 2.695466 2.64007 Median 5.76 31.28 27.8 22.795 Standard Deviation 3.752827 10.21427 12.64286 13.46177 Skewness 0.907336 -0.41902 0.64394 0.76221 Range 14.68 24.76 41.69 54.5 Minimum 1.7 15.84 15.52 5.8 Maximum 16.38 40.6 57.21 60.3
Table 4 – Standard Statistics for building plan question
For this task users using aerial imagery to assess the building plan were the quickest, this can be seen when looking the mean which was 6.79 seconds, the minimum value which was 1.7 seconds and the maximum value which was 16.38 seconds. All other methods had averages ranging from 25.15 sec (VR) to 31.05 sec (Video). All of the assessment methods apart from Street View Imagery were positively skewed. The standard deviation for Street View, Video and VR were in a similar range (between 10.21 and 13.46) while the SD for Aerial Imagery was only 3.75 seconds.
Figure 19 – Average time for “plan” task completion showing S.D in error bars
The average times for users to complete the plan task was the lowest for aerial imagery. The standard deviation (seen in error bars) was also lower than for the other methods. In comparison Street View Imagery, Video and VR produced similar results with a similar S.D.
Figure 20 – Task completion rate for “plan”
The task completion rate for users assessing the building plan was highest for Aerial Imagery (90.65%) and lowest for Street View Imagery (18.75%).
Aerial Imagery Street View Video VR Series1 6.794137931 29.26333333 31.05727273 25.15576923 0 5 10 15 20 25 30 35 40 45 50 A ve ra ge com pl et io n tim e in s econ ds
Average time for users to complete the task "How would you class the plan of this building?"
Aerial
Imagery Street View Video VR Series1 90.62% 18.75% 65.62% 81.25% 0.00% 10.00% 20.00% 30.00% 40.00% 50.00% 60.00% 70.00% 80.00% 90.00% 100.00% Pe rce ntage of s ucce sf ul ly com pl et ed ta sk s
Task completion rate
Damage grade
The users were asked to class the damage of the buildings based on the following question:
Figure 21 – User study question about damage grade
Table 5– Standard Statistics for damage grade question
To assess the damage grade users took a minimum of 7.22 seconds (VR) and a maximum of 89.34 seconds (Street View). The data was once again positively skewed apart from the Street View Imagery. The standard deviation was high for both Aerial Imager (21.97 seconds) and Street View Imagery (24.03 seconds). The video method had a S.D of 10.59 sec and VR had a S.D of 6.91 sec.
Aerial Imagery Street View Video VR
Mean 35.105 55.949 26.27875 17.70238 Standard Error 7.706425 7.603351 2.648943 1.509903 Median 30.125 56.665 25.85 17.12 Standard Deviation 21.79706 24.04391 10.59577 6.919246 Skewness 0.986743 -0.04288 0.469467 0.379757 Range 64.08 70.25 40.23 24.89 Minimum 10.3 19.09 7.47 7.22 Maximum 74.38 89.34 47.7 32.11