Prognostic Prediction of Cardiopulmonary Exercise Test Parameters
in Heart Failure Patients with Atrial Fibrillation
António Valentim Gonçalves,
1Tiago Pereira-da-Silva,
1Rui Soares,
1Joana Feliciano,
1Rita Ilhão Moreira,
1Pedro
Rio,
1Ana Abreu,
1Rui Cruz Ferreira
1Centro Hospitalar Universitário Lisboa Central, Hospital de Santa Marta,1 Lisbon – Portugal
Mailing Address: António Valentim Gonçalves • Rua de Santa Marta, 50. 1169-1024, Lisbon - Portugal E-mail: [email protected]
Manuscript received September 05, 2018, revised manuscript March 03, 2019, accepted April 10, 2019
DOI: https://doi.org/10.36660/abc.20180193
Abstract
Background: Atrial fibrillation (AF) is associated with increased mortality in heart failure (HF) patients.
Objective: To evaluate whether the risk of AF patients can be precisely stratified by relation with cardiopulmonary exercise test (CPET) cut-offs for heart transplantation (HT) selection.
Methods: Prospective evaluation of 274 consecutive HF patients with left ventricular ejection fraction ≤ 40%. The primary endpoint was a composite of cardiac death or urgent HT in 1-year follow-up. The primary endpoint was analysed by several CPET parameters for the highest area under the curve and for positive (PPV) and negative predictive value (NPV) in AF and sinus rhythm (SR) patients to detect if the current cut-offs for HT selection can precisely stratify the AF group. Statistical differences with a p-value <0.05 were considered significant.
Results: There were 51 patients in the AF group and 223 in the SR group. The primary outcome was higher in the AF group (17.6% vs 8.1%, p = 0.038). The cut-off value of pVO2 for HT selection showed a PPV of 100% and an NPV of 95.5% for the primary outcome in the AF group, with a PPV of 38.5% and an NPV of 94.3% in the SR group. The cut-off value of VE/VCO2 slope showed lower values of PPV (33.3%) and similar NPV (92.3%) to pVO2 results in the AF group.
Conclusion: Despite the fact that AF carries a worse prognosis for HF patients, the current cut-off of pVO2 for HT selection can precisely stratify this high-risk group. (Arq Bras Cardiol. 2020; 114(2):209-218)
Keywords: Atrial Fibrillation/mortality; Peak Expiratory Flow Rate; Exercise Test; Oxygen Consumption; Heart Failure; Prognosis.
Introduction
Heart failure (HF) and atrial fibrillation (AF) often coexist,1
with AF occurring in some reports in more than 50% of HF patients, and HF in more than one-third of AF patients.2 Since
the burden of each is growing, they have been called the two new epidemics of cardiovascular (CV) disease.3
The presence of AF in HF patients is associated with adverse hemodynamic consequences, which may exacerbate HF, increasing morbidity and mortality.4-6
The cardiopulmonary exercise test (CPET) is a powerful predictor of mortality in HF patients and is used as the criterion standard for the need for heart transplantation (HT),7 with peak
O2 consumption (pVO2) and the relation between ventilation and CO2 production (VE/VCO2 slope) as the most used risk assessment tools.8 However, less information is known about
whether HF patients with AF can be precisely stratified with the current CPET cut-offs for HT selection. Since the combination
of HF and AF provide a worse prognosis, a timely referral for HT or mechanical circulatory support could be extraordinarily important to reduce the negative prognostic effect of AF in HF patients.
The present study seeks to compare the prognostic importance in HF patients of CPET parameters in AF versus sinus rhythm (SR) patients.
Methods
The investigation conforms to the principles outlined in the Declaration of Helsinki. The institutional ethics committee approved the study protocol. All patients provided written informed consent.
Patient population and study protocol
The study included a single centre analysis of 274 consecutive HF patients referred to our institution with left ventricular ejection fraction (LVEF) ≤ 40% and New York Heart Association (NYHA) class II or III, from 2009 to 2016. All the patients were referred for evaluation with HF team and possible indication for HT or mechanical circulatory support. Patients with elective HT during the follow-up period (patients who had indication for HT and a heart become available in the first year of follow-up) were excluded from the analysis.
Prospective follow-up included initial evaluation within a period of one month in each patient with:
• Clinical data including etiology of HF, implanted devices, medication, comorbidities, NYHA class and Heart Failure Survival Score (HFSS);9
• Laboratory data;
• Electrocardiographic data; • Echocardiographic data; • CPET data.
Patients were excluded if one of the following: • Age < 18 years;
• Planned percutaneous coronary revascularization or cardiac surgery;
• Elective HT in the follow-up period;
• Exercise-limiting comorbidities (cerebrovascular disease, musculoskeletal impairment, or severe peripheral vascular disease);
• Previous HT.
Follow-up and endpoint
All patients were followed-up for 12 months from the date of completion of the aforementioned complementary exams.
The primary endpoint was a composite of cardiac death or urgent HT (occurring during an unplanned hospitalization with dependency of inotropes for worsening HF). Data were obtained from the outpatient clinic visits and medical charts review and was complemented with a standardized telephone interview to all patients at 12 months of follow-up. Secondary endpoints included all-cause mortality, sudden cardiac death and death for worsening HF.
Definition of atrial fibrillation
Only persistent or permanent AF was considered for the analysis. The diagnosis was made by electrocardiographic recording in the initial evaluation.
Cardiopulmonary exercise testing
A maximal symptom-limited treadmill CPET was performed using the modified Bruce protocol (GE Marquette Series 2000 treadmill). Tha gas analysis was preceded by the calibration of the equipment. Minute ventilation, oxygen uptake and carbon dioxide production were acquired breath-by-breath, using a SensorMedics Vmax 229 gas analyser. The pVO2 was defined as the highest 30-second average achieved during exercise and was normalized for body mass.10 The anaerobic
threshold was determined by combining the standard methods (V-slope preferentially and ventilatory equivalents). The VE/ VCO2 slope was calculated by least-squares linear regression, using data acquired throughout the whole exercise. Several composite parameters of CPET were also calculated. Patients were encouraged to perform exercise until the respiratory exchange ratio (RER) was ≥1.10.
Statistical analysis
All analyses compare AF patients with SR patients. Data were analysed using the software Statistical Package for
the Social Science for Windows, version 24.0 (SPSS Inc, Chicago IL).
Baseline characteristics were summarized as frequencies (percentages) for categorical variables, as means and standard deviations for continuous variables when normality was verified and as median and interquartile range when normality was not verified by the Kolmogorov-Smirnov test. The Student’s t-test for independent samples or the Mann-Whitney test when normality was not verified were used for the analysis of the variables.
Univariable and multivariable Cox proportional-hazards models were applied, with p values for time-to-event analyses being based on log-rank tests, and hazard ratios for treatment effects and 95% confidence intervals presented to study the combined endpoint considering the follow-up time of 12 months.
For selecting patients who would benefit from early selection for HT or mechanical circulatory support, the primary endpoint was analysed by several CPET parameters for the highest area under the curve (AUC) in the 12 months’ follow-up. Hanley & McNeil test was used to compare two correlated receiver operating characteristics curves.11
The guideline recommended cut-off value of pVO2 (pVO2 ≤ 12 ml/kg/min or ≤ 14 ml/kg/min without beta-blockers (BB)) and VE/VCO2 slope (VE/VCO2 slope > 35 with a RER < 1.05) for HT7 selection were analysed (and compared
for positive and negative predictive value (PPV and NPV, respectively) in our population of AF and SR patients.
Statistical differences with a p-value < 0.05 were considered significant.
Results
Overview of AF and SR groups
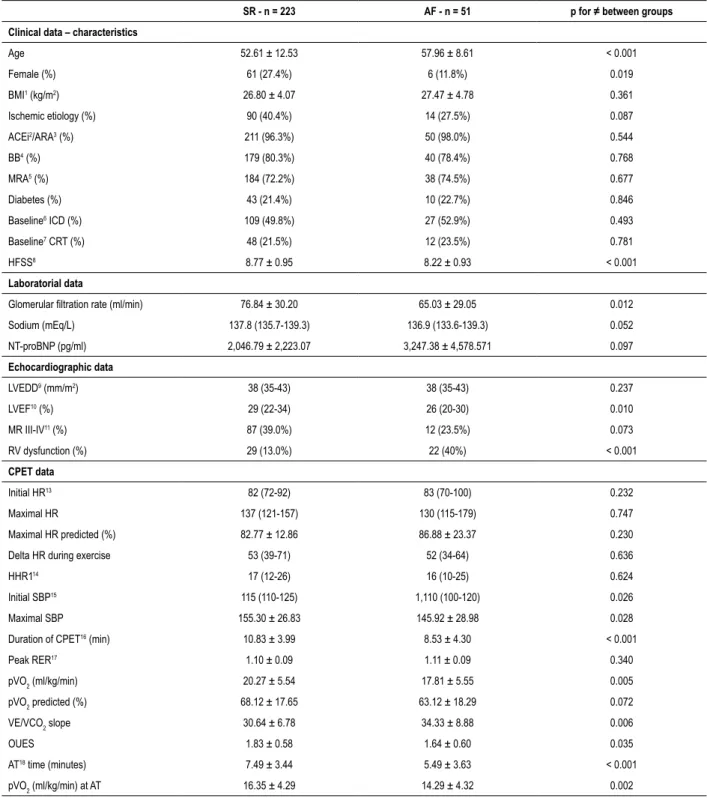
A total of 274 patients were enrolled in the study, with 51 patients in the AF group and 223 in the SR group. The baseline characteristics of SR and AF groups are presented and compared in Table 1.
In regard to clinical data, AF patients were older (57.96 ± 8.61 vs 52.61 ± 12.53, p < 0.001) and had a lower percentage of females. Medication with angiotensin-converting enzyme inhibitors, angiotensin receptor blockers, BB and mineralocorticoid receptor antagonists were similar and highly prevalent in both groups, and no differences were found regarding implantable cardioverter-defibrillator and cardiac resynchronization therapy between the two groups. There were no significant differences for sodium and NT-proBNP, but glomerular filtration rate (GFR) values were lower in the AF group (65.03 ± 29.05 vs 76.84 ± 30.20, p = 0.012). Higher percentage of right ventricular dysfunction (40.0% vs 13.0%, p < 0.001) and lower values of LVEF (24.96 ± 7.44 vs 27.91 ± 7.23, p = 0.010), revealed a worse biventricular function in AF group.
CPET data showed no differences regarding heart rate parameters, but the AF group had lower baseline and maximal systolic blood pressure (SBP). Significant differences between
Table 1 – Baseline characteristics of AF and SR groups
SR - n = 223 AF - n = 51 p for ≠ between groups Clinical data – characteristics
Age 52.61 ± 12.53 57.96 ± 8.61 < 0.001 Female (%) 61 (27.4%) 6 (11.8%) 0.019 BMI1 (kg/m2) 26.80 ± 4.07 27.47 ± 4.78 0.361 Ischemic etiology (%) 90 (40.4%) 14 (27.5%) 0.087 ACEi2/ARA3 (%) 211 (96.3%) 50 (98.0%) 0.544 BB4 (%) 179 (80.3%) 40 (78.4%) 0.768 MRA5 (%) 184 (72.2%) 38 (74.5%) 0.677 Diabetes (%) 43 (21.4%) 10 (22.7%) 0.846 Baseline6 ICD (%) 109 (49.8%) 27 (52.9%) 0.493 Baseline7 CRT (%) 48 (21.5%) 12 (23.5%) 0.781 HFSS8 8.77 ± 0.95 8.22 ± 0.93 < 0.001 Laboratorial data
Glomerular filtration rate (ml/min) 76.84 ± 30.20 65.03 ± 29.05 0.012
Sodium (mEq/L) 137.8 (135.7-139.3) 136.9 (133.6-139.3) 0.052 NT-proBNP (pg/ml) 2,046.79 ± 2,223.07 3,247.38 ± 4,578.571 0.097 Echocardiographic data LVEDD9 (mm/m2) 38 (35-43) 38 (35-43) 0.237 LVEF10 (%) 29 (22-34) 26 (20-30) 0.010 MR III-IV11 (%) 87 (39.0%) 12 (23.5%) 0.073 RV dysfunction (%) 29 (13.0%) 22 (40%) < 0.001 CPET data Initial HR13 82 (72-92) 83 (70-100) 0.232 Maximal HR 137 (121-157) 130 (115-179) 0.747 Maximal HR predicted (%) 82.77 ± 12.86 86.88 ± 23.37 0.230
Delta HR during exercise 53 (39-71) 52 (34-64) 0.636
HHR114 17 (12-26) 16 (10-25) 0.624
Initial SBP15 115 (110-125) 1,110 (100-120) 0.026
Maximal SBP 155.30 ± 26.83 145.92 ± 28.98 0.028
Duration of CPET16 (min) 10.83 ± 3.99 8.53 ± 4.30 < 0.001
Peak RER17 1.10 ± 0.09 1.11 ± 0.09 0.340 pVO2 (ml/kg/min) 20.27 ± 5.54 17.81 ± 5.55 0.005 pVO2 predicted (%) 68.12 ± 17.65 63.12 ± 18.29 0.072 VE/VCO2 slope 30.64 ± 6.78 34.33 ± 8.88 0.006 OUES 1.83 ± 0.58 1.64 ± 0.60 0.035 AT18 time (minutes) 7.49 ± 3.44 5.49 ± 3.63 < 0.001 pVO2 (ml/kg/min) at AT 16.35 ± 4.29 14.29 ± 4.32 0.002
Values are mean ± standard deviation or median (interquartile range); p values are calculated by Student´s T-test for independent samples or Mann-Whitney U test as appropriate. SR: sinus rhythm; AF: atrial fibrillation; BMI: body mass index; ACEi: angiotensin-converting enzyme inhibitors; ARA: angiotensin receptor blockers; BB: beta-blockers; MRA: mineralocorticoid receptor antagonists; ICD: implantable cardioverter-defibrillator; CRT: cardiac resynchronization therapy; HFSS: Heart Failure Survival Score; LVEDD: left ventricular end-diastolic diameter; LVEF: left ventricular ejection fraction; MR: mitral regurgitation; RV: right ventricular; HR: heart rate; HRR1: heart rate recovery in the first minute after finishing CPET; SBP: systolic blood pressure; CPET: cardiopulmonary exercise test; RER: respiratory exchange ratio; AT: anaerobic threshold.
Table 2 – Adverse events at 12 months follow-up
Adverse events at 12 months
follow-up SR - n (%) AF - n (%) p
Combined endpoint 18 (8.1%) 9 (17.6%) 0.038
Total mortality 14 (6.3%) 9 (17.6%) 0.008
Cardiac mortality 12 (5.4%) 6 (11.8%) 0.097 Sudden cardiac death 5 (2.2%) 4 (7.8%) 0.043 Death for worsening HF 7 (3.1%) 2 (3.9%) 0.777
Urgent HT 6 (2.7%) 3 (5.9%) 0.249
Mechanical circulatory support 0 (0%) 0 (0%) 1.000 AF: atrial fibrillation; HF: heart failure: HT: transplantation; SR: sinus rhythm.
Table 3 – Univariate Cox proportional-hazards analysis (non-CPET parameters)
Characteristics
All SR AF
Wald Hazard ratio 95% CI p Wald Hazard ratio 95% CI p Wald Hazard ratio 95% CI p
Age 0.092 0.995 0.965-1.026 0.762 0.768 0.984 0.950-1.020 0.381 0.057 1.010 0.933-1.093 0.811 Gender 0.524 0.699 0.265-1.845 0.469 1.041 0.525 0.152-1.812 0.308 1.188 2.397 0.498-11.547 0.276 BMI 1.175 0.947 0.859-1.045 0.278 0.183 0.974 0.863-1.099 0.669 1.906 0.887 0.748-1.052 0.167 Beta-Blocker 5.139 2.469 1.130-5.393 0.023 4.259 2.713 1.051-6.998 0.039 0.877 1.941 0.484-7.779 0.349 Diabetes 0.130 1.197 0.451-3.174 0.718 0.027 0.910 0.297-2.792 0.869 0.691 2.416 0.302-19.326 0.406 Baseline CRT 1.614 1.995 0.687-5.790 0.204 1.047 2.160 0.494-9.446 0.306 1.807 2.940 0.610-14.167 0.179 HFSS 34.893 0.233 0.144-0.378 < 0.001 22.674 0.233 0.128-0.424 < 0.001 8.600 0.243 0.095-0.626 0.003 Glomerular filtration rate 3.520 0.586 0.971-1.101 0.061 2.578 0.985 0.967-1.003 0.108 0.205 0.994 0.969-1.020 0.650 Sodium 27.303 0.787 0.720-0.861 < 0.001 14.635 0.766 0.668-0.878 < 0.001 7.668 0.839 0.726-0.947 0.006 NT-proBNP 20.456 8.212 2.234-12.367 < 0.001 15.171 6.263 1.894-10.223 < 0.001 3.187 2.335 1.285-4.534 0.004 LVEDD 5.670 1.072 1.012-1.135 0.017 3.001 1.077 0.990-1.171 0.083 1.443 1.049 0.970-1.135 0.230 LVEF 18.934 0.887 0.840-0.936 < 0.001 13.810 0.884 0.828-0.943 < 0.001 3.351 0.912 0.826-0.998 0.049 RV dysfunction 21.377 3.758 2.144-6.588 < 0.001 6.160 2.846 1.246-6.499 0.013 8.346 4.267 1.594-11.419 0.004 SR: sinus rhythm; AF: atrial fibrillation; CI: confidence interval; BMI: body mass index; CRT: cardiac resynchronization therapy; HFSS: Heart Failure Survival Score; LVEDD: left ventricular end-diastolic diameter; LVEF: left ventricular ejection fraction; RV: right ventricular.
the two groups were also observed with prognostic measures of CPET, with a worse status in AF group revealed by a lower CPET duration, pVO2, oxygen uptake efficiency slope (OUES), time to anaerobic threshold (AT), pVO2 at AT and a higher VE/ VCO2 slope (Table 1).
Primary and secondary endpoints
At 1 year, the primary endpoint (cardiac death or urgent HT) had occurred in 27 (9.9%) patients as represented in Table 2. There were no patients requiring mechanical circulatory support. The AF group had more events regarding the combined endpoint (17.6% vs 8.1%, p = 0.038), with cardiac mortality alone showing a trend for a worse prognosis in the AF group (11.8% vs 5.4%, p = 0.097), with no statistical difference regarding urgent HT (5.9% vs 2.7%, p = 0.249).
Secondary endpoints showed higher all-cause mortality (17.6% vs 6.3%, p = 0.008) and a higher sudden cardiac death (7.8% vs 2.2%, p = 0.043) in the AF group, with no difference regarding death for worsening HF (3.9% vs 3.1%, p = 0.777). Complete data of univariable Cox analysis for prediction of the primary endpoint is presented in Table 3 and Table 4. HFSS, Sodium, NT-proBNP, right ventricular dysfunction, LVEF, CPET duration, heart rate recovery in the first minute after finishing CPET (HHR1) and initial and maximal SBP during CPET were predictors of the primary endpoint in both groups.
With the exception of HHR1, heart rate (HR) parameters during CPET were only predictors of the primary endpoint in the AF group, as seen with lower values of maximal HR, lower values of maximal (%) predicted HR and a lower variation of the HR during exercise, for patients with AF for whom the primary endpoint occurred and for those for whom it did not, respectively (Table 4).
On the other hand, the use of BB was only a predictor of the primary endpoint in the SR group (Table 3).
Relationship between CPET prognostic parameters and primary outcome
The power to predict the primary outcome by CPET parameters is represented in the supplementary index. Univariate Cox analysis shows that pVO2, pVO2 (%) predicted, pVO2 at AT, VE/VCO2 slope and OUES are all predictors of the primary outcome in both groups (p < 0.05 for all).
In addition to the Cox analysis, these CPET parameters were analysed for the highest AUC in the 12 months’ follow-up period. In the SR grofollow-up, VE/VCO2 slope had the highest
Table 4 – Univariate Cox proportional-hazards analysis (CPET parameters)
Characteristics
All SR AF
Wald Hazard ratio 95% CI p Wald Hazard ratio 95% CI p Wald Hazard ratio 95% CI p
Initial HR 0.220 1.006 0.983-1.029 0.639 2.265 1.024 0.993-1.056 0.132 1.414 0.977 0.940-1.015 0.234 Maximal HR 6.259 0.982 0.967-0.996 0.012 0.644 0.992 0.974-1.011 0.422 5.706 0.973 0.951-0.955 0.017 Maximal HR(%) predicted 8.343 0.962 0.937-0.968 0.004 1.864 0.975 0.941-1.011 0.172 5.590 0.958 0.924-0.993 0.018 Delta HR during exercise 10.141 0.969 0.951-0.988 0.001 3.324 0.979 0.956-1.002 0.068 6.527 0.960 0.930-0.991 0.011 HHR1 22.484 0.837 0.778-0.901 < 0.001 15.623 0.829 0.755-0.910 < 0.001 5.939 0.869 0.777-0.973 0.015 Initial SBP 13.913 0.946 0.919-0.974 < 0.001 8.317 0.951 0.919-0.984 0.004 4.346 0.939 0.885-0.996 0.037 Maximal SBP 21.896 0.959 0.943-0.976 < 0.001 12.029 0.964 0.945-0.984 0.001 7.205 0.954 0.922-0.987 0.007 Duration of CPET (min) 26.781 0.756 0.681-0.841 < 0.001 20.636 0.730 0.637-0.836 < 0.001 4.009 0.838 0.704-0.996 0.048 SR: sinus rhythm; AF: atrial fibrillation; CI: confidence interval; HR: heart rate; HHR1: heart rate recovery in the first minute after finishing CPET; SBP: systolic blood pressure; CPET: cardiopulmonary exercise test.
AUC value (0.906) followed by predicted pVO2 (%) (0.903), with OUES with the lower AUC value (0.798). Despite these numerical differences, no statistically significant difference was found when the Hanley & McNeil test was applied to compare the different AUC values of the CPET parameters.
In the AF group, predicted pVO2 (%) (0.878) and pVO2 (0.869) had the highest AUC values. Similarly to the SR group, OUES had the lowest AUC value (0.833), but no statistically significant difference was found when the Hanley & McNeil test was applied to compare these parameters.
The Hanley & McNeil test was applied for comparing each CPET AUC parameter in the AF versus SR groups as well, with no statistically significant difference found.
Multivariate Cox analysis (Table 5) showed that when pVO2 and the VE/VCO2 slope are analysed together, significant
differences were found between SR and AF groups. In the SR group, pVO2 lost his predictive power (p = 0.280) while the VE/VCO2 slope remained predictive of the primary outcome (p = 0.001). In the AF group, the VE/VCO2 slope lost its predictive power (p = 0.398) and pVO2 showed a trend towards the prediction of the primary outcome (p = 0.091). Similar results were found in the multivariate Cox analysis of predicted pVO2 (%) and the VE/VCO2 slope in the AF group (p = 0.094 and p = 0.145, respectively), while in the SR group there was a difference, since predicted (%) pVO2 (p = 0.006) and VE/VCO2 slope (p = 0.033) kept their predictive power (p = 0.006), while pVO2 had not (p = 0.280).
OUES lost its predictive power in the multivariate Cox analysis in both SR and AF groups when compared with pVO2
(p = 0.948 and p = 0.539, for SR and AF group respectively)
Table 5 – Multivariate Cox analysis of CPET1 prognostic parameters
Multivariate Cox analysis SR AF
Hazard ratio 95% CI p Hazard ratio 95% CI p
1) pVO2 vs VE/VCO2 slope
pVO2 0.910 0.766-1.080 0.280 0.759 0.551-1.045 0.091
VE/VCO2 slope 1.117 1.045-1.194 0.001 1.050 0.937-1.177 0.398
2) pVO2 (%) predicted vs VE/VCO2 slope
pVO2 (%) 0.933 0.888-0.981 0.006 0.942 0.879-1.010 0.094 VE/VCO2 slope 1.070 1.005-1.139 0.033 1.078 0.974-1.193 0.145 3) OUES5 vs VE/VCO 2 slope OUES 1.508 0.388-5.864 0.553 0.624 0.056-6.975 0.701 VE/VCO2 slope 1.170 1.090-1.256 < 0.001 1.123 1.002-1.258 0.046 4) pVO2 vs. OUES pVO2 0.742 0.597-0.922 0.007 0.623 0.482-0.907 0.014 OUES 1.061 0.183-6.153 0.948 2.335 0.156-34.907 0.539
Table 6 – Univariate Cox analysis for the primary outcome of the two recommended cardiopulmonary exercise test cut-offs for Heart Transplantation selection
SR AF
Hazard ratio 95% CI p Hazard ratio 95% CI p
pVO2 ≤ 12 ml/kg/min 8.673 3.048-24.680 < 0.001 44.220 8.686-225.129 < 0.001
VE/VCO2 slope > 35 20.858 5.985-72.696 < 0.001 5.613 1.164-27.059 0.032
SR: sinus rhythm; AF: atrial fibrillation; CI: confidence interval; pVO2: peak O2 consumption.
Table 7 – Proportion of patients correctely classified at 12 months of follow up AF SR pVO2 ≤ 12 ml/kg/min or ≤ 14 ml/kg/min without BB2 7/7 - 100% 5/13 - 38.5% pVO2 > 12 ml/kg/min or > 14 ml/ kg/min without BB 42/44 - 95.5% 198/210 - 94.3% pVO2 ≤ 12 ml/kg/min only in
patients doing BB 5/5 - 100% 6/8 - 75%
pVO2 > 12 ml/kg/min only in
patients doing BB 34/35 - 97.1% 161/169 - 95.3% VE/VCO2 slope > 35 7/21 - 33.3% 14/47 - 29.8% VE/VCO2 slope ≤ 35 28/30 - 92.3% 173/176 - 98.3%
SR: sinus rhythm; AF: atrial fibrillation; pVO2: peak O2 consumption; BB: beta-blockers.
and when compared with the VE/VCO2 slope (p = 0.503 and p = 0.701, for SR and AF group respectively).
Cut-off value for HT selection: PPV and NPV for the primary outcome
The univariate Cox analysis for the primary outcome of the two recommended CPET cut-offs for HT selection7
(pVO2 ≤ 12 ml/kg/min or ≤ 14 ml/kg/min without BB and VE/VCO2 slope ≤ 35) is represented in Table 6, showing that in the two groups, both cut-offs remained predictors of the outcome.
In pVO2 ≤ 12 ml/kg/min or ≤ 14 ml/kg/min without BB, the PPV for the primary outcome was 100% in the AF group and 38.5% in the SR group (Table 7), with a NPV of 95.5% and 94.3% in the AF and SR groups, respectively. Higher values were found when the analysis excluded patients not doing BB, with a PPV of 100% and 75%, and a NPV of 97.1% and 95.3% for the AF and RS groups respectively.
In VE/VCO2 slope > 35 (Table 7), lower values of PPV were reported (33.3% and 29.8% for AF and SR groups, respectively), with similar NPV to pVO2 (92.3% and 98.3% for AF and SR groups, respectively).
Discussion
The presence of AF is associated with a negative prognostic effect in HF, with 50-90% increased mortality and HF progression in the Framingham Heart Study.12 Our
population revealed some baseline differences between SR and AF groups, with some of that in previously described prognostic markers of HF, as AF patients were older,13,14
with lower GFR,15-17 with worse right ventricular function18
and a lower LVEF.19,20 In regard to CPET parameters, our
AF patients revealed a lower exercise capacity than SR patients since they had a higher VE/VCO2 slope and a
lower CPET duration, pVO2, OUES, time to AT and pVO2 at AT. As expected, these differences converted in a worse prognosis in the AF group, with a 2-fold increase in the primary endpoint events (17.6% VS 8.1%, p = 0.038) and 3-fold increase in all-cause mortality (17.6% VS 6.3%, p = 0.008) in the 1-year follow-up.
The majority of the predictors of the primary endpoint were predictors for both SR and AF groups. The HFSS,21 Sodium,22
NT-proBNP,23-25 right ventricular dysfunction,18 lower LVEF,19,20
CPET duration, HHR1,26 and initial and maximal SBP during
CPET27 were included in this group, with all of them being
formerly described as prognostic markers in HF patients.
Differences were found regarding maximal HR and variation of HR during the exercise, with lower values in AF patients predicting the primary outcome only in that group.
Patients not using BB were solely predictive of the primary outcome in the SR group, but not in the AF group. Whether this is in agreement with other studies that failed to reveal prognostic benefit from BB in the AF group of HF patients28-30
or to a underpowered analysis since only 11 patients in the AF group were not doing BB cannot be guaranteed.
Cut-off value for HT selection: PPV and NPV for the primary outcome
Whether HF patients with AF can be precisely stratified with the current CPET cut-offs for HT selection have not been specifically studied before. The cut-off value for pVO2 showed a PPV for the primary outcome of 100% in the AF group and 38.5% in the SR group, with a NPV of 95.5% and 94.3% in the AF and SR groups, respectively. Hence, despite AF carries a worse prognosis in HF patients, the current cut-off of pVO2 for HT selection can precisely stratified these high-risk patients, with no patients under the cut-off misdiagnosed as high risk patients and less than 5% of patients above the cut-off having the primary outcome in the 1-year follow-up (Figure 1). These results suggest that patients under the cut-off of pVO2 should be managed accordingly, considering quickly referring for HT or mechanical circulatory support, since medical treatment is associated with negative outcomes in a 1-year period, and that we can be relatively safe in regard to 1-year outcomes of patients above the cut-off.
In regard to SR patients, the lower risks associated are responsible for a lower value of PPV above the pVO2 cutoff. The PPV was raised from 38,5% to 75% when the analysis excluded patients not doing BB. The NPV remains high in this group (94,3%).
During exercise, both CO2 output and ventilation increase steadily, but in patients with HF, the slope of the relationship is increased.31 Previous studies have confirmed the prognostic
impact of VE/VCO2 in patients with HF, with higher values being associated with worse outcomes.32-35 However, the value
of VE/VCO2 in AF patients with HF is not so well established, with differences in results in some trials.36,37
In our study, with a VE/VCO2 slope > 35, lower values of PPV were reported (33.3% and 29.8% for AF and SR groups, respectively), with similar NPV compared to pVO2 results (92.3% and 98.3% for AF and SR groups, respectively, figure 1). The power to predict the primary outcome by the VE/VCO2 slope, revealed an AUC of 0.906 for the SR group (the highest of all the CPET parameters analysed) and 0.844 in the AF group, with no statistically significant difference found when comparing the different AUC values of the CPET parameters. These differences in PPV may suggest that despite the fact that VE/VCO2 slope could be at least as good for prognostic assessment in HF patients as pVO2, the cut-off to
use with the VE/VCO2 slope is not so well established as the cut-off for pVO2 in AF patients.
One previous study has shown that in a multivariate Cox analysis, pVO2 was identified as a sole significant predictor of cardiac events in HF patients in SR and the VE/VCO2 slope in AF patients.38 Our results, however, do not concur
with the previous results. In fact, our multivariate Cox analysis (Table 5) showed that when pVO2 and the VE/VCO2 slope are analysed together, pVO2 lost its predictive power (p = 0.280) while the VE/VCO2 slope remained predictive of the primary outcome (p = 0.001) in the SR group. In the AF group, the VE/VCO2 slope lost its predictive power
(p = 0.398) while pVO2 showed a trend for the prediction of the primary outcome (p = 0.091).
Figure 1 – Positive (PPV) and negative predictive value (NPV) of pVO2 and VE/VCO2 slope.
The predicted pVO2 (%) has been demonstrated as a useful prognostic marker in previous HF studies.39 In the multivariate
Cox analysis of predicted pVO2 (%) and the VE/VCO2 slope, predicted pVO2 (%) kept his predictive power in the SR group (p = 0.006) in contrast to pVO2, while in the AF group, it showed a trend towards prediction of the primary outcome (p = 0.094) and had the highest AUC predictive value (0.878). OUES is derived by plotting VO2 as a function of log10VE, which is an approximately linear relation, indicating how effectively O2 is extracted and taken into the body.40 In HF
patients, OUES is reduced in proportion to disease severity and linked to outcome.41,42 In our population, OUES had the
numerically lower AUC for predicting the primary outcome in both AF and SR groups and lost its predictive power in the multivariate Cox analysis when compared with pVO2 and when compared with the VE/VCO2 slope, which is in accordance with other previous study.43
Study limitations
There are limitations to our study that should be referenced. Even though data was obtained from the outpatient clinic visits, medical charts were reviewed and complemented with a standardized telephone interview to all patients at 12 months of follow-up to collect data for the primary and secondary outcomes. Information pertaining to the selection or not of rhythm control for the treatment of AF was not gathered. Despite this, the goal of the trial was to define, during the initial evaluation, which patients needed early indication for HT or mechanical circulatory support, reducing the importance of the aforementioned information.
Despite being a seven-year follow-up of patients evaluated for HT in one advanced HF centre, the analysed cohort was not larger than other studies of the relation between HF and AF.2,36,38 However, the sample size is similar to other studies
that highlighted the value of CPET parameters, including for the selection of patients for HT.8,32,35,44,45
Since patients were referred for a tertiary hospital for the purpose of evaluation with HF team and possible indication
1. Kannel WB, Abbott RD, Savage DD, McNamara PM. Epidemiologic features of chronic atrial fibrillation: the Framingham study. N Engl J Med. 1982;306(17):1018-22.
2. Santhanakrishnan R, Wang N, Larson MG, Magnani JW, McManus DD, Lubitz SA, et al. Atrial fibrillation begets heart failure and vice versa: temporal associations and differences in preserved versus reduced ejection fraction. Circulation. 2016;133(5):484-92.
3. Braunwald E. Cardiovascular medicine at the turn of the millennium: triumphs, concerns, and opportunities. N Engl J Med. 1997;337(19):1360-9. 4. Pocock SJ, Wang D, Pfeffer MA, Yusuf S, McMurray JJ, Swedberg KB, et al.
Predictors of mortality and morbidity in patients with chronic heart failure. Eur Heart J. 2006;27(1):65-75.
5. Dries DL, Exner DV, Gersh BJ, Domanski MJ, Waclawiw MA, Stevenson LW. Atrial fibrillation is associated with an increased risk for mortality and heart failure progression in patients with asymptomatic and symptomatic left ventricular systolic dysfunction: a retrospective analysis of the SOLVD trials. Studies of Left Ventricular Dysfunction. J Am Coll Cardiol. 1998;32(3):695-703.
6. Carson PE, Johnson GR, Dunkman WB, Fletcher RD, Farrell L, Cohn JN. The influence of atrial fibrillation on prognosis in mild to moderate heart failure. The V-HeFT Studies. The V-HeFT VA Cooperative Studies Group. Circulation. 1993;87(6 Suppl):VI102-10.
7. Mehra MR, Canter CE, Hannan MM, Semigran MJ, Uber PA, Baran DA, et al. The 2016 International Society for Heart Lung Transplantation listing criteria for heart transplantation: a 10-year update. J Heart Lung Transplant. 2016;35(1):1-23.
8. Butler J, Khadim G, Paul KM, Davis SF, Kronenberg MW, Chomsky DB, et al. Selection of patients for heart transplantation in the current era of heart failure therapy. J Am Coll Cardiol. 2004;43(5):787-93.
9. Aaronson KD, Schwartz JS, Chen TM, Wong KL, Goin JE, Mancini DM. Development and prospective validation of a clinical index to predict survival in ambulatory patients referred for cardiac transplant evaluation. Circulation. 1997;95(12):2660-7.
10. Guazzi M, Arena R, Halle M, Piepoli MF, Myers J, Lavie CJ. 2016 Focused update: clinical recommendations for cardiopulmonary exercise testing data assessment in specific patient populations. Circulation. 2016;133(24):e694-711.
11. Hanley JA, McNeil BJ. The meaning and use of the area under a receiver operating characteristic (ROC) curve. Radiology. 1982;143(1):29-36. 12. Wang TJ, Larson MG, Levy D, Vasan RS, Leip EP, Wolf PA, et al. Temporal
relations of atrial fibrillation and congestive heart failure and their joint influence on mortality: the Framingham Heart Study. Circulation. 2003;107(23):2920-5.
13. van Veldhuisen DJ, Boomsma F, de Kam PJ, Man in’t Veld AJ, Crijns HJ, Hampton JR, et al. Influence of age on neurohormonal activation and prognosis in patients with chronic heart failure. Eur Heart J. 1998;19(5):753-60.
14. Ho KK, Anderson KM, Kannel WB, Grossman W, Levy D. Survival after the onset of congestive heart failure in Framingham Heart Study subjects. Circulation. 1993;88(1):107-15.
15. Dries DL, Exner DV, Domanski MJ, Greenberg B, Stevenson LW. The prognostic implications of renal insufficiency in asymptomatic and symptomatic patients with left ventricular systolic dysfunction. J Am Coll Cardiol. 2000;35(3):681-9.
16. Al-Ahmad A, Rand WM, Manjunath G, Konstam MA, Salem DN, Levey AS, et al. Reduced kidney function and anemia as risk factors for mortality in patients with left ventricular dysfunction. J Am Coll Cardiol. 2001;38(4):955-62.
References
for HT or mechanical circulatory support, these patients may not be representative of the older or with higher comorbidities HF community, who are not candidate for advanced HF treatment.
Conclusions
Despite AF carries a worse prognosis for the HF patients, the current cut-off of pVO2 for HT selection can precisely stratify this group of high-risk patients. The findings from the present study suggest that HF patients with AF and a CPET under the current cut-off of pVO2 for HT selection should be
quickly referred for HT or mechanical circulatory support, since medical treatment is associated with negative outcomes in a 1-year period, with a higher PPV than patients in SR. In addition, pVO2 cut-off seems to have higher PPV than VE/VCO2 slope cut-off for the prediction of the primary outcome in HF patients with AF.
Author contributions
Conception and design of the research: Gonçalves AV, Silva T, Soares R; Acquisition of data: Pereira-da-Silva T, Soares R, Feliciano J, Moreira RI, Rio P; Analysis and interpretation of the data, Statistical analysis and Writing of the
manuscript: Gonçalves AV; Critical revision of the manuscript for intellectual content: Pereira-da-Silva T, Soares R, Abreu A, Ferreira RC.
Potential Conflict of Interest
No potential conflict of interest relevant to this article was reported.
Sources of Funding
There were no external funding sources for this study.
Study Association
This study is not associated with any thesis or dissertation work.
Ethics approval and consent to participate
This study was approved by the Ethics Committee of the Centro Hospitalar Lisboa Central under the protocol number CA2257. All the procedures in this study were in accordance with the 1975 Helsinki Declaration, updated in 2013. Informed consent was obtained from all participants included in the study.
17. Hillege HL, Girbes AR, de Kam PJ, Boomsma F, de Zeeuw D, Charlesworth A, et al. Renal function, neurohormonal activation, and survival in patients with chronic heart failure. Circulation. 2000;102(2):203-10.
18. Di Salvo TG, Mathier M, Semigran MJ, Dec GW. Preserved right ventricular ejection fraction predicts exercise capacity and survival in advanced heart failure. J Am Coll Cardiol. 1995;25(5):1143-53.
19. Funck-Brentano C, Boelle PY, Verstuyft C, Bornert C, Becquemont L, Poirier JM. Measurement of CYP2D6 and CYP3A4 activity in vivo with dextromethorphan: sources of variability and predictors of adverse effects in 419 healthy subjects. Eur J Clin Pharmacol. 2005;61(11):821-9. 20. Cohn JN, Johnson GR, Shabetai R, Loeb H, Tristani F, Rector T, et al.
Ejection fraction, peak exercise oxygen consumption, cardiothoracic ratio, ventricular arrhythmias, and plasma norepinephrine as determinants of prognosis in heart failure. The V-HeFT VA Cooperative Studies Group. Circulation. 1993;87(6 Suppl):VI5-16.
21. Koelling TM, Joseph S, Aaronson KD. Heart failure survival score continues to predict clinical outcomes in patients with heart failure receiving beta-blockers. J Heart Lung Transplant. 2004;23(12):1414-22.
22. Lee WH, Packer M. Prognostic importance of serum sodium concentration and its modification by converting-enzyme inhibition in patients with severe chronic heart failure. Circulation. 1986;73(2):257-67.
23. Hulsmann M, Berger R, Sturm B, Bojic A, Woloszczuk W, Bergler-Klein J, et al. Prediction of outcome by neurohumoral activation, the six-minute walk test and the Minnesota Living with Heart Failure Questionnaire in an outpatient cohort with congestive heart failure. Eur Heart J. 2002;23(11):886-91. 24. Tsutamoto T, Wada A, Maeda K, Hisanaga T, Mabuchi N, Hayashi M, et al.
Plasma brain natriuretic peptide level as a biochemical marker of morbidity and mortality in patients with asymptomatic or minimally symptomatic left ventricular dysfunction. Comparison with plasma angiotensin II and endothelin-1. Eur Heart J. 1999;20(24):1799-807.
25. Gardner RS, Ozalp F, Murday AJ, Robb SD, McDonagh TA. N-terminal pro-brain natriuretic peptide. A new gold standard in predicting mortality in patients with advanced heart failure. Eur Heart J. 2003;24(19):1735-43. 26. Arena R, Guazzi M, Myers J, Peberdy MA. Prognostic value of heart rate recovery in patients with heart failure. Am Heart J. 2006;151(4):851 e7-13. 27. Jackson CE, Castagno D, Maggioni AP, Kober L, Squire IB, Swedberg K, et al. Differing prognostic value of pulse pressure in patients with heart failure with reduced or preserved ejection fraction: results from the MAGGIC individual patient meta-analysis. Eur Heart J. 2015;36(18):1106-14.
28. Cleland JGF, Bunting KV, Flather MD, Altman DG, Holmes J, Coats AJS, et al. Beta-blockers for heart failure with reduced, mid-range, and preserved ejection fraction: an individual patient-level analysis of double-blind randomized trials. Eur Heart J. 2018;39(1):26-35.
29. Kotecha D, Flather MD, Altman DG, Holmes J, Rosano G, Wikstrand J, et al. Heart Rate and Rhythm and the Benefit of Beta-Blockers in Patients With Heart Failure. J Am Coll Cardiol. 2017;69(24):2885-96.
30. Kotecha D, Holmes J, Krum H, Altman DG, Manzano L, Cleland JG, et al. Efficacy of beta blockers in patients with heart failure plus atrial fibrillation: an individual-patient data meta-analysis. Lancet. 2014;384(9961):2235-43. 31. Buller NP, Poole-Wilson PA. Mechanism of the increased ventilatory response to exercise in patients with chronic heart failure. Br Heart J. 1990;63(5):281-3.
32. Francis DP, Shamim W, Davies LC, Piepoli MF, Ponikowski P, Anker SD, et al. Cardiopulmonary exercise testing for prognosis in chronic heart failure: continuous and independent prognostic value from VE/VCO(2)slope and peak VO(2). Eur Heart J. 2000;21(2):154-61.
33. Corra U, Mezzani A, Bosimini E, Scapellato F, Imparato A, Giannuzzi P. Ventilatory response to exercise improves risk stratification in patients with chronic heart failure and intermediate functional capacity. Am Heart J. 2002;143(3):418-26.
34. Tabet JY, Beauvais F, Thabut G, Tartiere JM, Logeart D, Cohen-Solal A. A critical appraisal of the prognostic value of the VE/VCO2 slope in chronic heart failure. Eur J Cardiovasc Prev Rehabil. 2003;10(4):267-72. 35. Arena R, Myers J, Abella J, Peberdy MA, Bensimhon D, Chase P, et al.
Development of a ventilatory classification system in patients with heart failure. Circulation. 2007;115(18):2410-7.
36. Elshazly MB, Senn T, Wu Y, Lindsay B, Saliba W, Wazni O, et al. Impact of atrial fibrillation on exercise capacity and mortality in heart failure with preserved ejection fraction: insights from cardiopulmonary stress testing. J Am Heart Assoc. 2017;6(11):pii: e006662.
37. Agostoni P, Emdin M, Corra U, Veglia F, Magri D, Tedesco CC, et al. Permanent atrial fibrillation affects exercise capacity in chronic heart failure patients. Eur Heart J. 2008;29(19):2367-72.
38. Tsuneoka H, Koike A, Nagayama O, Sakurada K, Kato J, Sato A, et al. Prognostic value of cardiopulmonary exercise testing in cardiac patients with atrial fibrillation. Int Heart J. 2012;53(2):102-7.
39. Stelken AM, Younis LT, Jennison SH, Miller DD, Miller LW, Shaw LJ, et al. Prognostic value of cardiopulmonary exercise testing using percent achieved of predicted peak oxygen uptake for patients with ischemic and dilated cardiomyopathy. J Am Coll Cardiol. 1996;27(2):345-52.
40. Baba R, Nagashima M, Goto M, Nagano Y, Yokota M, Tauchi N, et al. Oxygen uptake efficiency slope: a new index of cardiorespiratory functional reserve derived from the relation between oxygen uptake and minute ventilation during incremental exercise. J Am Coll Cardiol. 1996;28(6):1567-72.
41. Van Laethem C, Van De Veire N, De Backer G, Bihija S, Seghers T, Cambier D, et al. Response of the oxygen uptake efficiency slope to exercise training in patients with chronic heart failure. Eur J Heart Fail. 2007;9(6-7):625-9.
42. Davies LC, Wensel R, Georgiadou P, Cicoira M, Coats AJ, Piepoli MF, et al. Enhanced prognostic value from cardiopulmonary exercise testing in chronic heart failure by non-linear analysis: oxygen uptake efficiency slope. Eur Heart J. 2006;27(6):684-90.
43. Arena R, Myers J, Hsu L, Peberdy MA, Pinkstaff S, Bensimhon D, et al. The minute ventilation/carbon dioxide production slope is prognostically superior to the oxygen uptake efficiency slope. J Card Fail. 2007;13(6):462-9.
44. Chua TP, Ponikowski P, Harrington D, Anker SD, Webb-Peploe K, Clark AL, et al. Clinical correlates and prognostic significance of the ventilatory response to exercise in chronic heart failure. J Am Coll Cardiol. 1997;29(7):1585-90. 45. Mancini DM, Eisen H, Kussmaul W, Mull R, Edmunds LH, Jr, Wilson JR.
Value of peak exercise oxygen consumption for optimal timing of cardiac transplantation in ambulatory patients with heart failure. Circulation. 1991;83(3):778-86.