Gender differences in first-year college students’ academic
expectations
António M. Diniza*, Sonia Alfonsob, Alexandra M. Araújoc, Manuel Deañob,
Alexandra R. Costad, Ângeles Condeband Leandro S. Almeidae
aDepartment of Psychology, University of Évora, Évora, Portugal; bDepartment of
Evolutionary Psychology and Communication, University of Vigo, Ourense, Spain;
c
Department of Psychology and Education, Oporto Global University, Porto, Portugal;
d
School of Engineering, Polytechnic Institute of Porto, Porto, Portugal; eInstitute of
Education, University of Minho, Braga, Portugal
Based on a multidimensional definition of academic expectations (AEs), the authors examine students’ AE component scores across countries and genders. Two samples (343 Portuguese and 358 Spanish students) completed the Academic Perceptions Questionnaire (APQ) six months after enrolling in their universities. Factorial invariance was ensured across countries and genders, allowing us to study AEs using the APQ for both genders and in both countries. No significant differences in factor means were found between countries, indicating that AEs are not an obstacle to student mobility. Gender differences were found in some AE factor means, Training for employment, Personal and social development, Student mobility, Political engagement and citizenship, and Social pressure, with males exhibiting higher scores. Because these differences are not supported by most literature in this domain, further studies are needed to clarify the causes of women’s lower expectations and, therefore, risk of adaptation difficulties.
Keywords: academic engagement; student expectations; first-year students; gender differences; structural equation modelling
Introduction
Adapting to higher education (HE) is an ongoing process determined by not only stu- dents’ pre-college characteristics but also how they cope with the many challenges they face in their new academic and social environments. Research on the transition and adjustment to HE has produced various descriptive and explanatory models of student academic success. Whereas some studies focus on students’ personal character- istics (Krumrei-Mancuso et al. 2013; Soares et al. 2009), others stress the importance of the environment, including the institution’s climate, student services, and curricula (Pascarella and Terenzini 2005; Tinto 2010).
The current study focuses on academic expectations (AEs), which is one of the many personal variables that impact students’ adjustment and success. This construct includes motivations and cognitions, such as students’ perceptions, aspirations, and
desires related to their learning experiences and development in HE. Because AEs are associated with students’ past academic experiences and future prospects, they predict students’ adjustment, success, and engagement with and commitment to their academic and extracurricular activities (Baker, McNeil, and Siryk 1985; Kuh et al. 2008; Pascar- ella and Terenzini 2005; Smith and Wertlieb 2005).
AEs are the origins of students’ aspirations and investments in the various areas of learning and development in HE. Thus, many researchers suggest that AEs is a multi- dimensional construct (Baker, McNeil, and Siryk 1985; Goodboy and Myers 2008; Kuh et al. 2008). Following this multidimensional approach to the definition of expec- tations, we propose assessing AEs according to the following seven categories (Deaño et al. 2015): (1) Training for employment, which involves students’ education and train- ing in HE with respect to career development and the transition into the labour market, as well as their desire for a prestigious occupation and professional success; (2) Per- sonal and social development, which involves internal psychological traits, such as identity, autonomy, responsibility, self-confidence, and self-efficacy; (3) Student mobi- lity, which includes students’ aspirations to participate in student exchange pro- grammes, take classes abroad, and participate in internships in other countries to obtain an internationally recognised education and degree; (4) Political engagement and citizenship, which entails aspirations to transform society, engage in volunteer work, and help others; (5) Social pressure, which includes students’ desire to meet family and friends’ expectations and reciprocate society’s investment in their edu- cation; (6) Quality of education, which involves developing scientific content, partici- pating in scientific activities, and engaging in research experiences related to their academic interests; and (7) Social interaction, which involves the desire to participate in student social activities and to recreational or leisure extracurricular activities on campus.
Research indicates that AEs are influenced by personal characteristics, especially gender. However, the findings are inconsistent. Further research must clarify gender differences in students’ expectations regarding their personal experiences of HE.
Studies suggest that women have higher expectations regarding college and attain- ing a more qualified job than men (Mau and Bikos 2000; Mello 2008), as reflected in women’s higher enrolment rate and achievement in HE (Goldin, Katz, and Kuziemko 2006; Hayes and Richardson 1995; Wells, Seifert, and Saunders 2013). Other studies show that women are more attached to and emotionally dependent on their families and friends during their first year of HE, which may negatively impact their autonomy and interest in international mobility programmes, participation in scientific activities conducted by their teachers, or involvement in activities that promote political engage- ment or leadership (López 2014; Sax and Harper 2007; Zeldin, Britner, and Pajares 2008). Women’s increased degree of emotional dependency on family and desire to satisfy their parents’ expectations may be related to their decision to enrol in institutions located close to home so that they can balance education and family responsibilities. Women also dedicate more time to studying and are more committed to attaining their degree than men (Dwyer, Hodson, and McCloud 2013; Wells, Seifert, and Saunders 2013). Moreover, women engage in more frequent and positive social inter- actions than men (Gibson and Lawrence 2010; Sax, Bryant, and Harper 2005), develop higher levels of social commitment and engage in volunteer activities that benefit others more frequently than men (Dwyer, Hodson, and McCloud 2013; Hu and Wolniak 2013; Sax and Harper 2007). However, men seem to benefit more from their social inter- actions in the social and political spheres. They are more active in political and
student association activities due to their more positive self-evaluations of leadership skills and competitiveness (Sax, Bryant, and Harper 2005; Sax and Harper 2007). The current study
In this study, we aim to examine differences in first-year students’ expectations of HE in two countries, Spain (northwest) and Portugal (north). These two regions constitute a geographical trans-border Euro-region called Galicia-Northern Portugal. They have common historical ties and similar economic, sociocultural, and linguistic character- istics (Díaz 2007; Xunta de Galicia 2014). This specific Euro-region is characterised by many systems of collaboration and cooperation in the field of HE, such as exchange programmes, student and teacher mobility (IACOBUS), work communities (Galicia- Northern Portugal Work Community), and study centres (Centre of Euro Regional Studies Galicia-Northern Portugal).
Research on the quality of students’ experiences in mobility programmes must employ measures with structural validity and cultural equivalence in the assessed dimensions. In addition, gender differentiates students’ motivations, expectations, and adjustment to college and, therefore, should be taken into account in studies. Thus, the measures should also be gender-invariant. Thus, in the current study, we aim to establish the cultural equivalence and gender invariance of the Academic Per- ceptions Questionnaire (APQ) as preconditions for the analysis of gender-related and country-specific differences in students’ AEs.
Method
Participants
A sample of 701 Portuguese (Minho) (n = 343) and Spanish (Galician) (n = 358) first- year college students (ages ranging from 17 to 23 years; Mdn = 19) volunteered to par- ticipate in this study (students older than 23 years were excluded). The sample was mostly composed of women (63.3%, n = 444) and was selected from two public univer- sities (one in northern Portugal and one in northern Spain) using convenience sampling. No association was found between the observed variables, gender, and university (χ2 =
0.96, df = 1, p = ns).
Instrument
Students’ AEs were measured using the APQ (Deaño et al. 2015). This instrument con- tains 42 items that are organised into 7 subscales: Training for employment (F1, 8 items), Personal and social development (F2, 8 items), Student mobility (F3, 8 items), Political engagement and citizenship (F4, 6 items), Social pressure (F5, 4 items), Quality of education (F6, 4 items), and Social interaction (F7, 4 items). Stu- dents responded to each question on a 6-point Likert-type scale ranging from 1 (strongly disagree) to 6 (strongly agree).
Data collection and analysis
At the beginning of the second semester, we obtained teachers’ permission and stu- dents’ informed consent to voluntarily participate in the study. Then, data were
collected in the classroom. Students were selected to ensure heterogeneity of major subjects.
The IBM SPSS Statistics for Windows (version 22.0) was used for descriptive data analysis. Missing values were substituted by the respective distributional median. The APQ seven-factor oblique model was tested using LISREL 8.80 (Jöreskog and Sörbom 2006). Model testing with ordered categorical data in LISREL 8, such as the data gen- erated with the APQ items, implies a specific type of parameterisation (Millsap and Yun-Tein 2004). In PRELIS 2 (Jöreskog and Sörbom 1996), the items underlying latent continuous and normal responses cut by m – 1 threshold parameters (m = number of response options) are used to produce the means and the polychoric covari- ances of the observed variables and their asymptotic covariances. The first two thresholds are fixed to zero and one, respectively, and the others are estimated.
Model estimation was performed with the SIMPLIS command language (Jöreskog and Sörbom 1993) using the robust Satorra–Bentler scaled correction for maximum likelihood (Satorra and Bentler 1994). To assign the units of measurement to each APQ factor, we fixed the path of one of its items to one.
To test the factorial invariance of ordered categorical data across groups (Millsap and Yun-Tein 2004), we must first estimate the means and covariances of each group’s latent continuous and normal counterparts in PRELIS 2 under fixed thresholds to the pooled thresholds estimated in the combined group. In a second step, the means and the covariance matrices of this multi-group analysis are entered into LISREL 8 to test the model of interest.
A multi-group factorial invariance analysis typically begins with the study of the model’s configural or form invariance, with all parameters freely estimated across groups. This baseline model is used to test more restrictive conditions across groups, namely, weak, strong, and strict invariance (Meredith 1993), to guarantee model equivalence at the measurement level. For weak invariance, factor loadings should be equivalent across groups, and all other model parameters are freely estimated. This model is compared with the form invariant model. For strong invariance to be achieved, factor loadings plus fitted means or intercepts (values of each item corre- sponding to the zero value of the factor) should be equivalent across groups. This model is compared with the weak invariant model. To achieve strict invariance, researchers should make factor loadings, intercepts, and residuals equivalent across groups. This model is compared with the strong invariant model. If strong invariance is attained, the measurement scales have the same unit of measurement and origin across groups, thereby allowing for the testing of invariance in factor means across groups (Cheung and Rensvold 2002). This model is compared with the strong invariant model. In factor means comparisons across groups using LISREL 8, the mean of the first group is fixed to zero, and the other group means are estimated (Jöreskog and Sörbom 1993). To complete the factorial invariance analysis at the factor level, researchers should conduct a test of the invariance of factor variances and covariances, and the models should be compared with the weak invariant model (Cheung and Rensvold 2002). In this research, we conducted an omnibus test of factor variances and covariances, as suggested by Vanderberg and Lance (2000).
In testing factorial invariance, model fit is typically assessed based on goodness- of-fit (GOF) statistics and the χ2 difference (∆) (Bollen 1989; Satorra and Bentler
2001) between a restricted model (a model with specific parameters constrained to be equal across groups) and a full model (a model in which parameters are uncon- strained for all groups). However, in tests of the invariance of a very large model
with a medium to large sample, such as our model, the ∆χ2 test would be high and stat-
istically significant because of its excessive sensitivity to sample size (Bentler and Bonett 1980). Accordingly, it would inappropriately lead to model rejection (Type I error). Therefore, scholars recommend the use of ∆CFI to overcome this problem (Cheung and Rensvold 2002): a ∆CFI value between a restricted model and a full model less than −.01 indicates non-invariance of the restricted model.
Meanwhile, the fit of the restricted model to the empirical data was examined using the following GOF practical (or heuristic) indices and respective cut-off values: the relative or normed chi-square (χ2/df), with a value equal to or less than 3 indicating
a good fit (Iacobucci 2009); the comparative fit index (CFI), with .90 representing an acceptable model (by convention) and close to or above .95 indicating a good fit (Hu and Bentler 1999); and the root mean square error of approximation (RMSEA), with values close to or below .06 representing a good fit (Hu and Bentler 1999) and close to or below .08 indicating an acceptable fit (Browne and Cudeck 1993).
Finally, before testing the APQ model differences in factor means across genders, we assessed the structural validity of the APQ following a two-step modelling approach (Anderson and Gerbing 1988; Jöreskog and Sörbom 1993). The MLSB estimates for the
within-group completely standardised solution of the weak invariant model allowed us to examine factor convergent (CV) and discriminant (DV) validity, as well as their composite reliability (CR) (Fornell and Larcker 1981) for both men and women. Factor CV was assessed by the items’ average variance extracted (AVE), which should be at least .50. Factor DV was assessed by comparing the shared variance (j2;
squared disattenuated correlation) between any two factors and the AVE of each factor: the values of the former should be lower than those of the latter. Factor reliability is deemed acceptable for group comparisons when it reaches .80 (Nunnally and Bernstein 1994).
Results
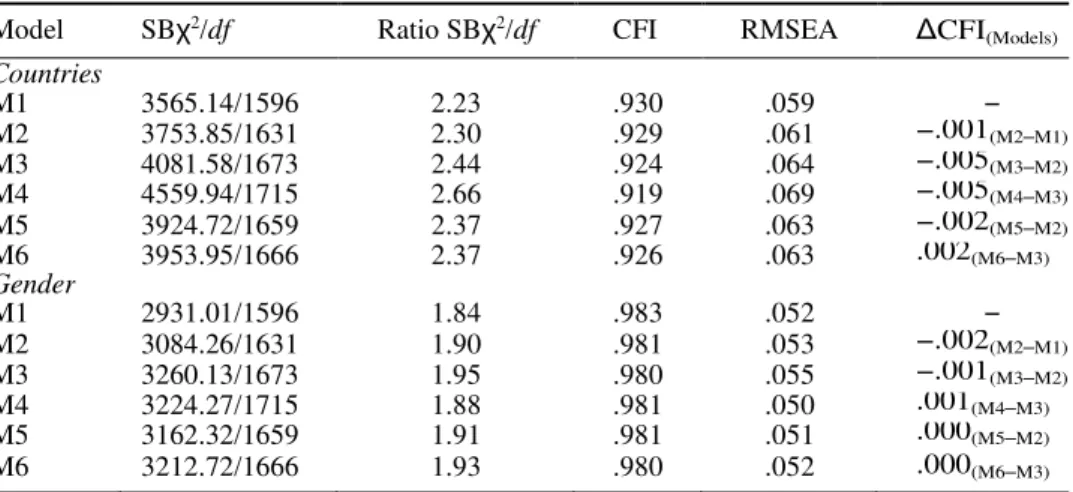
Table 1 shows that the factorial invariance of the APQ 7-factor oblique model across countries and genders was achieved at both the measurement level (M1–M4) and the factor level (M5 and M6).
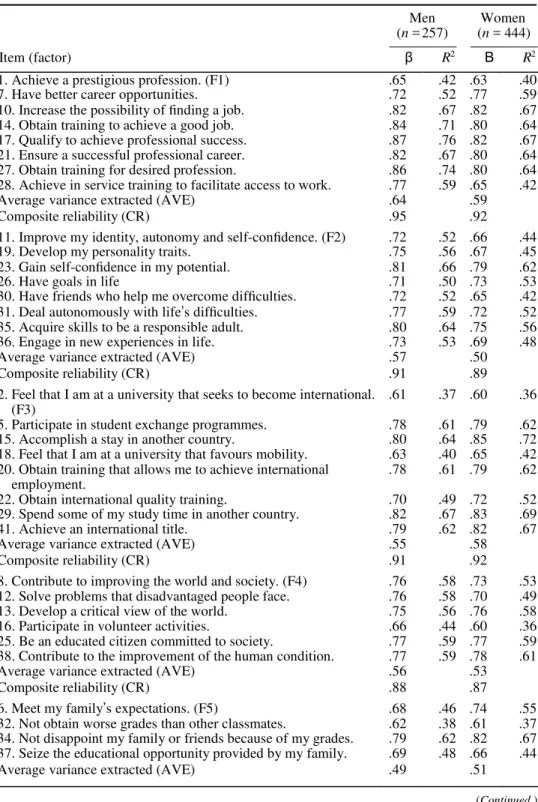
We ensured model equivalence across countries (with no significant differences in factor means between countries: ranging from T = 0.13 to T = 1.80) and focused on model substantive results across gender. Table 2 presents the content of the APQ items and some psychometric properties of the instrument.
Table 2 indicates that all items adequately represented their respective factors for both men and women. The results also revealed satisfactory CV (AVE) and CR for F1 to F5, with F5 showing that men’s scores were slightly below the desired values. Moreover, the AVE and CR results were below the desired values for F6 (for men) and F7 (for women).
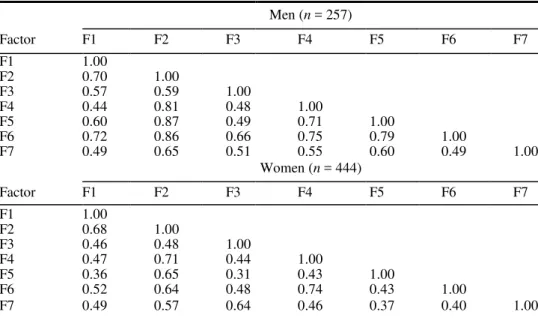
Tables 2 and 3 show that all factor DVs were ensured for women, except for the pairs F2–F4 (j2 = .50) and F4–F6 (j2 = .55), which revealed minor DV problems
due to factor CV in F4 (AVE = .53; see Table 2). For men, the following pairs of factors showed excessive shared variance considering their AVE: F2–F4 (j2 = .66),
F2–F5 (j2 = .76), F2–F6 (j2 = .74), F4–F5 (j2 = .50), F4–F6 (j2 = .56), and F5–F6
(j2 = .62). Note that the pairs F4–F5 and F4–F6 exhibited smaller DV problems than
the other pairs because their shared variance was lower than and equal to, respectively, the CV value obtained in F4 (AVE = .56; see Table 2).
Table 1. APQ 7-factor oblique model: factorial invariance across countries and gender.
Model SBχ2/df Ratio SBχ2/df CFI RMSEA ∆CFI
(Models) Countries M1 3565.14/1596 2.23 .930 .059 – M2 3753.85/1631 2.30 .929 .061 −.001(M2–M1) M3 4081.58/1673 2.44 .924 .064 −.005(M3–M2) M4 4559.94/1715 2.66 .919 .069 −.005(M4–M3) M5 3924.72/1659 2.37 .927 .063 −.002(M5–M2) M6 3953.95/1666 2.37 .926 .063 .002(M6–M3) Gender M1 2931.01/1596 1.84 .983 .052 – M2 3084.26/1631 1.90 .981 .053 −.002(M2–M1) M3 3260.13/1673 1.95 .980 .055 −.001(M3–M2) M4 3224.27/1715 1.88 .981 .050 .001(M4–M3) M5 3162.32/1659 1.91 .981 .051 .000(M5–M2) M6 3212.72/1666 1.93 .980 .052 .000(M6–M3)
Abbreviations: SB – Satorra–Bentler, CFI – comparative fit index, RMSEA – root mean square error of approximation, ∆ – difference between tested model and baseline model, M1 – form invariance, M2 – factor loadings invariance (weak), M3 – M2 plus intercepts invariance (strong), M4 – M3 plus residual invariance (strict), M5 – M2 plus factor variance and covariance invariance, M6 – M3 plus factor means invariance.
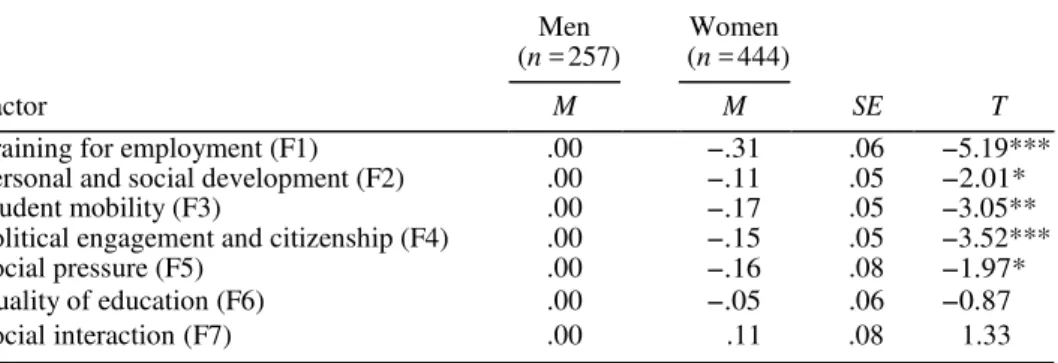
Between-group differences in the means of five factors were significant (Table 4). Men exhibited higher factor means than women on Training for employment, Personal and social development, Student mobility, Political and citizenship involvement, and Social pressure. These differences are most notable for Training for employment, Student mobility, and Political and citizenship involvement, while a similar mean was identified for Quality of education. Furthermore, although women presented higher Social interaction scores, the results were not statistically significant.
Discussion
The results of the current study showed that the APQ 7-factor oblique model (Deaño et al. 2015) was fully invariant at the measurement and factor levels across Portuguese and Spanish first-year college students. Namely, strict invariance (Meredith 1993) was achieved, indicating no translation problems between the two linguistic versions.
The model was also fully invariant for both men and women. According to the weak and strong invariance obtained (Meredith 1993), the factors represent the same constructs and are manifested in the same way in men and women, with the same cross-gender differences. Moreover, the observed invariance of factor variance and covariance indicates that construct variability and interrelationships are the same for male and female students.
Meanwhile, all factors presented an adequate operational definition (convergent validity and composite reliability; Fornell and Larcker 1981), with the exception of the factors Quality of education for men and Social interaction for women. A different pattern of factor discriminant validity (Fornell and Larcker 1981) was identified between women and men. Specifically, among women, problems were noted between Political engagement and Quality of education, whereas among men, problems were found between Social pressure and Quality of education and between Personal and social development and three factors, Political engagement, Social pressure, and
Table 2. APQ 7-factor oblique model: maximum likelihood estimates, average variance extracted, and composite reliability by gender.
Men
(n = 257) (n = 444) Women
Item (factor) β R2 Β R2
1. Achieve a prestigious profession. (F1) .65 .42 .63 .40 7. Have better career opportunities. .72 .52 .77 .59 10. Increase the possibility of finding a job. .82 .67 .82 .67 14. Obtain training to achieve a good job. .84 .71 .80 .64 17. Qualify to achieve professional success. .87 .76 .82 .67 21. Ensure a successful professional career. .82 .67 .80 .64 27. Obtain training for desired profession. .86 .74 .80 .64 28. Achieve in service training to facilitate access to work. .77 .59 .65 .42
Average variance extracted (AVE) .64 .59
Composite reliability (CR) .95 .92
11. Improve my identity, autonomy and self-confidence. (F2) .72 .52 .66 .44
19. Develop my personality traits. .75 .56 .67 .45
23. Gain self-confidence in my potential. .81 .66 .79 .62
26. Have goals in life .71 .50 .73 .53
30. Have friends who help me overcome difficulties. .72 .52 .65 .42 31. Deal autonomously with life’s difficulties. .77 .59 .72 .52 35. Acquire skills to be a responsible adult. .80 .64 .75 .56 36. Engage in new experiences in life. .73 .53 .69 .48
Average variance extracted (AVE) .57 .50
Composite reliability (CR) .91 .89
2. Feel that I am at a university that seeks to become international. .61 .37 .60 .36 (F3)
5. Participate in student exchange programmes. .78 .61 .79 .62 15. Accomplish a stay in another country. .80 .64 .85 .72 18. Feel that I am at a university that favours mobility. .63 .40 .65 .42 20. Obtain training that allows me to achieve international .78 .61 .79 .62
employment.
22. Obtain international quality training. .70 .49 .72 .52 29. Spend some of my study time in another country. .82 .67 .83 .69
41. Achieve an international title. .79 .62 .82 .67
Average variance extracted (AVE) .55 .58
Composite reliability (CR) .91 .92
8. Contribute to improving the world and society. (F4) .76 .58 .73 .53 12. Solve problems that disadvantaged people face. .76 .58 .70 .49 13. Develop a critical view of the world. .75 .56 .76 .58 16. Participate in volunteer activities. .66 .44 .60 .36 25. Be an educated citizen committed to society. .77 .59 .77 .59 38. Contribute to the improvement of the human condition. .77 .59 .78 .61
Average variance extracted (AVE) .56 .53
Composite reliability (CR) .88 .87
6. Meet my family’s expectations. (F5) .68 .46 .74 .55 32. Not obtain worse grades than other classmates. .62 .38 .61 .37 34. Not disappoint my family or friends because of my grades. .79 .62 .82 .67 37. Seize the educational opportunity provided by my family. .69 .48 .66 .44
Average variance extracted (AVE) .49 .51
Table 2. (Continued)
Men
(n = 257) (n = 444) Women
Item (factor) β R2 Β R2
Composite reliability (CR) .79 .80
33. Participate in debates or scientific conferences. (F6) .60 .36 .62 .38 39. Deepen my knowledge of specific subjects. .70 .49 .80 .64 40. Participate in research projects. .63 .40 .70 .49 42. Correspond to society’s investment in higher education. .67 .45 .72 .52
Average variance extracted (AVE) .42 .51
Composite reliability (CR) .75 .80
3. Enjoy living with others and having fun. (F7) .77 .59 .76 .58 4. Engage in extracurricular activities. .83 .69 .68 .46 9. Establish a weekly schedule that allows for other activities. .66 .44 .56 .31 24. Attend university student parties. .57 .32 .50 .25
Average variance extracted (AVE) .51 .40
Composite reliability (CR) .80 .72
Note: Within-group results from the completely standardised solution of the weak invariant model. Abbreviations: F1 – Training for employment, F2 – Personal and social development, F3 – Student mobility, F4 – Political and citizenship involvement, F5 – Social pressure, F6 – Quality of education, F7 – Social interaction. β = standardised factor loading (with p < .001); R2 (communality) = 1 – ε (standardised
residual).
Table 3. APQ 7-factor oblique model: disattenuated correlations by gender. Men (n = 257) Factor F1 F2 F3 F4 F5 F6 F7 F1 1.00 F2 0.70 1.00 F3 0.57 0.59 1.00 F4 0.44 0.81 0.48 1.00 F5 0.60 0.87 0.49 0.71 1.00 F6 0.72 0.86 0.66 0.75 0.79 1.00 F7 0.49 0.65 0.51 0.55 0.60 0.49 1.00 Women (n = 444) Factor F1 F2 F3 F4 F5 F6 F7 F1 1.00 F2 0.68 1.00 F3 0.46 0.48 1.00 F4 0.47 0.71 0.44 1.00 F5 0.36 0.65 0.31 0.43 1.00 F6 0.52 0.64 0.48 0.74 0.43 1.00 F7 0.49 0.57 0.64 0.46 0.37 0.40 1.00
Notes: Within-group data from the completely standardised solution of the weak invariant model. All disattenuated correlations (j) < .001.
Abbreviations: F1 – Training for employment, F2 – Personal and social development, F3 – Student mobility, F4 – Political and citizenship involvement, F5 – Social pressure, F6 – Quality of education, F7 – Social interaction.
Table 4. APQ 7-factor oblique model: comparisons of factor means by gender. Men
(n = 257) (n = 444) Women
Factor M M SE T
Training for employment (F1) .00 −.31 .06 −5.19***
Personal and social development (F2) .00 −.11 .05 −2.01*
Student mobility (F3) .00 −.17 .05 −3.05**
Political engagement and citizenship (F4) .00 −.15 .05 −3.52***
Social pressure (F5) .00 −.16 .08 −1.97*
Quality of education (F6) .00 −.05 .06 −0.87
Social interaction (F7) .00 .11 .08 1.33
*p < .05, **p < .01, ***p < .001.
Note: Data from the model with strong invariance plus invariance of factor means.
Quality of education. Identical psychometric problems with the APQ were observed in the study conducted by Deaño et al. (2015). Overall, the current study results indicate that the negative psychometric aspects of the APQ are manifested more strongly for men than women.
The results also suggest significant gender differences in AEs. Men had higher expectations than women in five of the seven dimensions, and this difference was most evident in Training for employment and Political engagement. Moreover, some of these differences conflict with previous studies that found that women expressed higher expectations with respect to training to achieve future employment than men (Mau and Bikos 2000; Mello 2008). These divergent results may be due to the timing of the AEs assessment in this study compared to that in the cited studies, as this study measured expectations after the students had completed the first academic semester. Accordingly, based on their experiences and given the instrumental nature of the dimension, women may have adjusted their initial expectations for future employment more than men (Conde et al. 2014). The finding that men have higher expectations of participating in political activities and student associations is consistent with the results of other studies (Sax, Bryant, and Harper 2005; Sax and Harper 2007) and men’s higher levels of self-efficacy regarding their capacity for leadership and com- petitiveness, as these aspects are more closely tied to personal characteristics than to the instrumentality of the aspirations assessed.
Some differences, although not as obvious, were also found in Student mobility, Personal and social development, and Social pressure, with men exhibiting higher scores than women. As expected, and in accordance with the findings of previous studies on college students’ personal characteristics, the current study found that women had slightly lower expectations regarding mobility and autonomy than men (López 2014; Sax and Harper 2007; Zeldin, Britner, and Pajares 2008) due to their greater emotional dependence on family and friends during their first year of HE. Men’s higher scores on Personal and social development may be due to the over-esti- mation bias that men frequently show when reporting their competencies and self-effi- cacy (López 2014; Sander 2009; Zeldin, Britner, and Pajares 2008) and the socially constructed stereotype that men are status strivers and leaders (Sax and Harper 2007). However, the results are not consistent with studies showing that women feel greater pressure to complete their studies because of family responsibilities than men
(Dwyer, Hodson, and McCloud 2013; Wells, Seifert, and Saunders 2013); rather, they reveal that men and women experience a similar level of pressure.
Finally, no gender differences were observed in Quality of education or Social inter- action. This result is striking given that previous studies emphasise women’s greater need to seek support from others, thus implying that women engage in positive social interactions more frequently than men (Gibson and Lawrence 2010; Sax, Bryant, and Harper 2005).
These gender differences are not easily interpretable. They may be caused by the interaction of sociocultural factors, students’ individual characteristics, the organisation of the institutions and the interactions (academic and non-academic) between agents in these contexts (teachers and peers) (Hayes and Richardson 1995; Shaw 2013; Whitt et al. 2003). Moreover, the differences may result from the fact that the data were col- lected after a full academic term. During the first semester, women may have modified their initially high expectations, adjusting them to the reality of their institutional and academic environment and their own experiences in this context (Cook and Leckey 1999; Goldfinch and Hughes 2007). This adjustment may have led to their lower scores on factors such as Training for employment and Student mobility, which, in this case, may be considered more realistic than the scores obtained by men (Conde et al. 2014).
Concluding comments
In the present study, there were no differences in the interpretation of the model of mul- tidimensional functioning of AEs in the seven assessed dimensions of expectations, and there were no factor means differences between Galician and northern Portuguese stu- dents’ results. These findings suggest a significant similarity between students of the two regions; thus, AEs do not seem to be an obstacle for student mobility between the two universities in this Euro-region.
Another highlight of this study is the evidence of gender invariance in the APQ, which allows for gender comparisons of students’ AEs. The results of these compari- sons in our study showed that women exhibit lower AEs on five of the seven assessed dimensions, specifically, Training for employment, Personal and social development, Student mobility, Political engagement and citizenship, and Social pressure. As AEs are related to students’ success and persistence in college, interventions should address women’s lower AEs at the end of the first year and resulting higher risk of dis- satisfaction and attrition. Further studies are needed to understand the causes of these differences and to support educational practices that promote gender equality in HE.
The interpretations of the findings of this study are limited by certain methodologi- cal considerations, which indicate avenues for further research. First, the AEs factors included in the questionnaire must be more accurately defined and the number of items used to assess each of these factors, namely, Quality of education and Social interaction, must be extended. Furthermore, with respect to the factors Personal and social development, Political engagement, Social pressure, and Quality of education, the differences in scores that favour men should be interpreted with caution due to the limitations in discriminant validity (Fornell and Larcker 1981) identified for these factors, particularly the last three.
Longitudinal studies may reveal that men and women have the same pattern of expectations at the beginning of their college education and any changes in these expec- tations during the first year of college. Many authors suggest that students access HE
with excessive or fantasy-based expectations and that these expectations decline as they advance in their academic career (Goldfinch and Hughes 2007). Women may more quickly perceive the challenges and real conditions of their institution and degree and adjust their behaviour accordingly, reducing their initial AEs (Cook and Leckey 1999; Howard 2005). In addition, previous studies show that in the beginning of their HE, women exhibit high expectations with respect to economic benefits, employ- ment, and job prospects. However, during the initial months of their HE, their expec- tations change and they begin to place more value on personal growth and fulfilment (Conde et al. 2014; Shaw 2013).
Another explanation for these differences is the prevalence of men in their first year of college dropping out at the beginning of the academic year (Wells, Seifert, and Saun- ders 2013). Because the data for this study were collected in the sixth month of the aca- demic year, the men who dropped out were likely those who had low AEs, resulting in higher baseline scores of the men who participated in the study. Moreover, the data were collected during class. Because men and women’s attendance rates may differ, men with low AEs and less engagement in school may not be represented in this study. Finally, to avoid problems regarding the internal validity of this study (Shadish, Cook, and Campbell 2001), we performed a test of mean differences across groups after we assessed the APQ’s structural validity (Anderson and Gerbing 1988; Jöreskog and Sörbom 1993; Fornell and Larcker 1981) and verified its strong invariance (Cheung and Rensvold 2002; Meredith 1993). However, these control procedures were not suf- ficient to avoid threats to the external validity of the study’s statistical conclusions (Shadish, Cook, and Campbell 2001). The generalisation of the results is limited because a convenience sample was used in this study. This limitation can be overcome only through a replication process with other non-probabilistic samples or a represen- tative sample.
References
Anderson, J. C., and D. W. Gerbing. 1988. “Structural Equation Modeling in Practice: A Review and Recommended Two Step Approach.” Psychological Bulletin 10 (3): 411–23. Baker, R. W., O. V. McNeil, and B. Siryk. 1985. “Expectations and Reality in Freshman
Adjustment to College.” Journal of Counselling Psychology 32 (1): 94–103.
Bentler, P. M., and D. G. Bonett. 1980. “Significance Tests and Goodness of Fit in the Analysis of Covariance Structures.” Psychological Bulletin 88 (3): 588–606.
Bollen, K. A. 1989. Structural Equations with Latent Variables. New York: Wiley.
Browne, M. W., and R. Cudeck, 1993. “Alternative Ways of Assessing Model Fit.” In Testing
Structural Equation Models, edited by K. A. Bollen, and J. S. Long, 136–62. London:
SAGE.
Conde, Ângeles, Sonia Alfonso, Mar Garcia-Señorán, Manuel Deaño, and Fernando Tellado.
2014. “Expectativas, según sexo, de los estudiantes españoles de primer año de Enseñanza Superior tras sus primeras experiencias [Expectations by Sex of Spanish First-
year Higher Education Students after Their First Experiences].” Paper presented in Manuel Deaño (Coord.), Expectativas académicas en estudiantes de primer año de Enseñanza
Superior. Symposium conducted at the VII Congreso Internacional de Psicología y
Educación and XXI INFAD, Badajoz, Spain, April 9–13.
Cheung, G. W., and R. B. Rensvold. 2002. “Evaluating Goodness-of-fit Indexes for Testing Measurement Invariance.” Structural Equation Modeling 9 (2): 233–55.
Cook, A., and J. Leckey. 1999. “Do Expectations Meet Reality? A Survey of Changes in First- Year Student Opinion.” Journal of Further and Higher Education 23 (2): 157–71.
Deaño, M., A. M. Diniz, L. S. Almeida, S. Alfonso, A. R. Costa, M. García-Señorán, A. Conde, et al. 2015. “Propiedades psicométricas del Cuestionario de Percepciones Académicas para la evaluación de las expectativas de los estudiantes de primer año en Enseñanza Superior [Psychometric Properties of the Academic Perceptions Questionnaire to Assess Higher Education First-year Students’ Expectations].” Anales de Psicología 31 (1): 964–73. Díaz, J. A. 2007. “Las relaciones transfronterizas Galicia-Región Norte de Portugal: Estrategias
para la dinamización del potencial endógeno de la Eurorregión [Cross-Border Relations Between Galicia and Northern Region of Portugal: Strategies to Dynamyze the Endogenous Potential of the Euro-Region].” Revista de Desarrollo Rural y Cooperativismo Agrario 10: 291–308. http://cederul.unizar.es/revista/num10/14%20Diaz.pdf.
Dwyer, R. E., R. Hodson, and L. McCloud. 2013. “Gender, Debt, and Dropping Out of College.” Gender and Society 27 (1): 30–55.
Fornell, C., and D. F. Larcker. 1981. “Evaluating Structural Equation Models with Unobservable Variables and Measurement Error.” Journal of Marketing Research 18 (1): 39–50.
Gibson, D. E., and B. S. Lawrence. 2010. “Women’s and Men’s Career Referents: How Gender Composition and Comparison Level Shape Career Expectations.” Organization Science 21 (6): 1159–75.
Goldfinch, J., and M. Hughes. 2007. “Skills, Learning Styles and Success of First-Year Undergraduates.” Active Learning in Higher Education 8 (3): 259–73.
Goldin, C., L. F. Katz, and I. Kuziemko. 2006. The Homecoming of American College Women:
The Reversal of the College Gender Gap. NBER Working Papers 12139, National Bureau of
Economic Research. http://www.nber.org/papers/w12139.
Goodboy, A. K., and S. A. Myers. 2008. “The Effect of Teacher Confirmation on Student Communication and Learning Outcomes.” Communication Education 57 (2): 153–79. Hayes, K., and J. E. Richardson. 1995. “Gender, Subject and Context as Determinants of
Approaches to Studying in Higher Education.” Studies in Higher Education 20 (2): 215–21. Howard, J. A. 2005. “Why Should We Care about Student Expectations?” In Promoting
Reasonable Expectations: Aligning Student and Institutional Views of the College Experience, edited by T. E. Miller, B. E. Bender, J. H. Schuh, and Associates, 10–33.
San Francisco, CA: Jossey-Bass.
Hu, L., and P. M. Bentler. 1999. “Cutoff Criteria for fit Indexes in Covariance Structure Analysis: Conventional Criteria Versus New Alternatives.” Structural Equation Modeling 6 (1): 1–55.
Hu, S., and G. C. Wolniak. 2013. “College Student Engagement and Early Career Earnings: Differences by Gender, Race/Ethnicity, and Academic Preparation.” Review of Higher
Education 36 (2): 211–33.
Iacobucci, D. 2009. "Everything You Always Wanted to Know About SEM (Structural Equations Modeling) but Were Afraid to ask.” Journal of Consumer Psychology 19 (4): 673–80. Jöreskog, K. G., and D. Sörbom. 1993. LISREL 8: Structural Equation Modeling with the
SIMPLIS Command Language. Chicago, IL: Scientific Software International.
Jöreskog, K. G., and D. Sörbom. 1996. PRELIS 2: User’s Reference Guide. Chicago, IL: Scientific Software International.
Jöreskog, K. G., and D. Sörbom. 2006. LISREL 8.80 for Windows. Chicago, IL: Scientific Software International.
Krumrei-Mancuso, E. J., F. B. Newton, E. Kim, and D. Wilcox. 2013. “Psychosocial Factors Predicting First-Year College Student Success.” Journal of College Student Development 54 (3): 247–66.
Kuh, G. D., T. M. Cruce, R. Shoup, J. Kinzie, and R. M. Gonyea. 2008. “Unmasking the Effects of Student Engagement on First-Year College Grades and Persistence.” Journal of Higher
López, J. D. 2014. “Gender Differences in Self-Efficacy among Latino College Freshmen.”
Hispanic Journal of Behavioral Sciences 36 (1): 95–104.
Mau, W. C., and H. Bikos. 2000. “Educational and Vocational Aspirations of Minority and Female Students: A Longitudinal Study.” Journal of Counseling and Development 78 (2): 186–94.
Mello, Z. R. 2008. “Gender Variation in Developmental Trajectories of Educational and Occupational Expectations and Attainment from Adolescence to Adulthood.”
Developmental Psychology 44 (4): 1069–80.
Meredith, W. 1993. “Measurement Invariance, Factor Analysis and Factorial Invariance.”
Psychometrika 58 (4): 525–43.
Millsap, R. E., and J. Yun-Tein. 2004. “Assessing Factorial Invariance in Ordered-Categorical Measures.” Multivariate Behavioral Research 39 (3): 479–515.
Nunnally, J. C., and I. H. Bernstein. 1994. Psychometric Theory. 3rd ed. New York: McGraw-Hill. Pascarella, E. T., and P. T. Terenzini. 2005. How College Affects Students: A Third Decade of
Research. San Francisco, CA: Jossey-Bass.
Sander, P. 2009. “Current Developments in Measuring Academic Behavioural Confidence.”
Psychology Teaching Review 15 (1): 32–44.
Satorra, A., and P. M. Bentler. 1994. “Corrections to Test Statistics and Standard Errors in Covariance Structure Analysis.” In Latent Variable Analysis, edited by A. von Eye, and C. C. Clogg, 399–419. Thousand Oaks, CA: Sage. Satorra, A., and P. M. Bentler. 2001. “A Scaled Difference Chi-Square Test Statistic for Moment
Structure Analysis.” Psychometrika 66 (4): 507–14.
Sax, L. J., A. N. Bryant, and C. E. Harper. 2005. “The Differential Effects of Student-Faculty Interaction on College Outcomes for Women and Men.” Journal of College Student
Development 46 (6): 642–57.
Sax, L., and C. E. Harper. 2007. “Origins of the Gender gap: Pre-College and College Influences on Differences between men and Women.” Research in Higher Education 48 (6): 669–94. Shadish, W. R., T. D. Cook, and D. T. Campbell. 2001. Experimental and Quasi-Experimental
Designs for Generalized Causal Inference. Boston, MA: Houghton Mifflin.
Shaw, M. A. 2013. “Family Fortunes: Female Students’ Perceptions and Expectations of Higher Education and an Examination of How They, and Their Parents, See the Benefits of University.” Educational Studies 39 (2): 195–207.
Smith, J. S., and E. C. Wertlieb. 2005. “Do First-Year College Students’ Expectations Align with Their First-Year Experiences?” NASPA Journal 42 (2): 153–74.
Soares, A. P., M. A. Guisande, L. S. Almeida, and M. F. Páramo. 2009. “Academic Achievement in First-Year Portuguese College Students: The Role of Academic Preparation and Learning Strategies.” International Journal of Psychology 44 (3): 204–12. Tinto, V.
2010. “From Theory to Action: Exploring the Institutional Conditions for Student Retention.” In Vol. 25 of Higher Education: Handbook of Theory and Research, edited by J. C. Smart, 51–89. New York: Springer.
Vanderberg, R. J., and C. E. Lance. 2000. “A Review and Synthesis of the Measurement Invariance Literature: Suggestions, Practices, and Recommendations for Organizational Research.” Organizational Research Methods 3 (1): 4–70.
Wells, R. S., T. A. Seifert, and D. B. Saunders. 2013. “Gender and Realized Educational Expectations: The Roles of Social Origins and Significant Others.” Research in Higher
Education 54 (6): 599–626.
Whitt, E. J., E. T. Pascarella, B. S. E. Nesheim, B. P. Marth, and C. T. Pierson. 2003. “Differences Between Women and men in Objectively Measured Outcomes, and the Factors That Influence Those Outcomes, in the First Three Years of College.” Journal of
College Student Development 44 (5): 587–610.
Xunta de Galicia. 2014. Análisis de la situación económica, social y ambiental de la zona fron-
teriza de España y Portugal [Analysis of the economic, social, and environmental situation
of the border area of Spain and Portugal]. Accessed http://conselleriadefacenda.es/ documents/10433/2334848/An%C3%A1l+SITUACI%C3%93N+EC+14-20+Frontera +ESP-PORT+%28abr14%29.pdf/3ef55909-687c-4f64-9341-577bb13147d1.
Zeldin, A. L., S. L. Britner, and F. Pajares. 2008. “A Comparative Study of the Self-Efficacy Beliefs of Successful men and Women in Mathematics, Science, and Technology Careers.” Journal of Research in Science Teaching 45 (9): 1036–58.