Modelling the behaviour of the bonding of fibre reinforced concrete at the
plate end
Pedro Neto
1Instituto Politécnico de Setúbal, Escola Superior de Tecnologia do Barreiro e ICIST Rua Stinville 14, 2830-114 Barreiro, Portugal
João Vinagre
2, Jorge Alfaiate
2Universidade Técnica de Lisboa, Instituto Superior Técnico e ICIST Av. Rovisco Pais, 1149-001 Lisboa, Portugal
ABSTRACT
In this paper, the finite element method is used to analyse the behaviour of concrete externally strengthened by fibre reinforced polymers (FRP). This model aims to analyse the stress distribution in the FRP-concrete interface at the plate end of a bending beam. The behaviour of the concrete-epoxy-FRP arrangement is modelled with interface elements with initial zero thickness, using a discrete crack approach. A localized damage model is adopted for the interface and a parametric study is performed to approximate the material parameters adopted. The importance of each parameter is assessed. This model is subsequently verified using experimental data collected from the literature. Finally, a proposal is made concerning the adoption of a relation GFII/GF for the interface behaviour. Mention is also made to some of the main mathematical models found in the literature, which are compared to the present approach.
1. INTRODUCTION
In recent years, the use of composite materials applied to the external strengthening of concrete structures has increased due to their mechanical properties, ease of application and high strength-to-weight ratio. The major problems found with this technique are the local failure modes. Results from experiments reveal that the strength of a glued concrete-FRP (fibre reinforced polymers) bond is determined, in most cases, by the high interfacial stresses. Thus, there is a clear need to study the nature of the bonding as well as developing techniques to permit its design modelling and an accurate quantification of the adherence between the concrete and the reinforcing material.
1
Assistant
2
The stress distribution on pure shear test models does not precisely match the one obtained in bending reinforcement; in the latter, according to various authors, Malek et al.(1998), Rabinovitch et al. (2000) and Täljsten (1994), in addition to the stresses tangential to the interface, normal stresses are also important. The stress concentrations at the FRP end can be the cause of the collapse of the strengthened concrete beam. This type of local failure generally occurs along a portion of concrete attached to the epoxy-fibre layers, the latter remaining intact. In these cases, the evaluation of the energy dissipated per unit of cracked surface involves both the fracture energy of concrete in mode I and II, denoted by GFII and GF, respectively. Several experimental and numerical tests have been carried out to study mixed mode fracture. However, the definition of these material parameters is still not well established and the numerical and experimental results reported have often been contradictory. Bazant et al. (1986) and Ozbolt et al. (1998) proposed for GFII values about 25 times greater than GF. Alfaiate et al. (1998) performed numerical analyses of notched beams subjected to shear and did not detect any significant differences on the value of the failure load when GFII/GF varied from 1 to 100. Such result was confirmed by Gálvez et al. (1998), who carried out a similar study. Täljsten (1994) performed a set of experimental tests for determining both values of GF and GFII. The mode II fracture energy was determined submitting a concrete specimen to both compression and shear. The values determined for GFII were found to be 10 times greater than the value of GF.
In this paper, special attention is paid to the stress concentration at the FRP end. Subsequent to previous shear-stress studies (Neto et al. (2004)), a numerical model is presented which aims to analyse the stress distribution at the FRP-concrete interface of the composite end of a bending beam. The bond between the FRP and the concrete is modelled using a discrete crack approach based on non-linear fracture mechanics (Hillerborg et al. (1976)). Interface elements with zero initial thickness were considered. The shear and peeling stresses developed at these elements are dependent on the relative displacement between the strengthening material and the concrete surface, according to a local constitutive relationship. The material properties that characterize the interface, namely the shear and peeling stiffness, the cohesion, the tensile strength and the fracture energy in modes I and II, are obtained from a parametric study using experimental data from strengthened reinforced concrete bending beams. From the analysis of the results numerically obtained, it is possible to conclude that mode II fracture plays an important role on these tests and a range of values is proposed for GFII. It is expected that this work may contribute to a better comprehension of the stress transfer mechanisms between the concrete and the strengthening material, particularly with respect to the qualitative and quantitative definition of mixed mode fracture of concrete.
2. EXPERIMENTAL TESTING
In this section, the bending tests conducted by Dias et al. (2002) are analyzed. Among the several experimental models tested by Dias et al. (2002), the reinforced concrete beam strengthened with carbon fibre laminates was considered. Figure 1 illustrates the geometry, the internal and external reinforcing schemes and the boundary conditions.
The four point beams had a 0.12×0.18m2 cross section, a total length of 1.95m and a span of 1.80m. The unidirectional carbon fibres were glued, by means of resin epoxy, to reinforced concrete beams with a bond length of 1.74m. One layer of tf=1.4mm thickness were adopted presenting a bf=20mm width.
The MBrace HM laminate FRP system was used. The nominal values for the Young’s modulus and the ultimate tensile strain of the CFRP were 200GPa and 1.1%, respectively. The adhesive’s Young’s modulus was 7GPa. Mean values of 47.7MPa, 4.0MPa and 31.1GPa, for the cylinder compressive strength, tensile strength and Young’s modulus of concrete,
respectively, were obtained experimentally. For the steel, mean values of the yielding stress of 555MPa (φ6) and 533MPa (φ8) were found from the tests.
Figure 1 – Geometry, reinforcing schemes and boundary conditions.
3. NUMERICAL MODELLING
3.1. Constitutive relationships
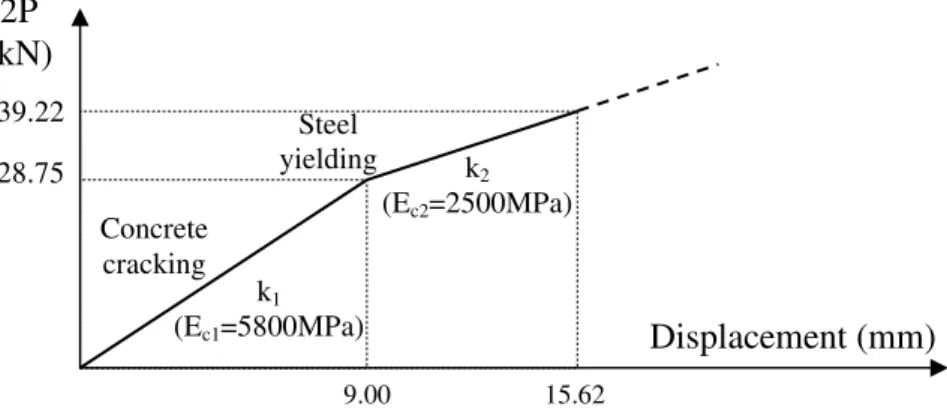
Taking into account the objective of this study, namely the evaluation of shear and peeling stresses at the plate end, a linear elastic and isotropic constitutive relationship was adopted for the reinforced concrete. Thus, to simulate the loss of stiffness of the reinforced element, two different Young modules were adopted for the concrete as shown in Figure 2: i) the first one simulates the cracked concrete and ii) the second one takes into account the internal reinforcement yielding. The determination of these values was based on the experimental results mentioned above (Dias et al. (2002)). The contribution of the CFRP to the beam stiffness was observed to be negligible.
Figure 2 – Structure response and Young’s modulus adopted for concrete. The tensile behaviour of the FRP may be assumed as linear elastic until failure.
The bond between concrete, resin and CFRP was modelled using interface elements of zero initial thickness and a discrete crack approach. A multi-surface plasticity model was adopted (Alfaiate et al. (1998) and Lourenço et al. (1997)); two limit surfaces are considered: a tension cut-off for mode I fracture and a Coulomb friction envelope for mode II failure, as shown in Figure 3. In this figure, the horizontal axis represents the normal stress vector component and the vertical axis represents the tangential stress vector component measured at the interface. The cut-off mode I is defined by the tensile strength of the concrete. This value
k1 (Ec1=5800MPa) k2 (Ec2=2500MPa) 2P (kN) Displacement (mm) 39.22 28.75 9.00 15.62 Concrete cracking Steel yielding 0.02 0.30 0.72 0.03 0.72 0.075 0.075 0.03 P P 2φ8 2φ6 φ6//0.10 φ6//0.10 2φ6 2φ8 0.18 0.12 (m) x
is initially considered equal to 4.0MPa, obtained from pull-off tests (Dias et al. (2002)). The Coulomb friction envelope is initially characterized by the cohesion coefficient and by the internal friction angle φ. Both yield functions follow exponential softening flow rules (Figure 4).
Figure 3 – Yield surfaces adopted for the interface.
The tension mode yield function is given by:
− − = w G f exp f σ f I F t t n n , (1)
where σn is the stress vector component measured in the interface. An associated flow rule is considered. The shear mode yield function reads:
− ⋅ − φ + = s G c exp c tan σ τ f II F n s , (2)
where τ is the tangential stress vector component measured in the interface. A non-associated flow rule is adopted with a plastic potential gs given by:
c tanψ σ τ
gs = + n − , (3) where ψ is the dilantancy angle. An isotropic softening criterion is adopted, meaning that both yield surfaces shrink the same relative amount in the stress space, and both keep the origin (Figure 3).
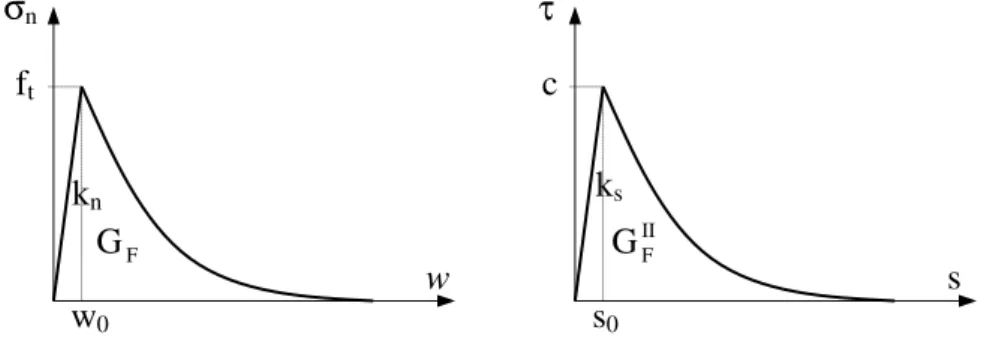
Figure 4 – Normal and tangential constitutive relationships adopted for the interface. tanφ
ft
τ
Initial tension cut-off yield surface
σn
c Final yield surface
Initial Coulomb yield surface σn w F G ft w0 τ s c s0 II F G kn ks
The material parameters characterizing the interface behaviour are: the elastic shear and peeling stiffness, ks and kn, respectively, the cohesion c, the tensile strength ft, and the fracture energies in mode I and II, GF and GFII, respectively (area under the curves σn-w and τ-s adopted as shown in Figure 4).
3.2. Numerical Implementation
The numerical analysis was performed using the finite element method. The elements used for concrete were node and 5-node isoparametric. For the strengthening material, 4--node isoparametric elements were adopted (instead of the linear 24--node element used in previous analyses (Neto et al. (2004)). These elements allow for taking into account the bending stiffness of the composite. The bond between concrete, resin, and CFRP was modelled by linear interface elements. The specimen response was determined under displacement control, using an incremental and iterative procedure, according to the following algorithm:
1. evaluation of the incremental stiffness matrix of the structure K;
2. solving of the system of equations K∆u=∆λF, where ∆u is the incremental displacement vector, ∆λ is the load increment size and F is the nodal force vector;
3. evaluation of the internal forces Fi. The Newton-Raphson and the arc length methods are
used for obtaining convergence towards a solution without unbalanced forces. If equilibrium is not reached within a prescribed tolerance, a new iteration must be performed; otherwise proceed to step 4;
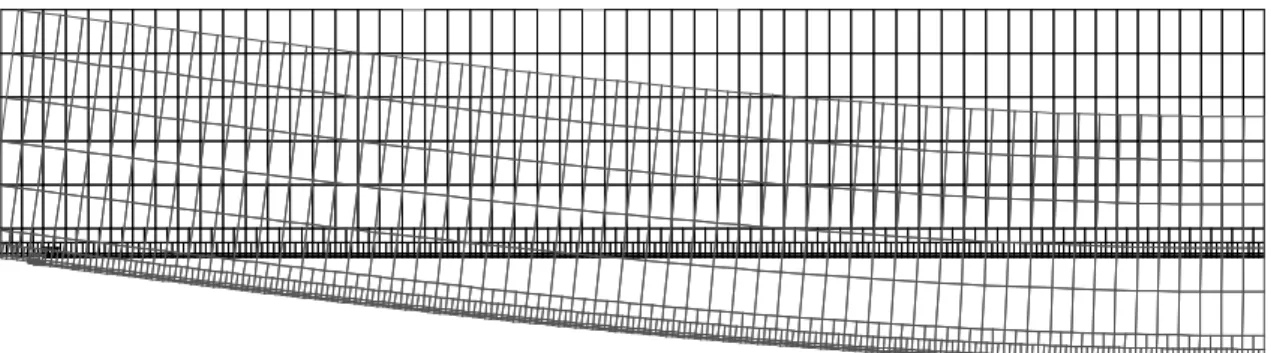
4. update of the total variables, application of another load increment ∆λ and return to step 1. The symmetric two-dimensional finite element mesh adopted is presented in Figure 5, as well as the obtained structure deformation. In the FRP end, a more refined mesh was considered to capture the high stress gradient which is expected in this region.
Figure 5 – Finite element mesh adopted and structure deformation. 3.3. Numerical analysis
As mentioned above, the constitutive relationship of the interface concrete-CFRP is defined by six parameters: the shear and peeling stiffness, the cohesion, the tensile strength and the fracture energy in mode I and II. In the present analysis only debonding failure was acknowledged. In agreement with Malek et al. (1998), the stiffness of the interface depends on the adhesive properties according to:
a a n E t k = (4) and
(
)
(
a)
a s E 21 υ t k = + , (5)where υ is the Poisson coefficient, Ea is the Young’s modulus for adhesive and ta is the thickness of the adhesive. According to experimental and fabricant data, the values adopted for the calculation of the interface stiffness were: Ea=7000MPa, υ=0.3 and ta=1.75mm, the latter value lying between 1.5mm and 2.0mm. Thus, according to eqs. (4) and (5),we obtain kn=4000MPa/mm and ks=1500MPa/mm.
The value of the cohesion was defined taking into account the dependence, mentioned in several works as seen in Neto (2003), between this value and the mean value of the concrete tensile strength. A cohesion value c=7MPa was adopted. The value of ft corresponds to the tests results by Dias et al. (2002).
For the mode II fracture energy, a value GFII=1.5N/mm was defined; this value was predicted taking in to account that the concrete used in this study presents higher mechanical characteristics than the one considered in Neto et al. (2004). Assuming a relation GFII/GF=10 (Täljsten (1994)), we obtain GF=0.15 N/mm.
Next, a numerical study of the behaviour of the beam strengthened with CFRP was performed. The distribution of stresses obtained with the finite element method is represented in Figures 6 to 10. It is possible to notice that shear stress distribution is similar to the one obtained in a pure shear model (Neto et al. (2004)). In the extremity of the CFRP, normal stresses appear. These stresses are tensile stresses along a small length, becoming compressive stress afterwards, almost vanishing along a length of approximately 10mm. This result is confirmed by Rabinovich et al. (2000), who claims that this distance corresponds to 3-4 times the adhesive thickness. High interfacial stresses can be observed in this region (Figures 9 and 10). Along the beam span there are also interfacial stresses (shear stresses), as shown in the Figures 6 to 8, presenting elastic values, caused by the beam deformation.
The maxim value of P was 43.3kN, corresponding to a much larger value than the one experimentally observed. As a consequence, it can be concluded that this local failure mode is not important here. This result seems to be in accordance with the result experimentally observed. The observed behaviour in an experimental model, which only differs from the numerical model in the introduction of exterior fixation mechanisms in the extremity of the laminate, was quite similar to the presented one.
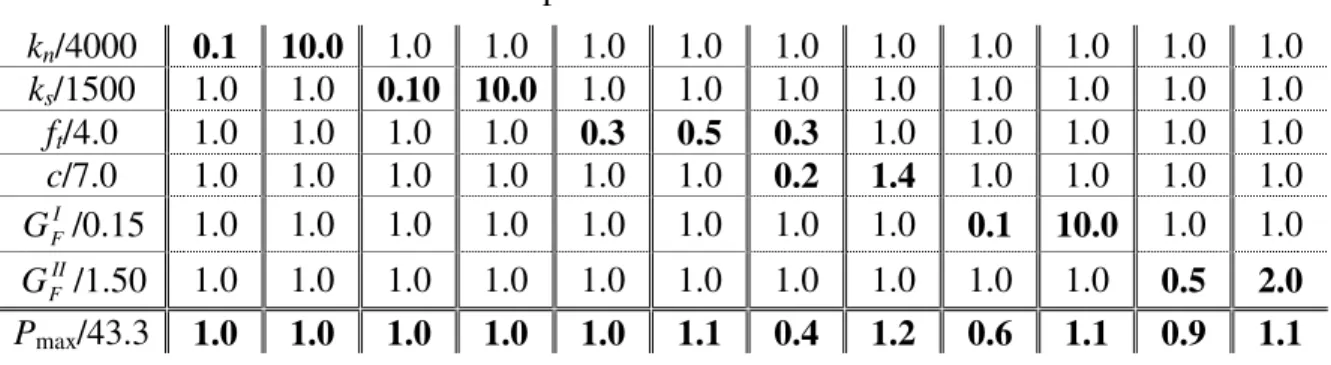
In order to analyse the importance of each material parameter which influences the bond behaviour, a parametric study was performed; the corresponding results are presented in Table 1. From Table 1 it can be concluded that the cohesion is the material parameter which presents a more pronounced influence on the resistance of the connection. Interestingly, in Neto et al. (2004) it was found that the most important parameter influencing the strength of the connection was the fracture energy. In comparison to a pure shear model, the shear stresses are distributed along a bigger length, as shown in Figures 6 to 10, due to the bending deformation. The stresses along the span region are elastic. Within the elastic limit, the cohesion is the parameter which contributes most to the noticed variations of the maximum load (Figure 10b)).The peeling stresses are present in a much reduced length compared to the shear stresses, the fracture energy playing a more important role than ft.
Table 1 – Influence of the material parameters in the value of the beam maximum load.
kn/4000 0.1 10.0 1.0 1.0 1.0 1.0 1.0 1.0 1.0 1.0 1.0 1.0 ks/1500 1.0 1.0 0.10 10.0 1.0 1.0 1.0 1.0 1.0 1.0 1.0 1.0 ft/4.0 1.0 1.0 1.0 1.0 0.3 0.5 0.3 1.0 1.0 1.0 1.0 1.0 c/7.0 1.0 1.0 1.0 1.0 1.0 1.0 0.2 1.4 1.0 1.0 1.0 1.0 I F G /0.15 1.0 1.0 1.0 1.0 1.0 1.0 1.0 1.0 0.1 10.0 1.0 1.0 II F G /1.50 1.0 1.0 1.0 1.0 1.0 1.0 1.0 1.0 1.0 1.0 0.5 2.0 Pmax/43.3 1.0 1.0 1.0 1.0 1.0 1.1 0.4 1.2 0.6 1.1 0.9 1.1
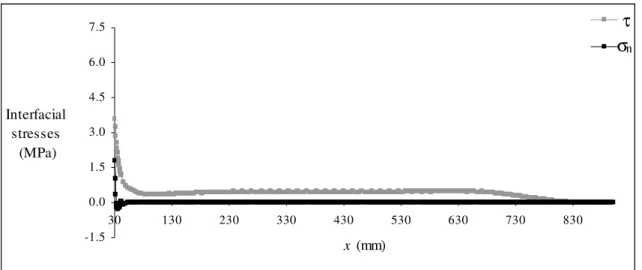
σn -1.5 0.0 1.5 3.0 4.5 6.0 7.5 30 130 230 330 430 530 630 730 830 x (mm) Interfacial stresses (MPa) τ
Figure 6 – Interfacial stresses along the beam with Pmax=13.0kN (tf=1.4mm).
σn -1.5 0.0 1.5 3.0 4.5 6.0 7.5 30 130 230 330 430 530 630 730 830 x (mm) Interfacial stresses (MPa) τ
Figure 7 – Interfacial stresses along the beam with Pmax=27.7kN (tf=1.4mm).
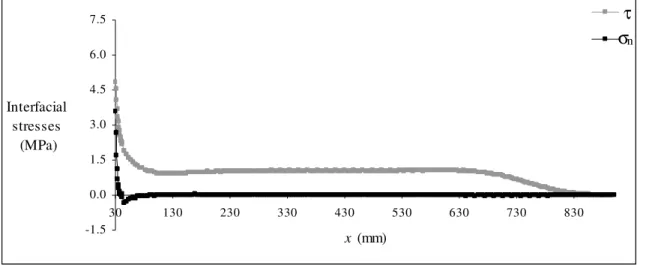
σn -1.5 -0.5 0.5 1.5 2.5 3.5 4.5 5.5 6.5 7.5 30 130 230 330 430 530 630 730 830 x (mm) Interfacial stresses (MPa) τ Figure 8 – Interfacial stresses along the beam with Pmax=41.9kN (tf=1.4mm).
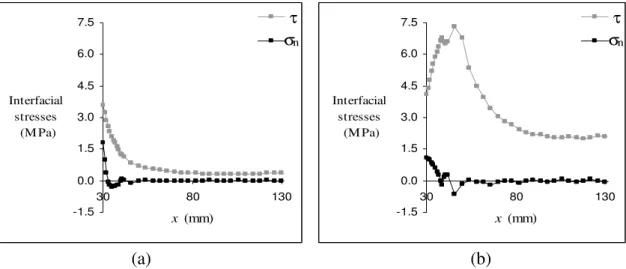
σn -1.5 0.0 1.5 3.0 4.5 6.0 7.5 30 80 130 x (mm) Interfacial stresses (M Pa) τ σn -1.5 0.0 1.5 3.0 4.5 6.0 7.5 30 80 130 x (mm) Interfacial stresses (M Pa) τ (a) (b)
Figure 9 – Detail of the interfacial stresses (tf=1.4mm): (a) Pmax=7.2kN, (b) Pmax=27.7kN.
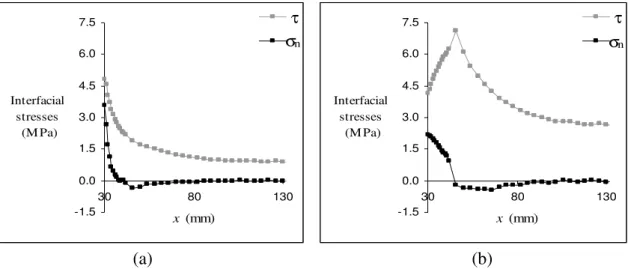
σn -1.5 -0.5 0.5 1.5 2.5 3.5 4.5 5.5 6.5 7.5 30 80 130 x (mm) Interfacial stresses (M Pa) τ -1.5 0.0 1.5 3.0 4.5 6.0 7.5 30 80 130 x (mm) Interfacial stresses (M Pa) τ Elast ic Non Elast ic (a) (b)
Figure 10 – (a) Detail of the interfacial stresses (tf=1.4mm): Pmax=41.9kN, (b) Distinction between elastic and non elastic phase.
Note that one of the cases corresponded to considerer c=1.5MPa and ft=1.0MPa, since ft>c would be physically unacceptable. In this case the rupture occurred for Pmax=18.4kN, around 40% of the value of the maximum load obtained for the initially defined parameters. This reduction is due to a shrinkage of the surface limit (Figure 3) since ft and c decreased simultaneously. This value of Pmax is approximately equal to the experimental value. Thus, the methodology presented by Malek et al. (1998) for the evaluation of the maximum interfacial stresses was applied with c=1.5MPa and ft=1.0MPa. The stress values obtained at x=30mm were: τmax=1.5MPa and σn,max=0.8MPa. This author considers complete composite action between plate and concrete. The distribution of stresses along the span corresponds to the limit of the elastic phase. The elastic fraction of the load is approximately 16% of the maximum load value, which shows that the resistance of the connection is poorly mobilized.
The small stress concentration found in the laminate end of the beam may be due to the fact that the composite thickness is small enough to mobilize peeling stresses leading to failure.
With the objective of evaluating the importance of the thickness of the reinforcement a similar analysis is next described, considering now tf=6mm. This value of the thickness was chosen based on Malek’s et al. (1998) work. The numerical distribution of stresses is shown in Figures 11 to 15. Peeling stresses are present at the plate end, together with shear stress
concentrations (Figures 14 and 15). Along the span, elastic shear stresses at the interface are also present due to the beam deformation. From Figures 11 to 15 can be observed that peeling stresses plays a more important role than the one considering tf =1.4mm.
σn -1.5 0.0 1.5 3.0 4.5 6.0 7.5 30 130 230 330 430 530 630 730 830 x (mm) Interfacial stresses (MPa) τ
Figure 11 – Interfacial stresses along the beam with Pmax=5.7kN (tf=6.0mm).
σn -1.5 0.0 1.5 3.0 4.5 6.0 7.5 30 130 230 330 430 530 630 730 830 x (mm) Interfacial stresses (MPa) τ
Figure 12 – Interfacial stresses along the beam with Pmax=15.5N (tf=6.0mm).
σn -1.5 -0.5 0.5 1.5 2.5 3.5 4.5 5.5 6.5 7.5 30 130 230 330 430 530 630 730 830 x (mm) Interfacial stresses (MPa) τ Figure 13 – Interfacial stresses along the beam with Pmax=22.0kN (tf=6.0mm).
σn -1.5 0.0 1.5 3.0 4.5 6.0 7.5 30 80 130 x (mm) Interfacial stresses (M Pa) τ σn -1.5 0.0 1.5 3.0 4.5 6.0 7.5 30 80 130 x (mm) Interfacial stresses (M Pa) τ (a) (b)
Figure 14 – Detail of the interfacial stresses (tf=6.0mm): (a) Pmax=5.7kN, (b) Pmax=15.5kN.
σn -1.5 -0.5 0.5 1.5 2.5 3.5 4.5 5.5 6.5 7.5 30 80 130 x (mm) Interfacial stresses (M Pa) τ
Figure 15 – Detail of the interfacial stresses (tf=6.0mm): Pmax=22.0kN.
The maximum load was now equal to 23.0kN, circa 53% of the previous value (43.3kN). Thus, in spite of the greater reinforcement area, the strength of the beam has decreased due to the increase of the thickness of the laminate, giving rise to higher peeling stresses. In the Figure 16 a detail of the finite element mesh in the FRP end is presented, showing the laminate detachment.
Figure 16 – Detail of the detachment in the CFRP end.
In order to better understand the influence of the reinforcement dimensions, the CFRP width was increased to bf=85.7mm taking tf=1.4mm, thus keeping the same reinforcement area as before (tf=6mm, bf=20mm). The maximum load obtained was now Pmax=62kN, more than 2.5 times the load capacity obtained with tf=6mm. This value was also higher than the
one obtained with tf=1.4mm and bf=20mm. From these results it can be concluded that, whenever possible, it is preferable to increase the width instead of the thickness of the CFRP. Moreover, more layers are more difficult to execute.
From the parametric study performed, the results obtained with tf=6mm and bf=20mm were similar to the ones presented in Table 1. Note that the maximum value P=23kN, although still higher than the experimental maximum value, is closer to this one; nevertheless, the reinforcement areas are distinct.
4. CONCLUSIONS
The research focused on the computational modelling, based on non-linear fracture mechanics, of the stress distribution in the FRP-concrete interface at the plate end of a bending beam.
The material properties used in the characterization of the interface behaviour, were: the shear and peeling stiffness, the cohesion, the tensile strength and the fracture energy in modes I and II.
The shear stress distribution was observed to be similar to the one obtained in a pure shear model. In the CFRP end, normal stresses to the interface appear. These stresses are first tensile in a small length, changing into compressive stresses and almost vanishing in a length of approximately 10mm. High interfacial stresses can be observed in this region.
The maximum value of P was much larger than the experimentally observed, which can be concluded that this is a non important local failure mode in this case.
The cohesion is the material parameter which influences most the resistance of the connection. The fracture energy assumes a less important role than the one observed in the pure shear models. In mode I, the fracture energy plays a more important role than ft. From this study a ratio of GFII/GF between 10 and15 seems adequate.
The simultaneous variation of ft and c shows a bigger influence in the variation of the maximum load.
According to the methodology presented by Malek et al. (1998) for the calculation of the maximum interfacial stresses, these occur for the limit elastic value of the load, approximately 16% of the maximum value. As a consequence, it can be concluded that the resistance of the connection is poorly mobilized.
The stress concentration noticed in the laminate end of the beam is found to play a non important role in the global behaviour of he beam; in fact, the composite thickness is less than adequate to mobilize peeling stresses capable leading to failure.
Admitting the possibility of mode II fracture taking place, according to the methodology presented in Neto (2003) based on the rectangular simplified diagram method, the obtained maximum load was 81% of the theoretical value. In accordance with the above mentioned work, the theoretical value of the maximum load is, in general, smaller than the real value. Thus, it is possible to conclude that mode II fracture is important in beams reinforced with FRP, because, in general, the thickness considered is small. Applying this model (Neto (2003)) to the beam without external reinforcement, it is found that the maximum theoretical and experimental loads perfectly match.
The methodologies presents in the FIB report 14 (FIB (2001)) only consider the mode II of fracture, which is adapted to the general cases with FRP reinforcement, taking into account the small thickness adopted.
The maximum load with tf=6mm was around 53% of the value referring to tf =1.4mm due to the increase of the peeling stresses.
The importance of the stress concentration in the failure of the bending beam was observed for high thickness of the reinforcement, and this is why mechanisms of anchorage are adopted when metal plates are used.
Finally, it was also possible to conclude that, whenever possible, it is preferable to increase the width instead of the thickness of the CFRP. This option also leads to a less amount of material, consequently, less cost. Moreover, more layers are more difficult to execute.
5. REFERENCES
Alfaiate, J. and Pires, E.B., Mode I and mixed mode non-prescribed discrete crack propagation in concrete, in: Proceedings of FRAMCOS-3, Eds. by H. Mihashi and K. Rokugo, Japan, 2, 739-748 (1998).
Alfaiate, J., Almeida, J. R., Crack Evolution in Confined Masonry Walls, , in:
Proceedings Computational Mechanics: New Trends and Applications, Eds. By S.R. Idelshon, E. Oñate and E. Dvorkin, CIMNE, Barcelona, (1998)
Bazant, Z.P. and Pfeiffer, P.A., Shear fracture tests of concrete, Materials and
Structures, 19, 111-121 (1986).
Dias, S., Juvandes, L. and Figueiras, J., Comportamento experimental de vigas de
betão armado reforçadas à flexão com sistemas compósitos de CFRP do tipo Mbrace, relatório técnico, LABEST, Faculdade e Engenharia da Universidade do Porto (2002).
FIB (CEB-FIP), Technical report on the design and use of externally bonded fibre
reinforced polymer reinforcement (FRP EBR) for reinforced concrete structures - externally bonded FRP reinforcement for RC structures. Fedération International du Béton, Bulletin 14, (2001).
Gálvez, J.C., Cendón, D.A., Planas J., Guinea, G.V. and Elices, M., Fracture of concrete under mixed loading - experimental results and numerical prediction, in:
Proceedings of FRAMCOS-3, Eds. by H. Mihashi and K. Rokugo, Japan, 2, 729-738 (1998). Hillerborg, A., Modeer M. and Petersson P.E., Analysis of crack formation and crack growth in concrete by means of fracture mechanics and finite elements, Cement and Concrete
Research, 6, 773-782 (1976).
Lourenço, P.B. and Rots, J.G., A multi-surface interface model for the analysis of masonry structures, ASCE Journal of Engineering Mechanics, 123(7), 660-668 (1997).
Malek, A. M., Saadatmanesh, H. and Mohammad, R. E., Prediction of failure load of rc beams strengthened with FRP plate due to stress concentration at the plate end, ACI
Structural Journal, 95(2), 142-152 (1998).
Neto, P., Alfaiate, J., Almeida, J.R., Pires, E.B., The influence of mode II fracture on concrete strengthened with CFRP, Computers & Structures, 82(17-19), 1495-1502, (2004).
Neto, P., Estudo numérico da ligação betão-CFRP. MSc. Thesis (in press), Instituto Superior Técnico, Universidade Técnica de Lisboa (2003).
Ozbolt, J., Reinhardt, H.W. and Xu, S., Numerical studies of the double-edge notched mode II geometry, in: Proceedings of FRAMCOS-3, Eds. by H. Mihashi and K. Rokugo, 2, 773-782, Japan, (1998).
Rabinovitch, O. and Frostig, Y., Closed-form high-order analysis of rc beams strengthened with FRP strips, ASCE Journal of Composites for Construction, 4(2), 65-74 (2000).
Täljsten, B., Plate bonding – strengthening of existing concrete structures with epoxy
bonded plates of steel or fibre reinforced plastics, Doctoral Thesis, Division of Structural Engineering, Lulea University of Technology (1994).