Maria Constança Meireles Corte-Real Neves 3253
A Work Project, presented as part of the requirements for the Award of a Masters Double Degree in Finance and Management from the Faculdade de Economia da Universidade Nova
de Lisboa.
The impact of the addition to Euronext Vigeo Europe 120
index on the stock performance of European companies
A Project carried out on the finance course, with the supervision of: Irem Demirci (NOVA SBE) and Anh Nguyen (LSM)
I CONTENTS Introduction ... 1 Literature Review ... 4 Methodology ... 12 Results ... 20
Conclusion & Limitations ... 29
II
Abstract
In recent decades, the increasing amount of companies’ CSR efforts led to a growing concern on how social actions affect stock prices. Different studies have produced contradictory results and no universal relationship could be drawn.
This thesis responds to the increasing interest on the relationship between corporate social responsibility and firm’s value. It will do so by analyzing whether the inclusion and exclusion on Euronext Vigeo Europe 120 has a significant impact on European stock prices on the short-term or medium-short-term, whether it depends on the geographical position (Western vs Central Eastern Europe) or industry group (highly pressured vs low pressured sectors).
An event study is conducted and the average abnormal returns of 166 unique stocks is analyzed for the period of 2013 to 2017. Results show a short-term positive and negative impact for index inclusion and exclusion; with no medium-term effect detected for either event. Central European countries are the most negatively affected by index composition. The highly-pressured sector is the most positively affected for inclusion, with no sector differentiation for exclusion.
The work project presents a few limitations such as a small sample size and the assumption of high visibility of the index. As future and complementary approach, it would be of interest to analyze other Euronext Vigeo Indices and compare the results as well as to understand the visibility the index has on the market.
1
Introduction
Corporate Social Responsibility is a concept with many definitions, views and applications. In a broad sense, it is a business approach that contributes to sustainable development. It achieves that by delivering economic, social and environmental benefits to all stakeholders. The European Union states that CSR has to be seen as a behavior of the business that goes beyond the legal requirements (European Commission, 2011). Moreover, companies have their own values, own ideologies on social responsibility and, also, what it means for them to act in a socially responsible manner while creating value for themselves. The European Commission believes that CSR is important for competitiveness, sustainability and innovation of the EU companies and economy. They strongly encourage enterprises to adhere to international guidelines and principles related to CSR. There is, in fact, a European CSR awards and the European business network for CSR, all to promote CSR practices and collaboration across Europe. The EU believes CSR initiatives will bring benefits to the companies, in cost saving, risk management, access to capital, customer relationships and human resource management. According to the World Bank (Mazurkiewicz, 2008), CSR is a company’s obligation to be accountable to all of its stakeholders in its operations and activities They believe that socially responsible companies must consider their impact on communities and environment in the moment of making decisions, while balancing profits with the needs of stakeholders.
There are several theories explaining CSR, but the Stakeholder Theory is the most commonly accepted. It has become a corner stone in both CSR thinking and business ethics. The theory postulates that CSR is pursued in order to understand and satisfy stakeholders (any group or individual who can be affected or is affected by the achievement of the organization’s objectives (Freeman, 1984)) and could be a way to develop a successful business. For a long time, the only goal of a company was to be profitable and create value for its shareholders (Friedman, 1970). Nowadays, more and more this idea is changing. Companies are increasingly affected by stakeholder relations that cover a wide range of interests. In this sense, CSR appears as a way to fulfil the gaps as it becomes clear that without satisfying their stakeholders, companies cannot satisfy their shareholders. A company must clarify its most important stakeholder relationships and systematically evaluate how its objectives and plans affect them. In fact, efforts to integrate CSR practices in their business models have been increasing greatly because many companies take as their responsibility to build a better environment to the overall stakeholders (e.g. reducing C02 contributions, recycling materials, improve working
2
conditions, improving communities in poor countries, among others). However, CSR means different things to different companies, but generally each CSR program will fall under one of the following categories: Environment, Economic, Human Rights and Philanthropic work (Scott Krohn, 2018). Environment category relates to a business implementation of non-wasteful actions; economic category deals with fiscal responsibility (ethical and transparent bookkeeping) and procedures to minimize wasted capital; human rights category relates to human rights; philanthropic works may involve a company’s investment or funding of communities.
Companies have established comprehensive CSR programs to fight against serious issues in the world, both on a global and local level. These seemingly altruistic plans do not only help improve the world, but also may increase a company’s value. Since the 1960s, the relationship between CSR and company’s financial performance has been under some serious debates. Many studies have appeared as a consequence in the pursuit to draw conclusions on the topic. Some studies on the issue prove that announcements on CSR practices have a positive effect on stock performance (e.g. Chollet and Cellier, 2011), a negative effect (e.g. Mackey et al., 2007) or no effect at all (e.g. Zaccheaus et al., 2014). The mix results considering different stock markets make conclusions on the subject difficult.
It is clear that consumers value and trust companies who are involve in CSR initiatives. Following that reasoning, a question emerges: does the same happen with investors? Do investors care about social responsible practices and reward companies for that or do they view them as a waste of resources? In this thesis, I contribute to the literature by analyzing the impact that Euronext Vigeo Europe 120 Index composition announcement has on the stock performance of publicly traded European companies, both in short and medium term, also, whether it depends on the geographical location or industry group. The analysis of the inclusion effect offers a good opportunity to understand the possible impact of CSR ratings on financial markets. To my knowledge, none of the previous studies have taken this approach. The insights from this thesis could be useful for both investors and managers in their decision-making. The index effect can be considered as the phenomenon of abnormal returns and/or abnormal trading volumes that stocks may experience when they are included or excluded from a particular index. This topic inclusion effect has been widely studied in the literature but most on US market (in the context of S&P 500). There seems to be a strong empirical evidence on the short-term positive price effects of index inclusion (e.g. Cheung, 2011). However, the long-term effects are unclear. The theories presented to explain the phenomenon are related to factors
3
such as increase of exposure, attention and demand shocks, additionally, some effects are also considered such as liquidity and information effect (Chakrabarti et al., 2005). In recent years, several indices have emerged to rank and list companies according to environmental, social and government criteria. The objective of this approach is to identify and compensate sustainable companies. Indices such as Vigeo Eiris, Dow Jones and Financial Times provide reliable benchmarks of sustainable companies to investors. In fact, information on the announcements of corporate initiatives related to CSR are gathered by company’s such as Vigeo. Their indices are composed of the highest-ranking listed companies as evaluated by the agency in terms of their performance in corporate responsibility (Vigeo Eiris website). They consider at European level the top 120 most advanced companies. The composition of the index is done on a semi-annual basis. Moreover, they have indices at global level, European level, Eurozone, emerging markets, United States, France, UK and Benelux. This thesis only will focus on the European level. It is interesting to analyze the index inclusion effect of a CSR index particularly because there is little extensive literature about it and no literature mentioning the specific Vigeo index. Many researchers have questioned the effects of CSR on a company’s financial performance as it becomes a central theme for companies, managers and investors. It is of relevance to get an estimate of the financial effects of CSR, as this is likely to have an impact on companies’ future CSR efforts. Those are undeniably essential in the world, since they help improve and tackle innumerous problems. If it is possible to prove that CSR practices have a positive effect on a company’s s stock performance on top of helping the world be a better place, perhaps this would mean that more companies would expand their CSR investments in a more meaningful way, beyond the required levels. If the contrary proves to be true, such that if the results are negative or no effect is observed, then companies can financially benefit from ceasing their CSR initiatives or at least not report them. Hence, the relevance of this topic cannot be undermined.
Section 2 summarizes the main results of different studies on the topic, Section 3 presents the hypotheses to be tested. Section 4 discusses the methodology and reports the findings. Finally, Section 5 presents the conclusion and limitations of this study.
4
Literature Review
In recent years, CSR initiatives have gained importance in corporations and, so, discussions about their effects have emerged. Some authors claim that CSR programs have a positive impact on the value of the company, while others claim that it has a negative or no impact at all. The uncertainty behind this topic has incentivized many researchers to further understand the relationship. Their researches differ as they take different approaches to solve the problem (e.g. multiple regression, event study, etc.), they consider different databases, different markets and different time periods, which makes any comparison difficult. Most studies conducted on the issue are specially focused on the US market, and even in the same market the findings vary. Furthermore, some studies look at a specific industry or a specific country. Other studies consider CSR rating as a whole or by its dimensions. A few even consider the effect of inclusion in CSR related index.
At this part of the document, I will present the key findings of the studies conducted on the subject and try to solidify my reasoning for the next steps. The literature is divided taking into consideration the final conclusions regarding the relationship between CSR and financial performance, whether it is positive, negative or non-existent. Before starting the analysis, one aspect worth mentioning is the disclosure decision, which is the decision companies take to reveal their CSR information. Understanding the decision and the motivations behind is pertinent. Belkaoui and Karpik (1989) computed a regression model and concluded that the relevant explanatory variables are social performance and political visibility when a company decides to make public their social information. Moreover, Margolis and Walsh (2003) found that the higher the quality of CSR Report disclosed, the more significant is the market effect. Disclosure makes the company’s CSR policies public to investors and to index analysts. Index analysts gather that information and use their own criteria to rank companies, to posteriorly include the best ones into an index. Moreover, reputation seems to be an important factor, Brammer and Pavelin (2006) analyzed how reputation is determined by social and financial performance. Conclusions show that the fit of the social activities with the company´s image is crucial. For instance, a good record of social initiatives may improve or destroy a reputation depending on the how those actions fit with the company’s business.
Findings supporting a positive relationship
A good example of research on the topic is the one conducted by Chollet and Cellier (2011). In their analysis, they study the influence of Vigeo rating announcements on short term European stock returns (2004-2009). Their research concludes that there is a positive effect over the 2
5
days around the announcement and that the market reacts differently depending on the CSR field. Länsilahti, (2012) conducted an event study on European stock returns affected by negative ESG-news (1998-2007). Research shows a negative market reaction in the short-run and positive market reaction in the long-run. This implies that investors overreact to the news and that the short-term reaction is intensified over the years.
There is extensive literature on U.S market regarding the relationship. For instance, Waddock and Graves (1997) suggest that better social performance leads to better financial performance and vice-versa, though the effect is relatively small. Another study by Flammer (2013) concerning the environmental awareness of shareholders concludes also positive results. The research led to the conclusion that on US companies (1980-2009) reporting responsible environmental actions have a significant stock price increase while companies who behave irresponsible experience a significant price decrease. Moreover, Giannarakis et al. (2016) investigates whether CSR impacts financial performance of the S&P 500 companies. The investigation is done in terms of involvement in socially responsible initiatives using the Environmental, Social and Governance (ESG) disclosure scores. The findings suggest that the involvement in socially responsible initiatives has a significantly positive effect on financial performance. Pintekova (2017) concluded the same when analyzing the relationship in the post-financial crisis. The research goes further, determining that primary responsible activities (the ones related to the core business of the company) have a positive effect, while the secondary responsible activities do not affect substantially the financial results. Additionally, Arx and Ziegler (2008) compared companies’ environmental and social actions on their financial performance in two different regions, US and Europe. The analysis showed positive results for both, being more robust for the US. Velde et al. (2005) study whether integrating sustainable dimensions in the investment policy carries a cost for investors. After estimating the model, it is clear that high sustainability rated portfolios perform better than low-rated portfolios on the short-term, with no apparent cost involved for conscious investing. Additionally, Kempf and Osthoff (2007) tested the effect of social responsible investment (SRI) on portfolio performance of US stocks using KLD ratings and concluded that social responsible investors can keep their trading strategy (investing in companies highly involved in CSR) without hurting their financial performance. Data shows that social responsible portfolios are never significantly negative.
Findings supporting a negative relationship
Zeiner and Johansen (2014) performed a study on American corporations and concluded that CSR announcements have a negative impact on returns. They, also, concluded that CSR
6
announcements might represent an anomaly to market efficiency. A similar study by Zhang (2017) on S&P 500 stocks (2000-2014) reached the conclusion that CSR aggregated rating score has a negative impact on the stock performance and on the development of the company. Another researcher, Valerie (2014), analyzed the effect of both CSR and CSI (corporate social irresponsibility) on U.S. stock returns on the short and long-run. CSI refers to a company´s inability to act in a responsible manner, it is the opposite of CSR. The results show a negative impact on both CSR and CSI, nonetheless, being the CSR announcements impact weaker on market returns. Mackey et al. (2007) tested whether socially responsible activities will have an impact (positive or negative) or no impact on a company´s market value. The study concluded that companies that change their policies by being socially responsible or irresponsible will see a decrease in their market value. It might be due to the fact that these actions will create excess supply in the market.
Findings supporting a neutral or no existent relationship
Moreover, there are studies that concluded no relationship between CSR and stock returns. Whelpley (2017) examined the effects of releasing annual CSR reports on stock prices and on trading volume. The study was conducted on two different sample groups (based on their market capitalization value) each with 20 companies from the S&P 500. The final results led to the conclusion that there is no significant relationship between releasing CSR reports and stock returns in either group. However, further analysis shows a significant response in trading volume for the group with higher market capitalization. There is evidence that the investors care about and act upon CSR information and it might depend on the information environment. Martins (2015) conducted a study on the pharmaceutical industry in Europe. The study showed no significant impact on the financial performance of a company either on the short or long term. Additionally, the study concluded that financial performance varies differently depending on the industry. Singh (2014) focus his study on the impact that CSR disclosure has on the financial performance of United Kingdom companies. The focus was specifically on three industries (industry of crude petroleum and natural gas extraction; mining of metal ores and on pharmaceutical products) and conclusions proved no significant CSR impact in both short and long-term. Cochran and Wood (1984) proposes a new methodology and the creation of industry-specific control groups in order to understand the relationship. In the end, they concluded that there is a weak correlation between CSR and financial performance.
It has become increasingly popular for Swedish companies to invest in CSR to gain competitive advantage, because of that many researches have been testing whether those initiatives increase
7
a firm´s financial performance. For example, Hagberg et al. (2015) tested whether there was a positive relationship between CSR and stock returns in the Swedish market, and whether industry or firm size were relevant factors. In the end, no significant relationship could be observed. Also, Ahlén and Ahlén´s (2012) performed a similar study, using stocks ranked by Folksam Index of Corporate Social Responsibility. In fact, Folksam, is one of Sweden’s largest investment and insurance companies, their report assesses the CSR engagement within environmental and human rights, for all companies on OMX Stockholm stock exchange. In this study companies with the highest CSR ranking, companies with the lowest ranking and companies with no ranking were selected to be a part of the study. Furthermore, the same method is applied to industry classifications to evaluate how the impact differs across industries. The results conclude that, overall, low ranking has a negative impact on a company’s share price and a high ranking has no impact. The effect, nevertheless, varies across industries, in specific, in real estate, health care and capital goods. Moreover, Bråtenius and Melin (2015) and Radgren and Akerling (2015) had similar studies and conclusions. Final results show that the number of companies not engaging in CSR at all has decreased. It can be inferred that even though high ranked firms in CSR are not rewarded, companies are still punished for poor CSR performance. Additionally, results might imply that a firm with a lower ranking can create value for its shareholders by improving its CSR reporting systems. Companies with an efficient CSR reporting seem to gain more from the release of the index than firms with an inadequate reporting. This indicates that investors value companies with well-developed CSR policies.
Index Inclusion effect
Furthermore, a relevant and related aspect not much analyzed in the literature is the index inclusion effect on CSR related indices. More than ever companies want to be seen as socially and environmentally responsible but the credibility of those actions is sometimes questioned, being a part of a social responsible index is a way to overcome the distrust. Sustainability indices serve as informational intermediaries. They analyze the companies’ information reports and categorize them according to the previously set criterion. These intermediaries are seen as objective neutral professional institutions (Dubbink et al., 2008). Nevertheless, little research has been conducted on the topic, the overall conclusions on index inclusion suggest that there is a temporary positive index effect for the inclusion and a negative temporary effect for the exclusion, with no permanent effect detected. The index inclusion effect depends on the index considered and some studies mention cross-country differences.
8
The Dow Jones Sustainability Indices (DJSI) identifies the leading sustainability-driven firms worldwide and their financial performance. The next three studies have been conducted on the topic, two are on the US market and present similar results, the last one is on the European market. Cheung (2011) in his study analyzes the effect of index inclusion and exclusion on corporate sustainable companies, by examining the performance of US stocks added and eliminated from the DJSI. Conclusions show that there is a temporary increase in stock return for included stocks and a temporary decrease for excluded ones. Robinson et al. (2011) study examines the same impact on US companies. In fact, results show similar conclusions. Inclusion increases the stock price while exclusion leads to a temporary decrease for the first 10 days after the announcement, then the effect is eliminated, hence, being excluded from the index does not lead to a huge loss. Lopez et al. (2007) tries to understand the same problematic by comparing the results of companies in the DJSI with companies in the DJ Global Index but taking into account only companies that develop their business in Europe. Results show that there is a negative short-term effect on sustainability practices.
Regarding European market indices, Blomstrand and Säfstrand (2010) studied the index effect on the EURO STOXX 50 and on the OMXS30. Results state that there are positive abnormal returns and abnormal trading volumes in the short term for both. Additionally, Kaptein (2016) studies the effect of index inclusions in the Dutch market proving also a positive effect. Even on emerging markets, the effects are positive as Hacibedel and Bommel (2007) concluded. They attributed the reason for that impact to the radar screen effect: “more visible stocks attract more (distant) investors and hence require lower expected returns” (Merton, 1987). Chakrabarti et al.´s (2005) study on MSCI indices effect, also, concluded that adding stocks to the index increases the volume and price. The study also presented cross-country variations regarding the effects, in their study they divide their sample into 5 sub-samples (US, UK, Japan, Developed and Developing countries) and concluded there were effects on UK and Japan.
There is extensive literature on market index inclusion, specially, regarding S&P500 (Reuling (2016), Quinn and Wang (2013), Scari (2016), Kasch and Sarkar (2012)). In general, the studies prove a positive effect on the short-term. In particular, Denis et al. (2003) concludes that the S&P 500 index inclusion is not an information-free event and that is why it has a positive impact on a firm´s returns. The reason why is not exactly clear. It could be because newly added companies face higher scrutiny of management, or it is suggested that perhaps S&P (unknowingly) has access to more information than the one made public, or even better analytical capabilities. Perhaps, investors have these beliefs and thus respond to index
9
inclusion. Nonetheless, we cannot infer the same for CSR related index, those are different from market index and additions to them have different connotations.
Hypothesis
It can be assumed this index inclusion is an information event as Vigeo takes into consideration the public information available and other complementary information companies agree to provide to its analysts in reply to specific questions, with that Vigeo constructs its indices based on their specific methodology (Equitics). The index adds value to the companies as it makes it clear to investors the best performing ones in terms of CSR. It is an information event and, therefore, should have an impact on the newly added or excluded companies. Vigeo has access to more information than the one made public, and even have superior analytical capabilities. Investors have these beliefs and respond to index inclusion. It is expected that Vigeo Eiris index inclusion will have a positive impact (if, in fact, investors value CSR initiatives) and exclusion a negative one. There are several reasons for that: it can lead to more attention to the company; it can lead to positive publicity and increase in reputation; also, performing CSR efforts might create a positive signaling effect for investors because it shows that the company has sufficient resources to invest in a project that does not directly generate revenues (Šontaitė-Petkevičienė (2015). However, we should also consider the reasons for a negative relationship: it can lead to increase of attention which in turn can lead to problems. CSR efforts are normally expensive and they might be seen as an expense for the company as it does not generate income. Investors might see it as something that lowers the financial value. Also, it can lead to negative publicity, the company can be accused of doing good to increase its brand image. This negative publicity can lead to customer and investor loss, in the end, a decrease in stock returns (Księżak, 2017). Moreover, the impact might be noticeable on the short and/or medium-term. In fact, some scholars (e.g. Berman et al. 1999, Inoue and Lee 2011), defend that the impact of CSR measures on the financial performance of a company is different during the two-time lengths. Thus, the first and second hypotheses are a starting point and will be further along tested.
H1: The announcement of Euronext Vigeo Europe 120 index composition has a significant impact on the stock returns of European companies in short term.
H2: The announcement of Euronext Vigeo Europe 120 index composition has a significant impact on the stock returns of European companies in medium-term.
Europe is a continent made by many different countries, with different political regimes, financial stabilities and ideologies. Some countries give more importance to CSR policies and
10
have more rigorous laws for protecting the environment and society in general. Therefore, it is interesting to understand whether the impact of CSR on stock performance differs on European geographical location. The European Union views CSR as an opportunity for businesses to gain competitiveness and simultaneously help maintain a sustainable environemnt. Nordic countries such as Sweden and Finland are usually at the top of rankings concerning CSR, they seem to be a good example to follow. In particular, Scandinavian countries are considered to be very concious when dealing with CSR initiatives. They pay special attention to immaterial values beyond profit maximization, they value human rights, corporate ethics, corruption and working conditions. Whereas, for instance in Spain, CSR implementation has been a slow process with difficult integration. Business models are still adaping to CSR and there is still a lot of wok to be done as each country and each corportaion reacts at its own pace (Martín, 2009).
There are three main aspects in every country that can influence a company social behavior: culture, economic context and formal institutions (law and regulations). In fact, the social-economical, juridical and cultural context shape the perceptions and practices of companies and it has been long acknowledged in several management studies. Gjølberg (2009) article points out national patterns in CSR and how a nationality of a company is relevant in its CSR initiatives. The differences in CSR performance are observed by computing a model that considers the political economy of a country. In conclusion, divergences in capitalist models impact the business strategy and behavior in different ways, in fact, the institutional framework can create a prosperous environment for CSR or not. A study by Steurer et al (2011) on CSR in Europe concluded that Western European (UK and Sancadinavian) governments are much more active in promoting CSR than Central and Eastern European (CEE) governments. This study divides Europe according to their economical models and ideological tendencies: aggregating the Anglo-Saxon (UK and Ireland), Scandinavian (Sweden, Finland, Denmark and the Netherlands) and Continental (GermanyFrance, Belgium and Luxembourg ) countries in the Western Europe group, the remaining countries Mediterraneam (Spain, Portugal, Greece and Italy) and Transitional (New EU members from CEE) into CEE group.
One might expect that CSR initiatives in Western European companies are expected, encourage and imposed, so (probably) news about a firm’s addition to the index will not have a strong impact on the stock performance. While CSR initiatives taken by Central and Eastern European companies are less expected and unrequired (by the government). Investors in those companies may view it as a waste of resources, reacting negatively to the news. These statements are made assuming investors tend to invest close to “home” (home bias effect) and, therefore, have the same lack of consideration for CSR efforts. Concerning exclusion, Central European companies
11
will probably face higher backlash for being eliminated compared to Western, because it will signal that the company is underperforming and has no longer the resources to keep investing in a non-profit practice. It will point out the bad management decisions previously taken. This differentiation of Europe regarding the Vigeo index has not yet been researched and this thesis proposes to test it in the following hypothesis.
H3: The announcement of index composition has a stronger significant impact on the stock returns of on Central Eastern European companies than on Western companies.
This next hypothesis sheds light on cross-industry variation by dividing the industry sectors into two distinct groups. CSR might have a stronger impact in some industries and a lesser impact on others, and industry context must play a role as companies do not operate in the same circumstances. They have different impacts on society due to the specific nature of their core business. It is, thus, normal that some are subject to higher media attention, public scrutiny and pressure to behave in a responsible manner (Martins, 2015). In this sense, it is necessary to make a clear distinction between industry sectors: “clean” industry sectors (e.g. banking, technology, telecommunications) and “dirty” industry sectors (e.g. chemical, automotive, mining, transport, construction, pharmaceutical and energy sectors) (Cordeiro and Tewari, 2015 and Jänicke et al., 1997). The dirty sector generates above median environmental stress while the clean sector does not (Cassou and Hamilton, 2004). For the sake of research, the “dirty” sector will be denominated by highly-pressured sector and the “clean" by low-pressured sector. It is of interest to analyze how CSR index composition impacts the two groups and if the impact is significant. It should be expected a higher positive impact for the highly-pressured sector. The addition to the index signals a positive environmental and social behavior as they are under higher attention and CSR expenses are seen as necessary. The elimination, should have a higher (negative) impact on highly-pressure as they appear to be less invested in their CSR efforts and it might deteriorate their image. For the low-pressured firms, the addition might have a negative impact, as it can be seen as a waste of resources and a publicity stunt; the exclusion might have a negative impact as well, because it will signal the company is underperforming and it highlights previous bad management decisions, however, they are also under the radar (low public attention) in relation to CSR issues.
H4: The announcement of index composition has a more significant impact on the stock returns of European companies that operate in industries with public pressure (“highly-pressured sectors”).
12
Methodology
In order to investigates whether the announcement date of the index inclusion (exclusion) can create (significant) abnormal returns depending on time, industry and geographical location, an event study is conducted. The study is based on the premise that stock prices reflect all available information about the prospects of firms. The actual event is the date of the announcement of the index, the index is made public twice a year, on the 1st of June and on the 1st of December. Regarding the data and sample selection, the study is based on companies added to the Euronext Vigeo Europe 120 over the period 2013 through 2017. Normally, event studies assume that market participants agree on how the news should be interpreted. However, this assumption cannot be accepted if one combines index inclusion and exclusion together, because of the possible different market responses to each type of news. To identify the different reactions on the different events, the index constituents were separated in two groups: the newly added stocks and the newly excluded stocks. The first group includes stocks recognized by the index as sustainable and the last group includes stocks eliminated from the index for no longer meeting the Vigeo criteria, their trading behavior is analyzed separately (table 1 shows the distribution of the two groups by the event dates). Over this interval, Vigeo Eiris identifies 166 different stocks as being added to the Index. For the inclusion analysis, there were 148 companies considered (136 unique ones) and for the exclusion analysis there were 145 companies (117 unique ones), the company names and other details are in appendix 1. The stocks are from 15 different countries and 11 industry sectors (table 2 & 3). The countries with more companies added to the index are the UK (30%) and France (20%) and the largest sector is financials (24%). UK and France large representation in the index is due to the countries’ large number of public traded companies, their strong commitment in CSR and strict regulations. France, for instance, has strong legislations to tackle air pollution, food, plastic waste, among others. They implemented the Paris Climate Agreement and promoted sustainability to other European countries. Additionally, French companies are set out to reach ambitious climate targets (Slavin and Buckman, 2017). In fact, KPMG´s worldwide survey on social reporting (2015) presented France as a leader on verified corporate responsibility, with more than 95% of companies reporting annually. For the financial sector, adopting CSR measures is strategic move as it helps their reputation (gain of credibility) and helps with their cost-efficient processes (e.g. waste and energy usage) (Herzig and Moon, 2012).
13
Table 1 -Frequency of Vigeo Euronext Europe 120 Index inclusions and exclusions per event date.
Table 2 & 3- Display of country and industry information on the sample of firms added and deleted from the Index.
In the study process, in the inclusion event, one stock was not included due to the lack of data on the required period (Technip). For the exclusion study, there were also some companies not considered (Italcementi Spa, Enel Green Power, Corio N.V., Fiat Industrial and Technip). Most of them were acquired by other companies just before the exclusion date, in fact, one of them was acquired by a company already belonging to the index (e.g. Enel Green Power was acquired by Enel) and Fiat Industrial was delisted. The data retrieved from Vigeo-Eiris and Bloomberg was treated to address the question of how a particular event- index inclusion (exclusion) announcement- changes a firm’s value by quantifying the effect on the respective stock price. Vigeo-Eiris organizes the companies by their names and ISIN codes. During the time period considered there were some name changes (e.g. France telecom to Orange or GDF SUEZ to Engie) and some ISIN code changes (e.g. Red Electrica, Arcelor Mittal or Johnson Matthey). For the purpose of this study, any name and ISIN change during the period was not considered to be a large event, with no significant impact on the value of the firms. Even more the events did not coincide with the event date in question for each company, therefore, the stocks are not excluded. Later, the stocks were identified by their tickers in order to retrieve their daily returns from Bloomberg. In the end, the sample included 166 unique stocks. The financial data was collected from Bloomberg and the non-financial data was collected from Vigeo-Eiris website. Vigeo is the Europe’s leading supplier of extra-financial analysis, and measures company´s performance in the area of Sustainable Development and Social Responsibility. Their indices,
Nº#of#Index#Additions Nº#of#Index#Exclusions 03/06/13 8 43 02/12/13 47 12 02/06/14 14 15 02/12/14 10 9 01/06/15 15 13 01/12/15 11 12 01/06/16 10 9 01/12/16 13 12 01/06/17 9 9 01/12/17 11 11 Total# 148 145
Nº#of#Index#Additions Nº#of#Index#Exclusions Total Frequency
Belgium 1 4 5 2% Denmark 3 4 7 2% Finland 6 5 11 4% France 36 24 60 20% Germany 14 14 28 10% Ireland 1 0 1 0% Italy 6 7 13 4% Luxembourg 1 0 1 0% Norway 3 3 6 2% Portugal 3 3 6 2% Spain 10 9 19 6% Sweden 10 10 20 7% Switzerland 7 7 14 5% The#Netherlands 7 8 15 5% United#Kingdom 40 47 87 30% 148 145
Nº#of#Index#Additions Nº#of#Index#Exclusions Total Frequency
Communications 8 12 20 7% Consumer#Discretionary 23 21 44 15% Consumer#Staples 10 5 15 5% Energy 4 7 11 4% Financials 40 31 71 24% Healthcare 5 9 14 5% Industrials 13 13 26 9% Materials 24 25 49 17% Technology 10 13 23 8% Telecommunications 0 1 1 0% Utilities 11 8 19 6% 148 145
14
such as Euronext Vigeo Europe 120, are composed of the highest-ranking listed companies evaluated by their agency in terms of corporate responsibility performance. It includes all companies that are part of the European Equitics Universe, which covers “the 500 issuers amongst the largest free-float market capitalizations in Europe”. The index considered in the study is the Euronext Vigeo Europe 120, it is a price index traded in the market with the symbol ENVEU. The index selection is based on data from Equitics methodology, which Vigeo has developed itself. In their words, it is a robust and stable methodology, based on international standards. It is constructed around 38 criteria (appendix 2), divided into six CSR areas (Environment, Human Resources, Human Rights, Business Behavior, Community Involvement and Corporate Governance). A company will be excluded from the index if their level of commitment is considered insufficient which is translated into a company´s overall score of the six areas. Also, a company is excluded if it is involved in recurrent controversies and shows no intentions to take corrective attitudes. The review of the index is done semi-annually and implemented on the last trading day of May and November, after the markets close (VigeoEiris website).
Following MacKinlay (1997) approach, there are several steps to consider when conducting an event study. First, the identification of the event of interest, and its timing. The index announcement is a semi-annual event and in our study, it takes place from 1st June 2013 to 1st
of December 2017. When the index composition announcement occurs on a weekend day or after the market closes, day “0” is considered to be the next business/ trading day (appendix 3). Secondly, there is a need to define the event window. It should be noted that the power to detect abnormal returns decreases as the horizon of the event study increases. In order to have a complete overview, four different lengths of event windows are analyzed: shorter period of 3 days [-1, +1] or 11 days [-5, +5] and a longer period of 21 days [-10, +10] or 41 days [-20, +20]. In similar studies, the event window is defined on multiple days, many times including only the previous and next day [-1, +1]. In fact, Fama (1998) believed that long-term event windows could not capture the true movement caused by the event, he suggests a period of few days after it. However, regarding this study, it also makes sense to have a broader event window to clearly identify the permanence of the effect. Benninga, (2014) states that an event window starts a few days before the actual event, with the length of the window being around 3, 5 or even 10. In fact, according to his book, it will allow to investigate pre-event leakage information. Thus, I considered one event window of 3 days (Fama, 1998), one of 11 days as suggested by Brown and Warner (1985) another of 21 days and, finally, one of 41-day as suggested by MacKinlay
15
and Campbell et al. (1997). The short-run window will allow us to see if the new information triggers any immediate response in the market; the intermediate window will let us see whether the effect is delayed in time or whether it is permanent. Furthermore, it is of interest to define the estimation window, in order to predict the stock return in the absence of the event in question. MacKinlay and Campbell et al. (1997) suggest using either 250 days or 120 days when using daily data and the market model parameters. On the other hand, Benninga, (2014) suggests as a rule of thumb a minimum estimation window of 126 days. In this study, I follow Benninga suggestion of 126 days, as it is consistent with both studies. Considering an estimation window of 250 trading days could lead to wrongful and biased results. As the events dates are semi-annually, we could be including past event occurrences in the estimation. For instance, when studying the exclusion effect, we can have a company that is added to the index in event 1 and excluded in event 2, having 250 days estimation would include the index effect of event 1 when computing the expected returns, this would lead to overlapping and biased estimations. Figure 1 summarizes the information on the event study methodology.
Fig. 1-Event study timeline
The next step, is the sample selection, detailed above. Then, abnormal returns are estimated according to three models: Market model, Fama French (3 factor-model) and Carhart Model (4 factor- model). Performing several models will allow to compare different results and to check for robustness. For consistency, I used the information on the Kenneth French website (European factors) to get the values of market return for the market model, also, SMB and HML factors to apply the Fama French model as well as the momentum factor used in the Carhart Model. Fama French only had data available up to 31st of May 2018, for that reason the last event day (1st June 2018) had to be cut out of the study. In the end, there were only 10 dates to be considered. During the analysis, it was clear that there was a mismatch of dates, some stocks had no return information on some dates. There are several techniques to solve this issue. One solution is to remove the companies with missing returns (it is commonly done in single-country event studies (e.g. Eades et al., 1985)), nonetheless, doing it would greatly reduce the sample size. Another solution is to use the stock returns from succeeding days to replace the missing days, to do that an average of the succeeding period can be computed over the missing period (e.g. Park, 2004). In this case, it was only missing 1 or 2-day returns from time to time,
16
so in order to minimize the loss of observations, I follow the procedure done by Brown and Warner (1985) and Sorokina and Thornton (2011). Both studies suggest using the available data and omit the missing dates from the analysis. It is a preferable technique when the missing values are just a few days.
Moreover, to test the last two hypotheses, the data was divided into two groups. To test cross-country variation, the stocks were divided in Western (W) and Central and Eastern European (CEE) as suggested in the literature and using as a second criteria their corruption perception index (CPI). The CPI ranks countries on their perceived levels of corruption, scaled from 0 to 100. High score means low levels of corruption and a more transparent country. It is a proxy for how countries might behave in relation to CSR, it is related to how their governments act, their ideologies and economic models. Countries with low level of corruption are more open to others and to ESG, whereas high corrupt countries will focus more on their own economic profit. For research purposes, the countries with high perception score (above 70) are assigned to the group W, while the others are assigned to group CEE. It coincides with the division suggested in the literature (appendix 7). Most countries added to the index are part of group W, as it is expected by their natural good behavior.
To test cross-industry variation, the sample was divided in highly pressured sector (consumer staples, energy, healthcare, industrials and materials) and low pressured sectors (communications, consumer discretionary, financials, technology, telecom and utilities). The highly pressured sectors are the heavier polluters, those industries are identified by their above median waste, soil, water and air pollution measured by their total environmental protection expenditures (EPE) scaled by their industry size (appendix 7). The EPE is the money spent on all activities purposefully aimed at the reduction of pollution or any other degradation of the environment (Eurostat), the more money the sector spends on it, the higher the impact it has on the environment and, thus, the need to take corrective actions.
For each group division, I computed the CAR for several intervals ([-1; -5], [-1; +1] and [+1; +5]) and then performed a comparative 2-sample t-test (assuming unequal variances).
An event study differentiates the returns that would have been expected if the analyzed event had not happened (normal returns) and the returns that were caused by the event (abnormal returns), three models will be used to compare the different results as estimating abnormal returns depends on the model used to predict normal returns around the event date.
17
Market model or index model representation of CAPM, is a typical economic model used to estimate stocks returns relying only a stock´s market index (in this model the risk-free rate is suppressed, however, it is approximately zero in the interval of dates considered).
𝒓𝒊= 𝜶 + 𝜷𝒓𝑴𝒕+ 𝜺𝒕
𝛼: The average rate of return the stock would realize in a period with a zero-market return. 𝛽: Stock´s sensitivity to market return.
𝑟-.: Market rate of return at period t.
𝜀.: Part of security´s return that comes from firm specific events.
For the market portfolio, normally, a broad-based stock index is used. The most popular choices are the S&P 500 Index, the CRSP Value Weighted Index and the CRSP Equal Weighted Index (MacKinlay, 1997). In this study, we are analyzing European stocks that are a part of Euronext Vigeo Europe 120, to be consistent with the other models in the study, the market return (for european factors) provided by Fama French website is used as the market benchmark. The market model is used to adjust the event date return, it removes the influence of the overall market, and by assumption, the 𝜀. is unrelated to the overall market, having an expected value of zero (Corrado, 2011). Additionally, Ordinary least squares (OLS) is used as it is a consistent estimation procedure for the market model parameters.
Fama French takes into consideration that returns can be affected by one market factor and one firm-specific factor, while also adding two factors for a firm’s size and book to market value.
𝒓𝒊,𝒕− 𝒓𝒇𝒕= 𝒂𝒊+ 𝜷𝒊𝑴(𝒓𝑴𝒕− 𝒓𝒇𝒕) + 𝜷𝒊𝑺𝑴𝑩𝑺𝑴𝑩𝒕+ 𝜷𝒊𝑯𝑴𝑳𝑯𝑴𝑳𝒕+ 𝜺𝒊,𝒕
𝑟𝑓.= risk free rate at period t.
SMB = Small Minus Big; i.e. the return of a portfolio of small stocks in excess of the return on a portfolio of large stocks.
HML = High Minus Low; i.e. the return of a portfolio of stocks with a high book to market ratio in excess of the return on a portfolio of stocks with a low book to market ratio.
The Carhart Model considers the momentum effect when estimating normal returns: 𝒓𝒊,𝒕− 𝒓𝒇𝒊 = 𝒂𝒊+ 𝜷𝒊𝑴(𝒓𝑴𝒕− 𝒓𝒇𝒊) + 𝜷𝒊𝑺𝑴𝑩𝑺𝑴𝑩𝒕+ 𝜷𝒊𝑯𝑴𝑳𝑯𝑴𝑳𝒕+ 𝜷𝒊𝑴𝑶𝑴𝑴𝑶𝑴𝒕+𝜺𝒊,𝒕
MOM = Momentum effect; i.e. the difference between winner and loser portfolios in the past. The estimated betas in the models show how much the returns are affected by the factors. The daily returns are obtained, calculate (𝑹𝒕=𝑷𝒕?𝑫𝑷𝒕A𝑷𝒕B𝟏
𝒕B𝟏 ) and after the abnormal returns are computed:
18
𝑅.: Stock return on time t.
𝑟L,.𝑚𝑜𝑑𝑒𝑙: Stock return depending on the model used.
The abnormal return during the event window is used as a measure of the impact the event had on the stock. A common assumption used to formulate the statistical significance tests is that the abnormal returns are zero. Therefore, under the null hypothesis of no abnormal returns, the expected value will be zero (Corrado, 2011): 𝑯𝟎: 𝑨𝑹𝒊,𝒕= 𝟎. For the aggregation of stock returns,
I follow MacKinlay (1997) approach. Aggregating abnormal returns is an extensively used procedure to eliminate some potential issues that may arise. One of those problems are cross-sectional correlation in event time (Gonedes (1973), Blume (1971)). Abnormal returns vary in a cross-sectional manner because the event is anticipated differently by each company, in the case of more closely followed companies, events should be more predictable, all else equal (Handbook of Empirical Corporate Finance, 2007). The average abnormal return (AAR) is computed for each particular day of the event window, given N events, the sample aggregated abnormal returns for period t is:
𝑨𝑨𝑹𝒕 = 𝟏
𝑵 𝑨𝑹𝒊,𝒕 𝑵
𝒕T𝟏
For the first event window (-1, +1), there are 3 AARs, for the second window (-5, +5), there are 11 AARs, for the third window (-10, +10), there are 21 AARs and for the last event window (-20, +20), there are 41 AARs. Also, the cumulative abnormal return for each company over the event window can be defined:
𝑪𝑨𝑹𝒊(𝒕𝟏,𝒕𝟐) = 𝟏
𝑵 𝑨𝑹𝒊,𝒕 𝒕𝟐
𝒕T𝒕𝟏
It is a measure of the total abnormal returns during the event window because it aggregates them through time. The cumulative average abnormal return can be calculated by taking the average of the sum of all abnormal returns.
𝑪𝑨𝑨𝑹(𝒕𝟏,𝒕𝟐)= 𝟏
𝑵 𝑪𝑨𝑹𝒕
𝑵
𝒊T𝟏
For the study to be complete, it is necessary to test the significance of the average abnormal return and the cumulative average abnormal return, to do so a cross-sectional test was performed for both. A simple test for testing, 𝑯𝟎: 𝑨𝑨𝑹𝒕 = 𝟎 (“The event has no impact on the stock price”) is given by:
𝒕𝑨𝑨𝑹𝒕= 𝑵×
𝑨𝑨𝑹𝒕
19
where 𝑆YYZ[ is the standard deviation across stocks at time t and is calculate by: 𝑺𝑨𝑨𝑹𝒕 =
𝟏
𝑵 − 𝟏 (𝑨𝑹𝒊,𝒕− 𝑨𝑨𝑹𝒕)𝟐
𝑵
𝒊T𝟏
Then the t-statistic for testing, 𝑯𝟎: 𝑪𝑨𝑨𝑹𝒕 = 𝟎 is given by 𝒕𝑪𝑨𝑨𝑹𝒕= 𝑵×
𝑪𝑨𝑨𝑹𝒕
𝑺𝑪𝑨𝑨𝑹
where 𝑆\YYZ is the standard deviation of the cumulative abnormal return across the sample and is calculate by: 𝑺𝑪𝑨𝑨𝑹= 𝟏 𝑵 − 𝟏 (𝑪𝑨𝑹𝒊− 𝑪𝑨𝑨𝑹)𝟐 𝑵 𝒊T𝟏
If the absolute value of the test statistic is larger than 1.96, then the null hypothesis is rejected, meaning the abnormal return is significant at the 95% level (which means that the chances that the abnormal return is random or insignificant are less than 5%), (Benninga, 2014). The abnormal returns are measured with error and there are two reasons for it: predictions about stocks´ unconditional returns are imprecise; and individual stock´s realized returns at the time of the event might be affected by factors unrelated to the event itself, which means that this component of the abnormal return does not average to precisely zero in the cross-section. Additionally, to test for robustness companies’ earnings announcement dates were checked to see whether they coincided or not with the event dates in question. This was done to reduce the confounding effect of other events. To test the hypothesis of cross-country and cross-industry variation. A 2-sample t-test was conducted. This test is used to determine if two sample means are equal. In this case, whether the cumulative abnormal returns differ depending on the part of Europe considered (1= Western and 0= CEE) or depending on the industry sector (1= “highly pressured” and 0= “low pressured”). It was done on 3 intervals: [-1; -5], [-1; +1] and [+1; +5].
𝑯𝟎: 𝑪𝑨𝑹𝟏= 𝑪𝑨𝑹𝟎, 𝒕 = 𝑪𝑨𝑨𝑹𝟏A𝑪𝑨𝑨𝑹𝟎 𝑺𝒑 𝑵𝟏𝟏A𝑵𝟎𝟏
The difference is significant if the test statistic is greater than the critical value, 1.96 (∝= 5%).
Table 4 shows the relation between the AAR of the two groups and its respective t-statistical value.
𝐶𝐴𝑅c≠ 𝐶𝐴𝑅e |t-statistic|>𝑡cA∝g
𝐶𝐴𝑅c> 𝐶𝐴𝑅e t-statistic>𝑡cA∝
𝐶𝐴𝑅c< 𝐶𝐴𝑅e t-statistic>𝑡∝
20
Results
In this section, it is presented the results on the analysis of the effect of Euronext Vigeo Europe 120 index inclusion and exclusion on the stock performance of the companies involved. First it is presented, the statistical results on inclusion, secondly, the results on exclusion, both taking into consideration the four event windows and the three models. At the end, there is the graphical representation of the results for the two events. In the analysis, the primary concern will be the average abnormal returns (AAR) on the days following the event day and the cumulative average abnormal return (CAAR) before and after the event. The abnormal returns across the different events (inclusion and exclusion) are small, never reaching (in absolute terms) more than 1%, with the three models showing similar results. Moreover, it is presented the results on cross-country and, finally, the results on cross-industry variation.
The average abnormal returns computed by each model for index inclusion events are presented through table 5 to 8 according to the event window considered. The first two tables (5 & 6) are relevant to see short-term effects of the index inclusion announcement and the other two tables (7 & 8, the latter is in appendix 8) allow us to detect any medium to long-term effects.
Table 5- Statistical results for companies added to the index, considering an event window of 3 days, where ***
is denoted significance at 1%, ** at 5% and * at 10%, N=148.
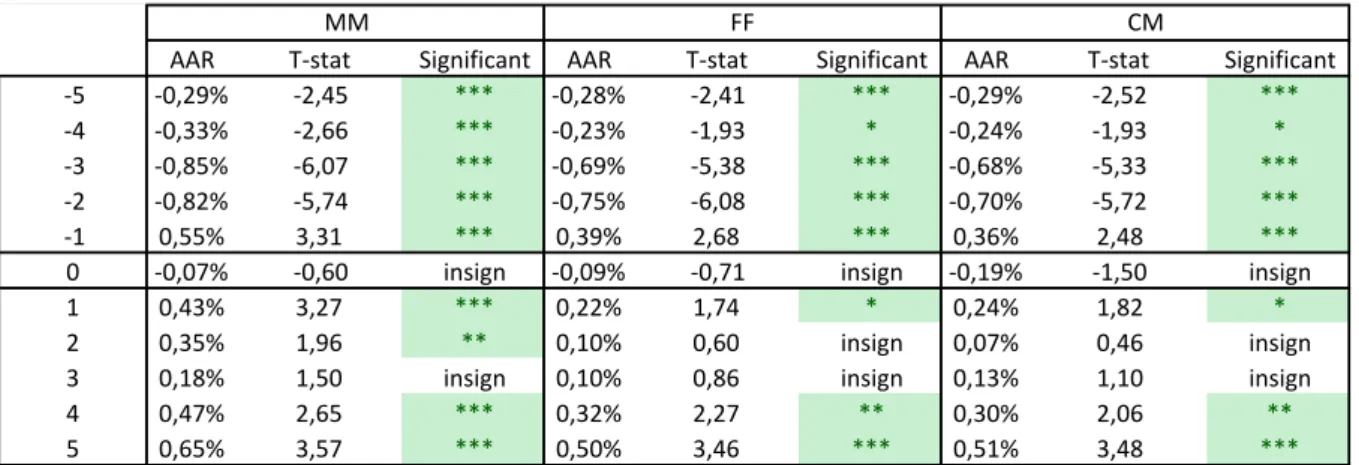
Table 6- Statistical results for companies added to the index, considering an event window of 11 days, where *** is denoted significance at 1%, ** at 5% and * at 10%, N=148.
Table 5 and 6 present close results for the same interval period [-1,1], table 6 enlarges the scope to include more days. All models show mostly significant average abnormal returns at 1% significance for the interval considered, which means that the impact of the index inclusion
AAR T$stat Significant AAR T$stat Significant AAR T$stat Significant
$1 0,58% 3,48 *** 0,37% 2,63 *** 0,35% 2,49 ***
0 $0,08% $0,66 insign $0,11% $0,88 insign $0,17% $1,34 insign
1 0,44% 3,29 *** 0,19% 1,45 insign 0,19% 1,45 insign
MM FF CM
AAR T$stat Significant AAR T$stat Significant AAR T$stat Significant
$5 $0,29% $2,45 *** $0,28% $2,41 *** $0,29% $2,52 ***
$4 $0,33% $2,66 *** $0,23% $1,93 * $0,24% $1,93 *
$3 $0,85% $6,07 *** $0,69% $5,38 *** $0,68% $5,33 ***
$2 $0,82% $5,74 *** $0,75% $6,08 *** $0,70% $5,72 ***
$1 0,55% 3,31 *** 0,39% 2,68 *** 0,36% 2,48 ***
0 $0,07% $0,60 insign $0,09% $0,71 insign $0,19% $1,50 insign
1 0,43% 3,27 *** 0,22% 1,74 * 0,24% 1,82 *
2 0,35% 1,96 ** 0,10% 0,60 insign 0,07% 0,46 insign
3 0,18% 1,50 insign 0,10% 0,86 insign 0,13% 1,10 insign
4 0,47% 2,65 *** 0,32% 2,27 ** 0,30% 2,06 **
5 0,65% 3,57 *** 0,50% 3,46 *** 0,51% 3,48 ***
21
announcement was powerful enough to create an excess of returns on the days surrounding the event. In fact, the abnormal returns are negative before the announcement, this means that the market learns about the imminent inclusion and incorporates the information into the stock price. It can be inferred that the market, based on company´s public actions, anticipates the inclusion and views it, initially, as bad news (e.g. bad allocation of resources). Chollet and Cellier (2011) also noticed a decrease in stock performance before the announcement which they attributed to market fluctuations, however, they focused on the moment after the event. On the day of the announcement, the impact is insignificant, the announcement does not seem to result in abnormal reaction. After the announcement [+4, +5], there is reversal, the impact is significantly positive, showing that, apparently, the news resulted in slightly higher returns. This might happen because the news on index inclusion are now real/concrete and investors might recognize it as a good sign (Robinson et al., 2011). Index inclusion leads to increase visibility and signals good behavior translated into higher reputation. These statements are assumptions, markets could be reacting to other events (e.g. mergers). Nonetheless, as noted by other researchers, the use of short event windows reduces the potential for confounding events to interfere with the market reaction (Konchitchki and O’Leary, 2011).
To conclude, after the announcement it seems that index inclusion is a small positive factor affecting stock prices. Being added to the index is an information event, it is expected to have a significant impact on stock performance. As firstly hypothesized, the short-term impact was expected to be positive, it should be seen by the market as good news and the results confirm it. It could be that investors value positively the index addition (higher visibility), and care that the companies they invest are socially and environmentally responsible (good reputation). There is no prior literature investigating this particular Vigeo index. A similar study by Cheung (2011) finds similar short term positive effects of index inclusion. However, the study is different as it tests the impact that DJSI inclusion on U.S. stocks. Another study by Lopez et al. (2007) concluded the opposite. There is a short-term negative impact on European companies belonging to DJSI when comparing to ones belonging to the general index. Nonetheless, the study methodology is quite different. Moreover, Chollet and Cellier (2011) saw a short-term positive effect on stock prices over the 2 days around the Vigeo ratings announcement. It does not analyze Vigeo index inclusion per se but it studies the effect of ratings provided by Vigeo.
22
Table 7- Statistical results for companies added to the index, considering an event window of 21 days, where *** is denoted significance at 1%, ** at 5% and * at 10%, N=148.
Table 7 presents similar results to the two short-term tables. There are negative abnormal returns before the announcement and positive abnormal returns after [+4, +5]. As the interval goes wider [+1, +10], there seems to be oscillating AARs. The market is indecisive about the news, reacting positively first, then negatively and returning to positive values at the end of the interval. In order to have a complete view, a longer event window is analyzed (appendix 8). The initial positive reaction could be due to index effect leading to increasing attention to the stock; then the negative reaction could be due to the negative impression investors might have to the company´s decision to allocate resources to CSR (a superfluous expense) that puts them in an economic disadvantage in comparison to other irresponsible firms (Lopez et al. (2007)).
In appendix 8, the table displays a longer interval of abnormal returns (41 days). The results are very close to the ones provided by the previous event window (table 7) and as the interval goes wider, it becomes apparent the oscillating nature of AAR (visible in graph 3, page 26). For that reason, there does not seems to be an effect in the medium-term. This could be because, although, investors value the inclusion in the index and CSR efforts, they can also see them as unessential expense, leading to confusing market responses in the medium-term. Other similar studies could not find impacts on index inclusion for the long-run (Kasch and Sarkar, 2012). Additionally, Fama (1998) has explained the difficulty of quantifying the effect as the horizon of the interval increases, which is the case.
AAR T$stat Significant AAR T$stat Significant AAR T$stat Significant
$10 $0,58% $3,64 *** $0,51% $3,03 *** $0,54% $3,25 ***
$9 $0,50% $4,03 *** $0,55% $3,07 *** $0,52% $2,89 ***
$8 $0,05% $0,38 insign $0,14% $1,03 insign $0,15% $1,15 insign
$7 0,02% 0,16 insign $0,02% $0,20 insign $0,13% $1,04 insign
$6 $0,21% $1,60 insign $0,15% $1,19 insign $0,14% $1,08 insign
$5 $0,28% $2,29 ** $0,29% $2,47 *** $0,31% $2,55 ***
$4 $0,31% $2,46 *** $0,23% $1,92 * $0,24% $1,93 *
$3 $0,83% $5,92 *** $0,67% $5,26 *** $0,65% $5,11 ***
$2 $0,81% $5,58 *** $0,76% $6,09 *** $0,71% $5,77 ***
$1 0,56% 3,35 *** 0,39% 2,64 *** 0,37% 2,53 ***
0 $0,07% $0,54 insign $0,11% $0,88 insign $0,19% $1,53 insign
1 0,44% 3,32 *** 0,21% 1,62 insign 0,22% 1,64 insign
2 0,38% 2,18 ** 0,11% 0,70 insign 0,10% 0,65 insign
3 0,20% 1,63 insign 0,08% 0,72 insign 0,10% 0,91 insign
4 0,50% 2,87 *** 0,32% 2,27 ** 0,31% 2,09 **
5 0,66% 3,67 *** 0,50% 3,42 *** 0,51% 3,44 ***
6 $0,20% $1,04 insign $0,19% $1,04 insign $0,13% $0,68 insign
7 $0,56% $3,23 *** $0,53% $3,40 *** $0,56% $3,62 ***
8 0,25% 2,50 *** 0,01% 0,07 insign 0,07% 0,68 insign
9 $0,50% $2,70 *** $0,50% $3,10 *** $0,47% $2,87 ***
10 0,05% 0,26 insign 0,09% 0,55 insign 0,10% 0,59 insign
23
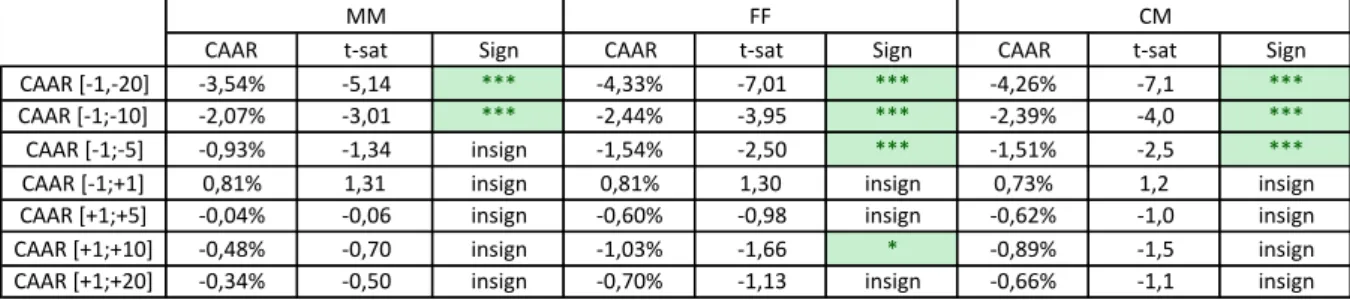
Table 9 - Cumulative average abnormal returns for inclusion before and after the event day, considering a 41-days event
window, where *** is denoted significance at 1%, ** at 5% and * at 10%, N=148.
The table above shows the cumulative impact of the (inclusion) event before and after the index composition announcement. Before, the impact is significantly negative, investors react negatively to the suspicion (suggesting leakage of information), moreover, as the interval considered decreases evidence shows a decreasing negative impact. The market may learn the companies will be in the index before the actual event day, and being in the index highlights companies´ CSR efforts (perceived bad allocation of resources) (Lopez et al., 2007). After the event, the cumulative impact is weak for FF and CM models, being only significantly positive for the market model interval [+1, +5].
The results for the exclusion study event are presented in Table 10 to 13. The first two tables analyze the short-term effect and the other two (one in appendix 9) the medium-term effect.
Table 10- Statistical results for companies excluded from the index, considering an event window of 3 days, where *** is denoted significance at 1%, ** at 5% and * at 10%, N=145.
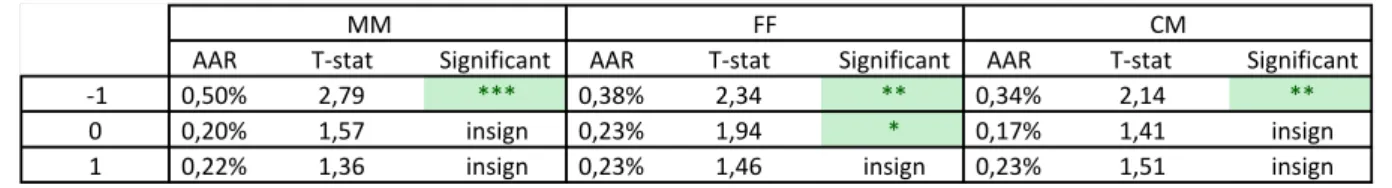
Table 11- Statistical results for companies excluded from the index, considering an event window of 11 days, where *** is denoted significance at 1%, ** at 5% and * at 10%, N=145.
CAAR t%sat Sign CAAR t%sat Sign CAAR t%sat Sign
CAAR,[%1,%20] %3,41% %5,96 *** %2,90% %3,22 *** %3,51% %3,88 ***
CAAR,[%1;%10] %3,24% %5,66 *** %2,96% %3,30 *** %3,01% %3,34 ***
CAAR,[%1;%5] %1,74% %3,04 *** %1,60% %1,78 * %1,58% %1,75 *
CAAR,[%1;+1] 0,51% 1,53 insign 0,51% 0,57 insign 0,43% 0,48 insign
CAAR,[+1;+5] 2,05% 3,59 *** 1,26% 1,40 insign 1,24% 1,37 insign
CAAR,[+1;+10] 1,01% 1,77 * 0,10% 0,12 insign 0,20% 0,22 insign
CAAR,[+1;+20] 0,50% 0,88 insign %0,53% %0,59 insign %0,51% %0,56 insign
MM FF CM
AAR T$stat Significant AAR T$stat Significant AAR T$stat Significant
$1 0,50% 2,79 *** 0,38% 2,34 ** 0,34% 2,14 **
0 0,20% 1,57 insign 0,23% 1,94 * 0,17% 1,41 insign
1 0,22% 1,36 insign 0,23% 1,46 insign 0,23% 1,51 insign
MM FF CM
AAR T$stat Significant AAR T$stat Significant AAR T$stat Significant
$5 $0,57% $5,31 *** $0,51% $4,66 *** $0,51% $4,70 ***
$4 $0,09% $0,49 insign $0,23% $1,32 insign $0,20% $1,16 insign
$3 $0,28% $2,10 ** $0,31% $2,43 *** $0,30% $2,34 **
$2 $0,36% $1,42 insign $0,79% $2,92 *** $0,75% $2,72 ***
$1 0,48% 2,63 *** 0,37% 2,27 ** 0,33% 2,05 **
0 0,20% 1,57 insign 0,24% 2,08 ** 0,17% 1,43 insign
1 0,20% 1,29 insign 0,23% 1,48 insign 0,24% 1,57 insign
2 $0,70% $3,83 *** $0,78% $4,20 *** $0,81% $4,41 ***
3 $0,34% $3,09 *** $0,41% $3,51 *** $0,38% $3,23 ***
4 $0,22% $1,32 insign $0,36% $2,32 ** $0,40% $2,52 ***
5 0,90% 4,85 *** 0,81% 5,35 *** 0,83% 5,22 ***
24
Table 10 and 11 present similar results for the same interval period [-1,1], table 10 enlarges the scope to include more days and the 3 models show close results in terms of AAR values. Nevertheless, only FF model shows significant positive AAR for the day of the index composition announcement (table 11). In general, day 0 and 1 do not seem to have an impact on stock performance. As the interval increases, the impact becomes significant. Day 2 to 4 are negatively significant, becoming positive in day 5, to have a more comprehensive view, a broader interval is considered (table 12). It can be inferred that exclusion from the index is seen a bad sign and investors (although not immediately) react negatively to it. A negative reaction to index exclusion is expected and it goes in accordance with previous studies (Cheung, 2011).
Table 12- Statistical results for companies excluded from the index, considering an event window of 21 days, where *** is denoted significance at 1%, ** at 5% and * at 10%, N=145.
Table 12 and 13 (appendix 9) present the same results as the two short-term windows. As the interval goes wider, the results are shown to be negative but insignificant. In the event period of 41-days, is visible the oscillating nature of the average abnormal returns (graph 4, page 26) because of that, it can be said that there is no medium-term effect. Companies do not appear to be permanently punished for their bad behavior.
Vigeo analysts analyze companies CSR performances according to their set criteria and rank them accordingly. An Ordinary Least Squares (OLS) regression and a probit model were estimated in order to understand whether poor financial performance before the event day was correlated with Vigeo´s exclusion decision or not. A poor financial performance could be a result of firms’ events or scandals, e.g. Zara was in the spotlight for bad press on its human rights violations (child labor) or BP for its oil leakage in the Gulf of Mexico. These events
AAR T$stat Significant AAR T$stat Significant AAR T$stat Significant
$10 $0,06% $0,47 insign 0,03% 0,26 insign 0,02% 0,16 insign
$9 $0,91% $6,22 *** $0,73% $5,02 *** $0,73% $5,01 ***
$8 $0,24% $1,64 insign $0,32% $2,27 ** $0,37% $2,63 ***
$7 0,47% 3,35 *** 0,45% 3,37 *** 0,38% 2,78 ***
$6 $0,42% $2,62 *** $0,30% $2,15 ** $0,24% $1,71 *
$5 $0,55% $5,15 *** $0,53% $4,80 *** $0,54% $4,86 ***
$4 $0,08% $0,44 insign $0,26% $1,49 insign $0,24% $1,40 insign
$3 $0,29% $2,12 ** $0,28% $2,22 ** $0,27% $2,08 **
$2 $0,37% $1,39 insign $0,81% $2,98 *** $0,77% $2,82 ***
$1 0,47% 2,56 *** 0,40% 2,39 *** 0,37% 2,22 **
0 0,18% 1,40 insign 0,24% 2,07 ** 0,18% 1,50 insign
1 0,19% 1,20 insign 0,22% 1,41 insign 0,23% 1,47 insign
2 $0,68% $3,76 *** $0,75% $4,03 *** $0,77% $4,18 ***
3 $0,34% $3,16 *** $0,41% $3,52 *** $0,38% $3,25 ***
4 $0,20% $1,20 insign $0,38% $2,43 *** $0,43% $2,66 ***
5 0,89% 4,78 *** 0,80% 5,34 *** 0,82% 5,18 ***
6 $0,16% $0,49 insign $0,11% $0,37 insign $0,04% $0,14 insign
7 $0,18% $1,05 insign $0,14% $0,86 insign $0,18% $1,05 insign
8 0,00% $0,03 insign $0,03% $0,16 insign 0,04% 0,27 insign
9 $0,20% $0,92 insign $0,17% $0,77 insign $0,16% $0,70 insign
10 0,14% 0,81 insign 0,10% 0,55 insign 0,12% 0,69 insign
CAAR<event $2,34% $5,38 *** $2,98% $6,88 *** $2,96% $7,04 ***