A Work Project, presented as part of the requirements for the Award of a Masters Degree in Management from the NOVA – School of Business and Economics
THE EFFECT OF WEB ADVERTISING VISUAL DESIGN ON ONLINE PURCHASE INTENTION: AN EXAMINATION ACROSS GENERATIONS Y AND Z
TERESA VENTIM NEVES 3417
A Project carried out on the Master in Management Program, under the supervision of: Luis F. Martinez
2 TABLE OF CONTENT ABSTRACT ... 3 INTRODUCTION ... 4 LITERATURE REVIEW ... 5 Cohort Theory ... 5 Generations Y and Z ... 6 Social Media ... 8
Attitudinal responses toward Advertising and Brands and Purchase Intention ... 8
Web Advertising Visual Design (WAVD) ... 9
MODEL AND HYPOTHESES ... 10
METHOD ... 13
Questionnaire Design ... 13
Participants’ Demographic Information ... 13
Reliability and Validity Measures ... 14
DATA ANALYSIS AND RESULTS ... 15
DISCUSSION ... 19
Theoretical and Managerial Implications ... 19
Limitations and Suggestions for Future Research ... 20
CONCLUSION ... 21
3 ABSTRACT
Web advertising is a fast-growing industry in which brands fight for the attention of the most attractive consumers: Millennials and Centennials. This study aims to test the impact of Web Advertising Visual Design on the consumers’ Online Purchase Intention and, simultaneously, analyze if such influence differs across those generations. Eight hypotheses were stipulated and tested with data from 318 individuals, collected through a questionnaire. A Structural Equation Model was constructed and, while Shaouf, Lü, and Li (2016) have established only an indirect impact on the willingness to buy, through advertising and brand attitudes, this model’s results found a visual design’s direct influence on consumer’s online purchase intention. Furthermore, and contrasting with previous findings, its indirect effect was only relevant through Attitude Toward Brand. Regarding generational differences, this study did not establish a significant disparity in intentions, which can be relevant to help perfect managerial approaches to these segments.
Keywords: Web Advertising; Visual Design; Online Purchase Intention; Brand Attitude; Generation Y; Generation Z.
4
INTRODUCTION
With several Entertainment and Media segments facing a slowing growth, Internet Advertising stands out with its continuous expanding market and a growing a consumer demand for Internet access across the globe. With high-speed mobile connections becoming increasingly available and affordable to more and more consumers, it is of high importance for brands to understand and to reach these connected customers in a personalized way. With a market that reaches all corners of the world, Internet advertising revenue continues to grow, especially around video and mobile (PwC, 2016). In such a competitive market, it is essential that a careful consideration is given to web advertising visual design (WAVD) in order for it to be able to reach its objectives within its target audience (Cho, 1999; Duffett, 2015). This because there are thousands of site stimuli and advertisement banners competing for the consumer’s attention, in such an aggressive way that each consumer has been found to spend only 6,4 seconds on each search engine result page. Hence, the growing importance of the visual design, in order to engage the consumer from the first second.
Previous studies have focused on the influence web advertising has on certain consumer reactions, measured, for example, by clickthrough rates or consumer recall. Fewer have discussed the impact WAVD can have on online purchase intention (OPI) (Goodrich, 2011; Shaouf et al., 2016). In their research, Shaouf, Lü, and Li (2016) have considered a very interesting potential impact of a direct effect of WAVD on OPI, complemented with an indirect effect, through a mediator influence of the consumer attitudinal responses to the visual design. However, and despite the known disparities in effects between different groups of consumers (regarding gender or age), there seems to be a gap in the literature when trying to comprehend if this visual influence of an advertising differs across more similar generations. Therefore, this study pretends to analyze the effects of WAVD on the consumer OPI and, furthermore, to understand if such stimuli can impact consumers from generations Y and Z differently.
5
Researchers have studied the differences across the several generations that now co-exist in the market and have found several behavioral variations across them, which has been justifying a target generational marketing by brands (Higgins, 1998; Williams & Page, 2011). Among the generations that currently exist, the Millennials (Generation Y) and the Centennials (Generation Z) are the most recent and similar ones, both being generations that are internet dependent, for example. Despite their resemblance, and contrary to what companies might expect, consumers among these generations do not react in the same way to the same stimuli (Williams & Page, 2011). Hence, it is the purpose of this study to understand if the influence WAVD has on the consumer OPI differs between these two generations.
LITERATURE REVIEW Cohort Theory
Several theories defend that age is an important determinant of consumer behavior. As people grow older, the human brain begins to perceive several stimuli differently, since many psychological changes take place (Bendlin, Fitzgerald, Ries, Xu, Kastman, Thiel & Johnson, 2010). Consequently, it can be expected that consumer behavior will also be influenced by age. Among many theories regarding such effect, the cohort theory states that people born within the same period and that, consequently, were raised in the same socio-economic and technologic environments and exposed to the same stimuli, will present similar consumer related needs, attitudes and demands (Cole, Laurent, Drole, Ebert, Gutchess, Lambert-Pandraud & Peters, 2008; Phillips & Sternthal, 1977; Solomon, Bamossy, Askegaard, & Hogg, 2006).
Cole et al. (2008) explain that cohort effects relate to the long-term impact of events on an individual that remain with him during their life. The defining moments that people experience influence values, attitudes, preferences and buying behaviors. As said before, it is expected that people born in the same particular period in time were exposed to the same defining moments. As a result, this influence remains constant throughout those people’s
6
lifetime and constitute a generational identity (Jackson, Stoel, & Brantley, 2011). Smith and Clurman (1997) emphasize that comprehending the values and motivations of a generation has become an essential step in order to target particular consumers, since each generation is raised under the influence of different defining moments and environments and, therefore, driven by unique ideas about the type of lifestyle to which they aspire.
Several authors have analyzed in depth this phenomenon across different fields in marketing. Phillips and Sternthal (1977) began by analyzing the marketing-relevant differences that age created in consumers and found that the way individuals process information is highly influenced by age. This conclusion was further complemented by several authors who found important shopping habits differences when comparing distinct generations (e.g., Lee, Hanna, Mok & Wang, 1997; Norum 2003; Rahulan, Troynikov, Watson, Janta & Senner, 2015).
To better assess these generational contrasts, some researchers tried to define the different generations and aimed to characterize the singular and unique lifestyle that portray them, in order to help marketers map their strategies and learn to adapt to such diversity among consumers (e.g., Dietz 2003; Rempel 2009; Williams & Page 2011).
Generations Y and Z
Therefore, Generation Y (also known as Millennials and iYGeneration) was defined as the group of people born between 1977 and 1994 and that, consequently, are from 23 to 40 years old by the end of 2017. Being exposed from the start to high acceptance for change and a significant respect for ethnic and cultural diversity, Millennials grew up in a time of immense and fast-paced change, where social scenarios that erstwhile were considered to be impossible became the norm (Bolton, Parasuraman, Hoefnagels, Migchels, Kabadayi, Gruber & Solnet, 2013; Williams & Page, 2011).
Another essential characteristic of this generation is that Millennials are always connected to one another through the latest technologies (Goldenberg, 2007), living in an
7
electronic and wireless society, where physical borders are fading away and global boundaries are becoming more transparent. They are accustomed to constant access to a diverse universe of opportunities and information, where anything seems possible (Williams, Page, Petrosky, & Hernandez, 2010). However, this easiness also facilitated the strong fever for fast results that characterizes Millennials and even their lack of concern with the why of things (Himmel, 2008). The combination of all these factors to which generation Y was exposed to resulted in open-minded individuals, highly efficient in multi-tasking, with a fast-paced spirit and with a strong goal orientation, being highly motivated to pursue their perceptions of success (Binder & Reeves, 2010; Moore & Carpenter, 2008).
As a summary, Williams and Page (2011) defined eight key values that best describe this generation: choice, customization, scrutiny, integrity, collaboration, speed, entertainment, and innovation.
The following generation, Generation Z (also referred to as Tweens or Baby Bloomers) is composed by people born after 1994, who therefore are less than 23 years old as of 2017.
The current society is the one in which these individuals are being raised in and, thereby, they are experiencing an environment where global terrorism and war are constants, alongside with school violence and economic uncertainty (Dietz, 2003; Kadaba, 2009; Williams et al., 2010). These surrounding conditions are raising more conservative and traditional individuals than the previous generation, with a great value being given to security (Wellner, 2000). On the other hand, they are also very savvy and high-tech people, accustomed to multiple information sources and to being constantly bombarded by notifications, since they have never lived in a world without Internet (Benjamin, 2008).
These individuals come from a vast mix of backgrounds and were, indeed, born into a world where everything, everywhere and everyone is only one click away, where nothing seems unreachable. This combination resulted in global and diverse citizens, with four main
8
characteristics, appointed by Williams and Page (2011): instant gratification; success as guaranteed; liberal social values; and a high appreciation for realness.
Social Media
Both these generations have image-driven individuals, people who make personal statements with their image (Himmel, 2008). With a greater need for peer acceptance, the norm among both generations is for individuals to be virtually connected and to social network remotely (Dickey & Sullivan, 2007; Donnelly, 2008).
Therefore, Social Media platforms have increased their presence in the day-to-day lives of these individuals and companies have begun to follow this social engagement trend. These platforms are now perceived as a major channel for global marketing communications, especially when the aim is to reach the younger generation. Moreover, a greater interest in the value of advertising in platforms such as Facebook, Instagram, YouTube and others has arisen among companies (Saxena & Khanna, 2013). Several authors have begun to study the perceptions of online (e.g., Hsu, Chuang, and Hsu 2014) and of social media advertising (e.g., Duffett 2015; He and Zha 2014). In order to assess such impressions, there is a common agreement among authors that online advertising can be measured through changes in the customers’ attitudinal responses (Hudson & Thal, 2013; Shaouf et al., 2016).
Attitudinal responses toward Advertising and Brands and Purchase Intention
Attitude can be defined as an overall feeling or evaluation of a certain subject, that can be an individual, an idea or an object (Fishbein & Ajzen, 1975). A positive attitude perception is considered one of the key sources for marketing efficiency since it will be an important driver of behavioral change (Kimelfeld & Watt, 2001). There are two important attitudes to consider regarding customer responses: Attitude Toward Advertising (ATA) and Attitude Toward Brand (ATB). ATA was defined by MacKenzie and Lutz (1989) as the response obtained in a consumer with a singular advertisement and it is proven to directly influence the consumers’
9
purchase intention of the advertised product (Suh & Yi, 2006). ATB was defined by Phelps and Hoy (1996) as a predisposition to respond in a certain manner (favorable or unfavorable) to a particular brand. Other authors have studied these relationships in an online environment, establishing an influence of the consumers’ attitudes in the impact the site stimuli have on their purchase intention (e.g., Korgaonkar & Wolin, 2002; Stevenson, Bruner & Kumar, 2000).
Purchase Intention in an online environment was defined by Cyr (2008) as a consumer’s willingness to acquire a product or a service from an online retailer, through a website. The intention of purchasing something has been proven to be related with the action of purchasing that same thing (Morwitz, Steckel, & Gupta, 2007; Pavlou & Fygenson, 2006). Therefore, the Online Purchase Intention (OPI) is also an important key performance indicator that can predict the actual purchase amount that will result from a certain online stimulus (Amaro & Duarte, 2015; Elwalda, Lü, & Ali, 2016; Shaouf et al., 2016). Several theories defend that visual elements can be used to transmit intrinsic messages to the target audience that can impact the consumers’ willingness to purchase the product, without the intermediary effect of their attitudinal responses (Goodrich, 2011; Smith, MacKenzie, Yang, Buchholz, & Darley, 2007). Thereby, the right combination of visual stimuli in an online communication strategy is an important balance that advertisers are eager to comprehend.
Web Advertising Visual Design (WAVD)
Visual Design deals with aesthetic beauty of the web advertisement and was proven to have a crucial role in its success (Cho, 1999). Karvonen (2000) showed that “aesthetic beauty” positively affects the consumer’s trust, which was empirically established by Cyr (2008) when concerning the visual design of the web advertisement. Therefore, in an online context, a carefully designed WAVD may be a differentiating factor among thousands of advertisements (Pieters, Wedel, & Batra, 2010). And from a variety of attention-grabbing tools, among which one could highlight shapes, images and font type and size, color plays a vital role in capturing
10
the attention and establishing a strong first-impression on potential consumers (Dreze & Zufryden, 1997).
As described above, some theories have arisen to explain this visual impact on consumer behavior. Among them, a commonly accepted one was proposed by Scott (1994): the theory of Visual Rhetoric, that states that visual elements (like color or images) can be used by an interested party as a message frame in an attempt to influence an audience. This theory of Visual Rhetoric has been supporting models proposed by other authors to predict online consumer behaviors (e.g., Ganguly, Dash & Cyr, 2009; Shaouf et al., 2016).
MODEL AND HYPOTHESES
This Work Project aims to understand if there exits any difference in the influence that the same WAVD has on OPI when comparing two distinct generations, Y and Z. For this purpose, a conceptual model was created in order to better assess the impact of WAVD on the consumer’s attitudinal responses and OPI. Furthermore, the generation to which the consumer belongs to was used to moderate the relationship between the variables in this model.
There are several models that try to predict behavioral intentions and their determinants. Among these, the Theory of Reasoned Action (TRA), proposed by Fishbein and Ajzen (1975), and its derivatives are widely accepted by theorists of several fields, including in online retailing (e.g., Amaro & Duarte, 2015; Elwalda et al., 2016; Pavlou & Fygenson, 2006; Shaouf et al., 2016). It establishes that the most important explanatory element of behavior is behavioral intention, rather than the subject’s attitude toward the object at which the behavior is directed. Other authors have suggested models in accordance with this theory, using cognitive judgements such as Attitude Toward Advertising (ATA) or Attitude Toward Brand (ATB) as intermediary variables that explain the effect of advertisements on purchase intention (MacKenzie & Lutz, 1989; Shimp, 1981).
11
Nonetheless, in the past few years, some authors have discussed the limitations of this theory, suggesting that the visual appeal is able to impact the consumer’s behavioral intentions, even without attitude or other cognitive judgements’ influence (Sundar & Noseworthy, 2014). These researches share the same reasoning as the theory of Visual Rhetoric presented above. The visual online stimuli’s impact on consumers’ behaviors that this theory defends can be perceived as a “direct effect” and several authors have adopted this method on recent research (e.g., Beullens & Vandenbosch, 2016; Kabadayi & Gupta, 2011).
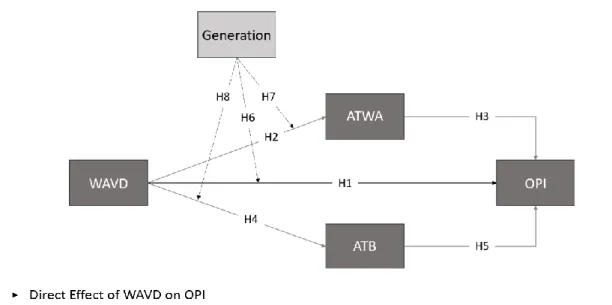
In their research, Shaouf, Lü and Li (2016) designed a new model that combined these two theories, complementing the direct effect of WAVD on OPI proposed by the theory of Visual Rhetoric with its “indirect effect”, suggested by the theory of Reasoned Action. The same reasoning was recreated in the model constructed in this project, that considers the following relationships: (1) WAVD will influence OPI, based on the theory of Visual Rhetoric (Scott, 1994; Shaouf et al., 2016); and (2) cognitive responses such as ATA and ATB will impact OPI, as the theory of reasoned action suggests (Fishbein & Ajzen, 1975; Karen Glanz, Barbara K. Rimer, 2008; Shaouf et al., 2016). The first set of hypotheses regards these direct and indirect relations that WAVD has on OPI:
H1: WAVD will have a positive effect on a consumer’s OPI.
H2: WAVD will positively influence a consumer’s Attitude Toward Web Ad (ATWA). H3: ATWA will have a positive effect on a consumer’s OPI.
H4: WAVD will positively affect a consumer’s Attitude Toward Brand (ATB). H5: ATB will influence positively a consumer’s OPI.
Regarding the moderating effect of the consumers’ generation, recent literature suggests that Generation Z can be more impervious to a single ad due to constant information exposure. Thereby, a distinguishing visual design can easily stand out to the eyes of this generation. On the other hand, Generation Y is considered more impulsive than the older generations.
12
However, this is also related with age characteristics since the same can be observed in Generation Z when comparing to Generation Y (e.g. (Groapa & Caescu, 2014; Williams & Page, 2011; Williams et al., 2010). Therefore, the remaining set of hypotheses for this model was stipulated following this reasoning:
H6: Belonging to the younger Generation (Z) will emphasize the influence that WAVD has on OPI, when comparing to consumers belonging to Generation Y
H7: Belonging to Generation Z will increase the impact that WAVD has on ATWA H8: Belonging to Generation Z will emphasize the effect that WAVD has on ATB
In order to study the established hypotheses and develop the existing theory proposed by Shaouf et al. (2016), the same method applied by these authors in their analysis was followed in this research. Therefore, a Structural Equation Model (SEM) was implemented due to its powerful casual-effect relations estimations between dependent and independent variables, while being simultaneously able to examine multiple dependence relationships (Jöreskog, 1999). The proposed model was structured as presented in Figure 1.
13 METHOD Questionnaire Design
A web-based questionnaire was designed and constructed using Qualtrics Survey’s software, which grants access to good distribution and analysis tools for sampling collection.
The questionnaire was divided into two parts, following the same reasoning applied by Shaouf et al. (2016) in their study. The first part intended to measure the general attitude the respondent had toward web advertising and their overall Visual Design, without regarding any specific advertisement. It was also assessed how WAVD and the consumer’s Attitude Toward Brands and Ads could influence the Online Purchase Intention. The questions in this section consisted in statements to which respondents had to specify their level of agreement. The measurement scope was a five-points Likert scale, which ranged from “Strongly Disagree” (-2) to “Strongly Agree” (+(-2). This measurement scope has been used in previous literature within this field (e.g., Erkan & Evans, 2016; Shaouf et al., 2016). The second half of the questionnaire aimed to measure the same attitudes toward the Design and the Online Purchase Intention but considering a specific web ad. To ensure that participants were responding based on the same stimuli, an advertising was included in the survey. The research objectives were also translated into statements to which respondents were asked to present their level of agreement but through a wider measurement scope, by means of a 7-point Likert scale. This approach was has been used by several authors in similar researches (e.g., Dabija, Babut, Dinu, & Lugojan, 2017; Escobar-Rodríguez, Grávalos-Gastaminza, & Pérez-Calañas, 2017; Quintal, Phau, Sims, & Cheah, 2016). All scales were adapted from previous research (Saadeghvaziri, Dehdashti, & Askarabad, 2013; Smith et al., 2007; Wu, Wei, & Chen, 2008; Zhang, 1996). Participants’ Demographic Information
The questionnaire was shared on social media and 517 answers to it were obtained. Before studying the collected information, data quality pre-processing and exploration methods
14
were applied to clean the data from inconsistent or incomplete variables, in order to improve the quality of the conclusions. This pre-process resulted in 184 incomplete answers that were not included due to missing information. Since this research concerned the Y and Z generations, among the remaining 333 variables, 15 were also discarded for regarding individuals born before 1977 that, thereby, could not be included in any of the analyzed generations. This data pre-selection originated a sample size of 318 valid answers to further analyze. The demographic information of the participants distribution can be found in the tables below:
Reliability and Validity Measures of the Data Collected
In order to guarantee the prediction ability of the model, several statistical analyses were performed regarding reliability and validity assessment. When concerning the first, reliability coefficients can measure the characteristics of the relationship between variables used, in order to assess the questionnaire consistency. As for validity, it compares the extent to which the model measures what it aims to measure.
Cronbach’s Alpha and Composite Reliability (CR) are common coefficients that prove the reliability of the variables when compared to a threshold of 0.7, being coefficients above this value relatively reliable. To complement these measures and confirm Convergent Validity, i.e. the degree to which measures of constructs are related to each other, the average value of the squared loadings
Table 1 – Distribution by Gender Table 2 – Distribution by Generation
Frequency % Frequency %
Female 198 62% Generation Y 124 39%
Male 120 38% Generation Z 194 61%
Total 318 100% Total 318 100%
Table 3 – Distribution by Education Table 4 – Distribution by Days of Internet Usage
Frequency % Frequency %
Preparatory School 21 7% Less than 1-day p/week 0 0%
Middle School 51 16% 1-2 days p/week 1 0%
High School 57 18% Often 9 3%
Technical School 8 3% Every day 308 97%
Bachelor Degree 120 38% Total 318 100%
Master Degree 53 17%
PhD 8 3%
15
of all indicators used in the construct scale should be higher than 0.5. This coefficient is called the Average Variance Extracted (AVE) and it confirms that each construct accounts for 50% of the indicator’s variance. Furthermore, discriminant validity is able to assess stronger relations of a construct with its indicators, in comparison with other constructs. Thereby, and according to Fornell-Larcker criterium, the AVE must be greater than the correlation of a specific construct with all the other constructs of the model to the square.
Variance Inflation Factors (VIF) were the method used in order to examine the collinearity among constructs. This test analyzes how much does the variance of an estimated construct increase due to multicollinearity issues. The values it computes are compared against a threshold of 3, where higher values mean that multicollinearity issues probably exist.
The relationships among variables were estimated through standardized regression weights, or estimated path-coefficients, and present values ranging between -1 and 1.
In order to guarantee the model’s suitability, several fit indexes were calculated and compared to a threshold of 0.9, where values bellow it would represent a poor fit.
Additionally to the Fit Indexes, other measures can be calculated to test model fit, like Root Mean Square Error of Approximation (RMSEA). However, for models with low degrees of freedom this calculation can result in an artificially high value and, since this model has only 1 degree of freedom, this computation was not considered for the model fit evaluation.
DATA ANALYSIS AND RESULTS
Regarding the model’s reliability and validity, all variables presented coefficients higher than the respective thresholds, except the AVE (ATWA) that was slightly below 0.5. However, its coefficient was of .4816, which is relatively close to the threshold value. Therefore, considering that all other coefficients are comfortably coherent with the desired values, we can assume that the model is reliable and valid. All coefficients of the model’s reliability measures are presented in the table below:
16 Table 5 – Model Reliability Measures
Cronbach’s Alpha CR AVE Corr(a;b)2 VIF
(Threshold) (> .7) (> .7) (> .5) (< AVE(a;b)) (< 3)
WAVD .883 .9062 .5218 - - ATWA - - .632 .002 1.252 ATB - - .676 .017 1.332 OPI - - .657 .161 1.114 ATWA .790 .866 .4816 - - ATB - - .702 .163 1.109 OPI - - .506 .042 1.332 WAVD - - - - 1.219 ATB .852 .87975 1.80437 - - OPI - - .759 .100 1.272 WAVD - - - - 1.223 ATWA - - - - 1.045 OPI .931 .9398 .7226 - - WAVD - - - - 1.015 ATWA - - - - 1.246 ATB - - - - 1.262
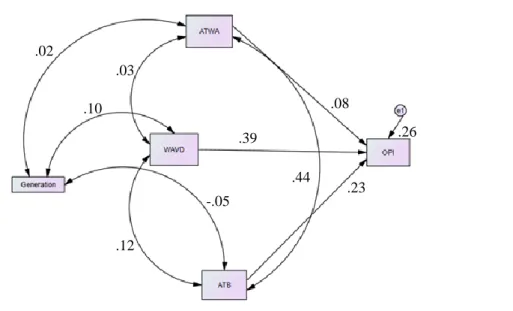
Considering the model Fit Indexes, GFI was the only coefficient above the threshold of 0.9, with a value of .974. NFI, IFI and CFI all registered values very close to the required 0.9, with .888, .893 and .887 respectively. Despite being below the threshold, due to their proximity to the desired value they can still be considered reliable factors that prove that this model is well suited. The model’s major problem was the AGFI coefficient, with a value of .613, far below the required threshold of 0.9. On the other hand, the model’s Chi-Square was 21.739 with 1 degree of freedom (and with a respective p < .001), which restores the model’s reliability. As mentioned above, a structural equation modeling (SEM) was used to assess the relationships between the proposed factors. Its results, obtained via AMOS24 (Figure 2) include the following:
(1) The model obtained suggests a positive impact of Web Advertisement Visual Design on Online Purchase Intention (OPI), in accordance with H1. The impact observed is significant, having a β= .657 and with a p < .001.
(2) According to the model, WAVD is positively correlated with Attitude Toward Web Advertisement (ATWA), in agreement with H2. However, with a β= .018, and a correspondent p= .54, this relation is not significant.
17
(3) The model suggests a positive impact of ATWA on OPI, in accordance with H3. Nonetheless, the effect is not significant, registering a β= .203, for a p= .118.
(4) According to the obtained results, WAVD is also positively correlated with Attitude Toward Brand (ATB), supporting H4. With a small observed coefficient (β= .077) this impact is significant only for an α= (or >) .05 (since p= .037).
(5) H5 was also verified since the model suggests that ATB has a positive effect on OPI. Registering a β= .428, this impact is significant (p< .001).
Figure 2 – The Obtained Model
In order to assess the moderating effect of generation in this model and to see if the average OPI registered was different between generations, the first test computed was an ANOVA. With an F-test (df= 1; 316) = 20.982 and a corresponding p< .001, the difference between the average OPI in each generation is significant, suggesting that these generations are indeed influenced differently.
Furthermore, a multi-group analysis (MGA) was performed to incorporate the generational moderating factor in this model. This analysis compared the previous estimations for the subsamples of each generation and assessed if such differences were significant:
.02 .12 .10 -.05 .03 .39 .44 .23 .08 .26
18
(6) Web Advertising Visual Design (WAVD) registered an impact on Online Purchase Intention (OPI) of β= .497 for generation Y (for a p< .001) while for generation Z the effect was higher, with β= .707 and a corresponding p< .001, in accordance with H6. The MGA however showed that the χ² difference between models is of 1.691, which for a p= .193 is not significant. Therefore, H6 is not supported.
(7) WAVD registered a null impact on Attitude Toward Web Advertising (ATWA) considering only Generation Y and a β= .06 when analyzing Generation Z. The MGA however reported that the χ² difference is very small, being only .003, for a p= .958. Thereby, H7 is not supported either.
(8) It was estimated that WAVD has a positive effect on Attitude Toward Brand (ATB) for Generation Y with a β= 0.13, and a positive effect on Generation Z with β= .12. However, the MGA presented a χ² difference of .143, which is not significant given its p= .705. Therefore, H8 is also not supported with this model.
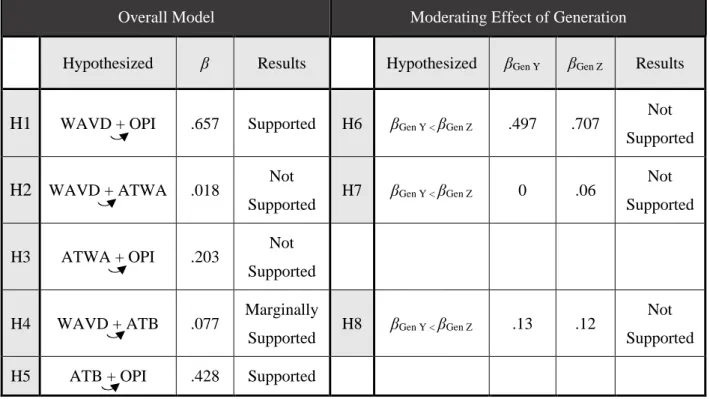
The hypotheses and the model’s results are summarized in the table below: Table 6 – Model Results
Overall Model Moderating Effect of Generation
Hypothesized β Results Hypothesized βGen Y βGen Z Results
H1 WAVD + OPI .657 Supported H6 βGen Y < βGen Z .497 .707
Not Supported H2 WAVD + ATWA .018 Not
Supported H7 βGen Y < βGen Z 0 .06
Not Supported H3 ATWA + OPI .203 Not
Supported H4 WAVD + ATB .077 Marginally
Supported H8 βGen Y < βGen Z .13 .12
Not Supported H5 ATB + OPI .428 Supported
19 DISCUSSION
This study attempted to assess whether the visual design of a web advertisement (WAVD) influenced the consumer’s online purchase intention, through a model proposal that aimed to investigate: (1) the direct and indirect effect of WAVD; and (2) how does this influence differ across generation Y and Z.
Theoretical and Managerial Implications
The hypothesis that visual aesthetics in web advertising have an important direct effect in the consumer’s online purchase intention (H1) was strongly supported, but the same was not verified for their indirect effect. In fact, WAVD’s influence on ATWA was rather weak, failing to support H2, and ATWA’s impact on OPI was not found, refuting H3. However, WAVD’s effect on ATB was already significant (for an α= 0,05), establishing H4, and the hypothesis that ATB has an influence on OPI (H5) was supported by the data as well.
Overall, this research was able to provide a clear evidence that a more elaborated visual design (e.g. colors, font type and size, shapes, graphical information) has a direct effect on the consumer, resulting in a higher willingness to purchase the product. Contrary to previous research (Shaouf et al., 2016), this model established this influence without the intermediary effect of the consumer’s attitudinal responses, solidifying the theory of Visual Rhetoric and providing relevant data for managers that a more carefully designed web advertisement immediately generates a higher purchase intention in consumers.
The Theory of Reasoned Action on the other hand, was only semi-established by this model. It was proven that the visual aesthetics in advertising can positively influence the attitudinal response a consumer has towards a brand (ATB), which positively relates to the behavioral intention of purchasing a product from that brand. This parallel is a valuable insight for a brand manager, establishing a direct effect of any advertising the brand releases on the way the brand is perceived by consumers, which culminates in a greater or lower willingness
20
to purchase from it. However, the same influence path flow was not verified for the attitudinal effect of an advertisement’s perception. Thereby, the Theory of Reasoned Action was not supported when considering the impact an ATWA can have on OPI but it was verified regarding ATB and its positive effects. This conclusion also proposes that a bad design might damage the consumer’s awareness of the brand more than the perception of that singular advertisement.
As it is represented in Table 6, this model could not establish a significant difference on the effects of advertising’s visual features on attitudinal responses or in online purchase intention when comparing both analyzed generations. However, there were previous indications that the overall OPI was significantly different across generations. Thereby, this model is in accordance with previous literature, suggesting that these generations are indeed influenced differently by the same stimuli. This result is a valuable insight to help managers build a new relation with the profitable consumers from Generation Z, who are different from the previous generation and should be reached differently in order to maximize their value. Furthermore, this study complements existing and future research by discarding the possibility that the visual aspects of an advertisement are one of such stimuli that can significantly induce these two different generations to have contrasting reactions.
Limitations and Suggestions for Future Research
Despite all these important conclusions and the statistic validations that support this model, this study was not exempt from limitations. The first recommendation for future research is to account for the influence that Attitude Toward Ad has on Attitude Toward Brand. This model did not consider this relationship as an important variable to study, however it is proven that ATA can have a positive influence on ATB (Shaouf et al., 2016; Shimp, 1981). Additionally, previous studies have found an important role of gender in these variables (Shaouf et al., 2016) and such effect was not included in this analysis. Furthermore, the Multi Group Analysis used to study the generational moderating effect was performed under 0 degrees of
21
freedom. This resulted in biased coefficients for the model’s suitability and as such there is no significant proof that the conclusions regarding this effect are correct. A final limitation of this study regards the Likert scales used in the questionnaires: these intrinsically tend to give inaccurate results because respondents might avoid giving extreme responses, even if they would correspond to their real opinions.
Overcoming these limitations would be important in a future research path. A model that better fits this study’s purpose might lead to different conclusions regarding generational differences. Furthermore, there are other indicators that might have a moderating effect and cause the same stimuli to have a different impact in consumers’ willingness to buy, such as education level, cultural issues and even age, since older generations might have more contracting behaviors than the two analyzed ones. Therefore, future researches that aim to better understand the impact that a visual design has on a consumer’s online purchase intention should begin by including such characteristics’ influence in their models.
CONCLUSION
Overall, this research contributes to e-commerce literature by studying how consumers respond to a web advertising visual design and what influence it can have on their online purchase intention. Additionally, this study also contributes to the theory of Visual Rhetoric and to the Theory of Reasoned Action, expanding both theories’ implications in an online environment, by establishing a direct and an indirect effect of the visual aesthetics of online advertising on the consumer’s online purchase intention.
Moreover, this research analyzes how consumers in different generations react to the same visual stimuli, regarding their willingness to buy the advertised product. Thereby, the results presented above have important managerial implications and provide guidance to managers when building marketing strategies to reach consumers among the analyzed generations, since costs regarding a well-crafted ad have as return a higher purchase intention.
22
REFERENCES
Amaro, S., & Duarte, P. (2015). An integrative model of consumers’ intentions to purchase travel online. Tourism Management, 46, 64–79.
https://doi.org/10.1016/j.tourman.2014.06.006
Bendlin, B. B., Fitzgerald, M. E., Ries, M. L., Xu, G., Kastman, E. K., Thiel, B. W., …
Johnson, S. C. (2010). White Matter in Aging and Cognition: A Cross-Sectional Study of Microstructure in Adults Aged Eighteen to Eighty-Three. Developmental
Neuropsychology, 35(3), 257–277. https://doi.org/10.1080/87565641003696775 Benjamin, K. (2008). Welcome to the next generation of search. Revolution, April, 56–59. Beullens, K., & Vandenbosch, L. (2016). A Conditional Process Analysis on the Relationship
Between the Use of Social Networking Sites, Attitudes, Peer Norms, and Adolescents’ Intentions to Consume Alcohol. Media Psychology, 19(2), 310–333.
https://doi.org/10.1080/15213269.2015.1049275
Binder, J. L., & Reeves, J. (2010). Bridging the Generation Gap. Marketing Health Services, (Spring), 22–24.
Bolton, R. N., Parasuraman, A., Hoefnagels, A., Migchels, N., Kabadayi, S., Gruber, T., … Solnet, D. (2013). Understanding Generation Y and their use of social media: a review and research agenda. Journal of Service Management, 24(3), 245–267.
https://doi.org/10.1108/09564231311326987
Cho, C. H. (1999). How advertising works on the WWW: Modified elaboration likelihood model. Journal of Current Issues and Research in Advertising, 21(1), 33–50.
https://doi.org/10.1080/10641734.1999.10505087
Cole, C., Laurent, G., Drolet, A., Ebert, J., Gutchess, A., Lambert-Pandraud, R., … Peters, E. (2008). Decision making and brand choice by older consumers. Marketing Letters, 19(3– 4), 355–365. https://doi.org/10.1007/s11002-008-9058-x
Cyr, D. (2008). Modeling Web Site Design Across Cultures: Relationships to Trust,
Satisfaction, and E-Loyalty. Journal of Management Information Systems, 24(4), 47–72. https://doi.org/10.2753/MIS0742-1222240402
Dabija, D.-C., Babut, R., Dinu, V., & Lugojan, M. I. (2017). Cross-generational analysis of information searching based on social media in Romania. Transformations in Business
23 and Economics, 16(2), 21–43.
Dickey, J., & Sullivan, J. (2007). Generational Shift in Media Habits. MediaWeek, 17(7), 10. Dietz, J. (2003). Defining markets, defining moments: America’s 7 generational cohorts, their
shared experiences, and why businesses should care. Journal of Consumer Marketing, 20(2), 172–173.
Donnelly, A. (2008). Playing to the digital generation. Marketing, 16, 19–20.
Dreze, X., & Zufryden, F. (1997). Testing Web Site Design and Promotionai Content. Journal of Adversting Research, 37(2), 77–91.
Duffett, R. G. (2015). Facebook advertising’s influence on intention-to-purchase and
purchase amongst Millennials. Internet Research (Vol. 25). https://doi.org/10.1108/IntR-01-2014-0020
Elwalda, A., Lü, K., & Ali, M. (2016). Perceived derived attributes of online customer reviews. Computers in Human Behavior, 56, 306–319.
https://doi.org/10.1016/J.CHB.2015.11.051
Erkan, I., & Evans, C. (2016). The influence of eWOM in social media on consumers’ purchase intentions: An extended approach to information adoption. Computers in Human Behavior, 61, 47–55. https://doi.org/10.1016/j.chb.2016.03.003
Escobar-Rodríguez, T., Grávalos-Gastaminza, M. A., & Pérez-Calañas, C. (2017). Facebook and the intention of purchasing tourism products: moderating effects of gender, age and marital status. Scandinavian Journal of Hospitality and Tourism, 17(2), 129–144. https://doi.org/10.1080/15022250.2015.1137784
Fishbein, M., & Ajzen, I. (1975). Belief, attitude, intention and behavior: an introduction to theory and research. Addison-Wesley.
Ganguly, B., Dash, S. B., & Cyr, D. (2009). Website characteristics, Trust and purchase intention in online stores:-An Empirical study in the Indian context. Journal of Information Science & Technology, 6(2).
Goldenberg, B. (2007). The rise of the digital client. Customer Relationship Management, 11(8), 12.
24
Multiple Outcomes. Psychology & Marketing, 28(4), 417–440. https://doi.org/10.1002/mar
Groapa, R., & Caescu, S. C. (2014). Brand marketing upon generations: the why of who reacts with yes? Romanian Journal of Marketing, 1, 65–71.
He, W., & Zha, S. (2014). Insights into the adoption of social media mashups. Internet Research, 24(2), 160–180. https://doi.org/10.1108/MBE-09-2016-0047
Higgins, K. T. (1998). Generational marketing. Marketing Management, 7(3), 6–9.
Himmel, B. (2008). Different strokes for different generations. Rental Product News, 30(7), 42–46.
Hsu, M.-H., Chuang, L.-W., & Hsu, C.-S. (2014). Understanding online shopping intention: the roles of four types of trust and their antecedents. Internet Research, 24(3), 332–352. https://doi.org/10.1108/MBE-09-2016-0047
Hudson, S., & Thal, K. (2013). The Impact of Social Media on the Consumer Decision Process: Implications for Tourism Marketing. Journal of Travel & Tourism Marketing, 30(1–2), 156–160. https://doi.org/10.1080/10548408.2013.751276
Jackson, V., Stoel, L., & Brantley, A. (2011). Mall attributes and shopping value: Differences by gender and generational cohort. Journal of Retailing and Consumer Services, 18(1), 1–9. https://doi.org/10.1016/J.JRETCONSER.2010.08.002
Jöreskog, K. G. (1999). How large can a standardized coefficient be. Unpublished Technical Report.
Kabadayi, S., & Gupta, R. (2011). Managing motives and design to influence web site revisits. Ournal of Research in Interactive Marketing, 5(2/3), 153–169.
https://doi.org/10.1108/09574090910954864
Kadaba, L. S. (2009). The Power of Tweens. In These Savvy 8-to-12-Year-Old Girls Are Such a Mighty Market Force They Merit Their Own DC Convention. These Savvy 8-to-12-Year-Old Girls Are Such a Mighty Market Force They Merit Their Own DC Convention. Karen Glanz, Barbara K. Rimer, K. V. (2008). Health and Health.
Karvonen, K. (2000). The beauty of simplicity. In Proceedings on the 2000 Conference: Universal Usability (p. 85).
25
Kimelfeld, Y. M., & Watt, J. H. (2001). The pragmatic value of on-line transactional advertising: a predictor of purchase intention. Journal of Marketing Communications, 7(3), 137–157. https://doi.org/10.1080/13527260121639
Korgaonkar, P., & Wolin, L. D. (2002). Web usage, advertising, and shopping: relationship patterns. Internet Research, 12(2), 191–204.
https://doi.org/10.1108/10662240210422549
Lee, J., Hanna, S. D., Mok, C. F. J., & Wang, H. (1997). Apparel Expenditure Patterns of Elderly Consumers: A Life-Cycle Consumption Model.pdf. Family and Consumer Sciences Research Journal, 26(2).
MacKenzie, S. B., & Lutz, R. J. (1989). An Empirical Examination of the Structural
Antecedents of Attitude toward the Ad in an Advertising Pretesting Context. Journal of Marketing, 53(2), 48–65. https://doi.org/10.2307/1251413
Moore, M., & Carpenter, J. M. (2008). Intergenerational perceptions of market cues among US apparel consumers. Journal of Fashion Marketing and Management, 12(3), 323–337. https://doi.org/10.1108/13612020810889281
Morwitz, V. G., Steckel, J. H., & Gupta, A. (2007). When do purchase intentions predict sales? International Journal of Forecasting, 23(3), 347–364.
https://doi.org/10.1016/j.ijforecast.2007.05.015
Norum, P. S. (2003). Examination of Generational Differences in Household Apparel Expenditures. Family and Consumer Sciences Research Journal, 32(1), 52–75. Pavlou, P. A., & Fygenson, M. (2006). Understanding and predicting electronic commerce
adoption: an extention of the theory of planned behavior. MIS Quarterly, 30(1), 115– 143.
Phelps, J. E., & Hoy, M. G. (1996). The Aad-Ab-PI relationship in children: The impact of brand familiarity and measurement timing. Psychology & Marketing, 13(1), 77–105. https://doi.org/10.1002/(SICI)1520-6793(199601)13:1<77::AID-MAR5>3.0.CO;2-M Phillips, L. W., & Sternthal, B. (1977). Age Differences in Information Processing: A
Perspective on the Aged Consumer. Journal of Marketing Research, 14(4), 444–457. https://doi.org/10.2307/3151185
26
Effects of Visual Complexity. Journal of Marketing, 74(5), 48–60. https://doi.org/10.1509/jmkg.74.5.48
PwC. (2016). Internet advertising. Global Entertainment & Media Outlook 2016-2020. Quintal, V., Phau, I., Sims, D., & Cheah, I. (2016). Factors influencing generation Y’s
purchase intentions of prototypical versus me-too brands. Journal of Retailing and Consumer Services, 30, 175–183. https://doi.org/10.1016/j.jretconser.2016.01.019 Rahulan, M., Troynikov, O., Watson, C., Janta, M., & Senner, V. (2015). Consumer behavior
of generational cohorts for compression sportswear. Journal of Fashion Marketing & Management, 19(1), 87–104.
Rempel, C. (2009). Marketing to different generations. Security Dealer & Integrator, 31(2), 34–36.
Saadeghvaziri, F., Dehdashti, Z., & Askarabad, M. R. K. (2013). Web advertising: Assessing beliefs, attitudes, purchase intention and behavioral responses. Journal of Economic and Administrative Sciences, 29(2), 99–112. https://doi.org/10.1108/09574090910954864 Saxena, A., & Khanna, U. (2013). Advertising on Social Network Sites: A Structural
Equation Modelling Approach. Vision: The Journal of Business Perspective, 17(1), 17– 25. https://doi.org/10.1177/0972262912469560
Scott, L. M. (1994). Images in Advertising: The Need for a Theory of Visual Rhetoric. Journal of Consumer Research, 21(2), 252–273.
Shaouf, A., Lü, K., & Li, X. (2016). The effect of web advertising visual design on online purchase intention: An examination across gender. Computers in Human Behavior. https://doi.org/10.1016/j.chb.2016.02.090
Shimp, T. A. (1981). Attitude Toward The Ad as a Mediator of Consumer Brand Choice. Journal of Advertising, 10(2), 9–48. https://doi.org/10.1080/10641734.1993.10505002 Smith, R. E., MacKenzie, S. B., Yang, X., Buchholz, L. M., & Darley, W. K. (2007).
Modeling the Determinants and Effects of Creativity in Advertising. Marketing Science, 26(6), 819–833. https://doi.org/10.1287/mksc.1070.0272
Solomon, M. R., Bamossy, G., Askegaard, S., & Hogg, M. K. (2006). Consumer Behaviour: A European Perspective. Pharmacy world & science : PWS (Vol. 29).
27 https://doi.org/10.1007/s11096-005-3797-z
Stevenson, J. S., Bruner, G. C., & Kumar, A. (2000). Webpage background and viewer attitudes. Journal of Advertising Research, 40(1–2), 29–34. https://doi.org/10.2501/jar-40-1-2-29-34
Suh, J.-C., & Yi, Y. (2006). When Brand Attitudes Affect the Customer Satisfaction-Loyalty Relation: The Moderating Role of Product Involvement. Journal of Consumer
Psychology, 16(2), 145–155. https://doi.org/10.1207/s15327663jcp1602_5
Sundar, A., & Noseworthy, T. J. (2014). Place the Logo High or Low? Using Conceptual Metaphors of Power in Packaging Design. Journal of Marketing, 78(5), 138–151. https://doi.org/10.1509/jm.13.0253
Wellner, A. S. (2000). Generation Z.pdf. American Demographics, 22(9), 60–64.
Williams, K. C., & Page, R. A. (2011). Marketing to the Generations. Journal of Behavioral Studies in Business, 5, 1–17. https://doi.org/10.18394/iid.80342
Williams, K. C., Page, R. A., Petrosky, A. R., & Hernandez, E. H. (2010). Multi-Generational Marketing: Descriptions, Characteristics, Lifestyles, and Attitudes. The Journal of Applied Business and Economics, 11(2), 21–36.
Wu, S. I., Wei, P. L., & Chen, J. H. (2008). Influential factors and relational structure of Internet banner advertising in the tourism industry. Tourism Management, 29(2), 221– 236. https://doi.org/10.1016/j.tourman.2007.03.020
Zhang, Y. (1996). Responses to humorous advertising: The moderating effect of need for cognition. Journal of Advertising, 25(1), 15–32.