i
The Middle East 3:
Cláudia Patrícia Carreiro da Silva
A Sentiment Analysis on Airline Customer Reviews
Dissertation presented as partial requirement for obtaining
the Master’s degree in Information Management, with a
specialization in Marketing Intelligence
i NOVA Information Management School
Instituto Superior de Estatística e Gestão de Informação Universidade Nova de Lisboa
THE MIDDLE EAST 3:
A SENTIMENT ANALYSIS ON AIRLINE CUSTOMER REVIEWS
by
Cláudia Patrícia Carreiro da Silva
Dissertation presented as a partial requirement for obtaining the Master’s degree in Information Management, with a specialisation in Marketing Intelligence.
Advisor: Roberto Henriques, PhD
Co-Advisor: Vasco Manuel Monteiro, Master
ii
DEDICATION
Aos Meus Carreiros: que mantiveram a minha sanidade mental quando achava que estava a descer pelo cano.
À NOVA IMS, pela inspiração da sua localização: o corredor aéreo que passa por cima do campus inspirou a escolher reviews de companhias aéreas em detrimento de qualquer outro tema que poderia explorar.
Aos meus professores e orientadores: por me terem apresentado às ferramentas utilizadas nesta dissertação.
Aos meus colegas da IPG: por terem sido pacientes nos meus devaneios regulares acerca das minhas descobertas ao longo desta viagem.
Aos meus amigos e à minha bestie: pela compreensão e motivação. Prometo que todos os encontros que tive de adiar de forma a conseguir rentabilizar os fins de semana valeram a pena.
A todos, muito obrigada.
iii
ABSTRACT
Along with the exponential growth of social media, the world has taken a turn, and we are no longer limited to the knowledge of our network of friends and family. Word-of-Mouth became especially relevant since travel services are intangible products and when the customers are unfamiliar with a service provider they rely on sources with experience to lower their scepticism. Online reviews are important sources of the consumer experience that can be explored to get valuable insights. Sentiment analysis has been applied to almost any field of study including tourism and hospitality. The Airline industry revenues come mostly from air passengers, and the most significant impact of research on airline service quality comes from the combination of the customer’s real experience and satisfaction. This dissertation has the goal to understand the polarity distribution on the aspects that influenced the three biggest Middle Eastern airlines customer’s satisfaction from 2014 to 2016, on Skytrax and if that polarity found on Skytrax matches the one found on TripAdvisor for 2016. The database was extracted with a web scraper and analysed with Excel Add-in from MeaningCloud.
In-flight Entertainment revealed to be the aspect with the most positive sentiment for Emirates and Etihad Airways, while for Qatar Airways the strength is on the Employees aspect. The Convenience of the Flight Schedule was an issue for the reviewers regardless of the airline.
KEYWORDS
iv
INDEX
1. Introduction ... 8
2. Literature Review ... 12
3. Methodology ... 20
3.1. Web crawl the Reviews and preprocessing ... 21
3.2. Aspect Extraction and Sentiment Analysis ... 23
4. Results and discussion ... 24
4.1. Skytrax ... 24
4.1.1. GENERAL Airline ... 26
4.1.2. Quality of the Meal Service ... 27
4.1.3. In-flight Entertainment ... 28
4.1.4. Aircraft ... 29
4.1.5. Baggage handling ... 30
4.1.6. Convenience of Flight Schedule ... 31
4.1.7. Employee ... 32 4.1.8. Ticket Reservation ... 33 4.1.9. On-time performance ... 34 4.1.10. Airline Image ... 35 4.1.11. Seat Comfort ... 36 4.1.12. Ticket Price ... 37 4.1.13. Airport ... 38 4.2. TripAdvisor... 39 4.2.1. Emirates Airline ... 40 4.2.2. Etihad Airways ... 41 4.2.3. Qatar Airways ... 42 5. Conclusions ... 43
6. Limitations and recommendations for future works ... 47
v
LIST OF FIGURES
Figure 1 - Diagram of the Project. ... 20 Figure 2 - Number of aspect mentions found on Skytrax Reviews. ... 24 Figure 3 - Sentiment distribution for the aspect GENERAL Airline on Skytrax Reviews
(2014-2016). ... 26 Figure 4 - Sentiment distribution for the aspect Quality of the Meal Service on Skytrax Reviews (2014-2016). ... 27 Figure 5 - Sentiment distribution for the aspect In-flight Entertainment on Skytrax Reviews (2014-2016). ... 28 Figure 6 - Sentiment distribution for the aspect Aircraft on Skytrax Reviews (2014-2016). .. 29 Figure 7 - Sentiment distribution for the aspect Baggage handling on Skytrax Reviews
(2014-2016). ... 30 Figure 8 - Sentiment distribution for the aspect Convenience of Flight Schedule on Skytrax Reviews (2014-2016). ... 31 Figure 9 - Sentiment distribution for the aspect Employee on Skytrax Reviews (2014-2016).
... 32 Figure 10 - Sentiment distribution for the aspect Ticket Reservation on Skytrax Reviews
(2014-2016). ... 33 Figure 11 - Sentiment distribution for the aspect On-time performance on Skytrax Reviews (2014-2016). ... 34 Figure 12 - Sentiment distribution for the aspect Airline Image on Skytrax Reviews
(2014-2016). ... 35 Figure 13 - Sentiment distribution for the aspect Seat Comfort on Skytrax Reviews
(2014-2016). ... 36 Figure 14 - Sentiment distribution for the aspect Ticket price on Skytrax Reviews (2014-2016).
... 37 Figure 15 - Sentiment distribution for the aspect Airport on Skytrax Reviews (2014-2016). . 38 Figure 16 - Number of aspect mentions found on TripAdvisor Reviews. ... 39
vi
LIST OF TABLES
Table 1 - Aspects found in the literature combined with the SAS EM topics ... 17
Table 2 - Number of reviews extracted from Skytrax (by Airline). ... 21
Table 3 - Number of reviews extracted from TripAdvisor (by Airline). ... 22
Table 4 - Cross analysis: scores vs polarity on Skytrax EK. ... 25
Table 5 - Cross analysis: scores vs polarity on Skytrax EY. ... 25
Table 6 - Cross analysis: scores vs polarity on Skytrax QR. ... 25
Table 7 - Sentiment comparison of TripAdvisor with Skytrax sentiment variation for EK in 2016. ... 40
Table 8 - Sentiment comparison of TripAdvisor with Skytrax sentiment variation for EY in 2016. ... 41
Table 9 - Sentiment comparison of TripAdvisor with Skytrax sentiment variation for QR in 2016. ... 42
vii
LIST OF ABBREVIATIONS AND ACRONYMS
C2C Consumer-to-ConsumerCGC Customer-Generated Content
EK Emirates Airline
eWOM Electronic Word-of-Mouth
EY Etihad Airways
ME3 Three Airlines of the Middle East: Emirates Airline, Etihad Airways and Qatar Airways
NLP Natural Language Processing
QR Qatar Airways
RQ Research Question
SaaS Software as a Service
SAS EM SAS® Enterprise MinerTM
UGC User-Generated Content
8
1. INTRODUCTION
Planning a trip is an intricate decision-making process (Gretzel & Yoo, 2008) such that customer reviews appear as a useful source in this process. As questioned by Khan and Baharudin (2011), “When a customer wants to travel abroad by air, how is the decision made about which airline is feasible to travel on (…)”? A consumer with less knowledge would more likely comply with the opinions of a more knowledge one (Lee & Ro, 2016). Moreover, here Sentiment Analysis gains relevance since it is in a company’s keen interest to extract some information from those opinions to incorporate it into their marketing mix decisions and by that influence consumer satisfaction (Carrillo De Albornoz, Plaza, Gervás, & Díaz, 2011). Since this industry expects to reach the 7.8 billion travellers mark by 2034 (IATA, 2017), it is relevant to understand how can text mining and sentiment analysis techniques bring intelligence to the analysis made by companies.
On the advent of globalisation, information about almost any product or service is available online, and this has brought competition to most markets (Erdil & Yildiz, 2011). Consumers can now share and exchange opinions freely in real time (Duan, Gu, & Whinston, 2008). Also, since consumers have a powerful influence on other consumers (Litvin, Goldsmith, & Pan, 2008), it is relevant to marketers to pay attention to this new interactions. By tapping into what is being said about their brands and company to create differentiation and acquire new customers and keep existing ones (Erdil & Yildiz, 2011). This type of study is also relevant for companies to make improvements in their marketing strategies (Zhang, Ye, Law, & Li, 2010). Additionally for airlines to find opportunities to perceive their passenger’s preferences and necessities (Shah, Anjum, & Shoaib, 2014) and guide stakeholders in the airline industry (Lacic, Kowald, & Lex, 2016).
With the growth of social networking and e-commerce people started to be more willing to share their inputs online being opinions and reviews (Eirinaki, Pisal, & Singh, 2012). Nowadays, social media plays an essential part in consumer markets since it has a significant influence on purchase decisions. Social Media influence is also related to the fact that consumers have more freedom to share what they are happy with but also what they are not, surpassing the company’s management and, depending on the size and influence of their network, escalate
9 negative comments (Gu & Ye, 2014). Besides, just in 2014, Gu and Ye mentioned “over 60% of consumers read consumer reviews online before making purchases” adding relevance to the subject.
By “tapping into the vibe of the customers” (Ganu, Elhadad, & Marian, 2009) marketers could automatically set “cyber risk management strategies” (Bai, 2011), “respond to customer complaints” (Gu & Ye, 2014) and improve the negative aspects brought up on reviews (Zhang et al., 2010). Because when it comes to the marketing outlay, travel review readers value more reviews than marketing information, seeing it as more reliable (Gretzel & Yoo, 2008). Air travel has become part of our everyday life. Furthermore is entirely understandable that air travellers share their experience online (Lacic et al., 2016) in the same way they share everything else in their day-to-day life. An “intensely competitive market” (Yao, Yuan, Qian, & Li, 2015) that could see an opportunity to achieve competitive advantage by gathering feedback and efficiently acknowledge the customer’s needs. Being this customer “generally aware of the service quality, rising costs and competition” (Kurtulmuşoğlu, Can, & Tolon, 2016), giving more reasons for managers make sure their airline stands out from the crowd.
Textual data has infinite configurations and can offer intelligence to those who explore it (Zhan, Loh, & Liu, 2009). Adding the fact that we are living fast-paced days, it is crucial to extract knowledge in real time to make sure the “company’s offerings stand out from the crowd” with quality (Shah et al., 2014). By tackling those reviews with Sentiment Analysis approaches managers can gather insights of potential future demand (Zhang et al., 2010). Sentiment Classification techniques will be necessary to measure the sentiment orientation and polarity of text towards an aspect (Serrano-Guerrero, Olivas, Romero, & Herrera-Viedma, 2015) where the polarity can be positive, negative or neutral (Liu, 2015).
Just as important is the complaint management, since complaining is a second chance a customer gives to a company to turn his disappointment into loyalty. Complaint management needs to be seen as a necessary defensive marketing strategy to survive in such competitive market (Gunarathne, Rui, & Seidmann, 2015). Companies also need to make sure they are giving personalised responses to each customer (Lee & Ro, 2016), making the service recovery
10 more personal (Gu & Ye, 2014) and responds in an acceptable amount of time (Tsao, Hsieh, Shih, & Lin, 2015).
Middle East’s carriers have been standing off from the crowd. Emirates Airline, Qatar Airways, and Etihad Airways have been reshaping the competitive dynamics of the industry, thanks to being geographically central and having around 4.5 billion people within an 8-hour flight radius, enabling them to connect Europe and Asia, “thought a single stop” (O’Connell, 2011). On the last three years, these airlines have continuously been on the top ten of the top 100 airlines on the World Airline Awards by Skytrax, a UK based research specialist in the air transport industry, which conducts surveys on various topics such as Ground/Airport, Onboard product and Cabin service. The Skytrax relevance reaches its peak when the World Airline Awards get called the Oscars of the aviation industry (Skytax, 2016) making it a vital review website to be taken into account for this analysis. TripAdvisor it is a USA based website that claims to be “the world’s largest travel site” (TripAdvisor, 2016). Since 2016, started to aggregate reviews from airlines (White, 2016) making it a relevant portal to analyse.
This study has two primary research questions (RQ):
RQ1: What is the sentiment distribution on reviews made to these companies, on Skytrax? RQ2: Is the sentiment found in Skytrax reviews related to the sentiment found on TripAdvisor reviews?
This dissertation intends to perceive the potential that these analysis techniques have in a world of constant and fast change. Plus, how can airlines take advantage of what their passengers and competition passengers say on reviews, to further collect insights that can be implemented in their own business? Airlines customer reviews will be the textual data used to answer both RQ. To answer RQ1, we will extract reviews related to Emirates Airline, Etihad Airways and Qatar Airways made by the users of Skytrax between 2014 and 2016 and analyse the sentiment of those reviews. Then we will extract reviews related to the same airlines but from TripAdvisor and compare the sentiment obtained with the sentiment from the reviews of Skytrax for 2016.
11 The next chapter will address a literature review about electronic Word-of-Mouth (eWOM), User-generated content (UGC), the Airline industry, text mining and Sentiment Analysis; then, we present the used Methodology to extract and analyse the data. In the Results and Discussion chapter, the obtained results will be discussed. In the Conclusions chapter, we sum up our findings, and on the Limitation and recommendations for future works, we approach the challenges found when creating this dissertation and the recommendations for future research.
12
2. LITERATURE REVIEW
Currently, there are more than three billion Internet users around the world (Internetworldstats.com, 2016), and this number has been increasing over the years. The Internet allowed a global community to form a virtual space where individuals can share their opinions and thoughts (Gretzel & Yoo, 2008) creating an opportunity for consumers to share their product evaluations (Zhang et al., 2010) and disseminate them through the web, the concept of Word-of-Mouth (WOM) on marketing literature goes back to the 60’s, and literature shows that the phenomenon has been studied for a while (Kozinets, De Valck, Wojnicki, & Wilner, 2010) but has changed since then. It was first defined as face-to-face communication connected to a product by non-commercial entities, later was modified to “all informal communications directed at other consumers about the ownership, usage or characteristics of particular goods and services or their sellers” (Litvin et al., 2008). Additionally, the web transformed from a “read-only” platform to a “read-write” platform (Cambria, Schuller, Xia, & Havasi, 2013) and this change of paradigm, allowed social networks to gain much more relevance (Ganu, Kakodkar, & Marian, 2013). WOM became especially relevant since travel services are intangible products and when the customers are unfamiliar with a service provider they rely on sources with experience to lower their scepticism (Gretzel & Yoo, 2008). Zhang, Ye, Law and Li (2010) also mentioned this particularity when referred the problem of the intangibility that the WOM may provide solutions.
eWOM (electronic version of WOM) thrived due to the affordable access to information and “information exchange” combined with the “anonymity of communication” (Litvin et al., 2008). Regarding the travel industry, eWOM becomes an aspect to pay attention to since “travellers are relying more and more on search engines to locate travel information” (Litvin et al., 2008) making it a vital piece of the decision-making process. The permanent nature of eWOM by opposition to oral WOM, on an Internet ecosystem, alleviated new ways of information creation such as product reviews (Burton & Khammash, 2010). The eWOM it is the natural evolution of the WOM, and the marketers are aware of it after all the marketing spending is on eWOM already surpassed the offline ones (Zhou & Duan, 2016). When it comes to experience goods, WOM has been quoted as “one of the most influential sources of
13 information transmission since the beginning of society” (Duan et al., 2008). This type of communication has a higher efficiency level than direct marketing approaches (Garg, Smith, & Telang, 2009).
User-Generated Content (UGC) became the next step. UGC (Fang, Ye, Kucukusta, & Law, 2016) that sometimes is referred as Consumer-Generated content (CGC) (Gretzel & Yoo, 2008) is a concept that revolutionised the way people interact since it refers to media created and shared by an individual (Crowdtap, 2015). This content is seen as insightful feedback provided by the customer and from distinct access (Guo, Barnes, & Jia, 2016). The growth of Consumer-to-Consumer online communications created the ideal environment for the development of CGC from travellers being the Internet the trampoline for the information exchange between them (Xiang & Gretzel, 2010). Online reviews take part in this type of new content creation and are essential sources of the consumer experience (Fang et al., 2016). Google Consumer Surveys revealed that online reviews affect more than 67% of the respondent purchase decisions (Hinckley, 2015) and Gretzel and Yoo in 2008 had already shared their findings regarding consumers trust reviews when faced with high involvement purchases, travel being one of them. Consumer reviews play two different roles: providing information and recommendation (Gretzel & Yoo, 2008), and given that real consumers have written the reviews, those are seen as relatable and trustworthy unlike intrusive marketing strategies (Lee & Ro, 2016). Online reviews are an excellent source of understanding the feeling of the consumer (Ganu et al., 2009) and third-party travel websites, such as TripAdvisor or Skytrax, have higher credibility since they are not tied to any commercial interests making them popular among travellers (Tsao et al., 2015).
The service industry is a big part of the world’s economy (An & Noh, 2009). Service quality is inherent to the airline industry since it affects “passenger satisfaction, passenger loyalty and passenger’s choice of airline” (Park, Robertson, & Wu, 2006). In marketing, customer satisfaction it is the main intention of a service-oriented company, as are air carriers. Delivering top service to customers’ produces savings and improves profits (Park et al., 2006) providing competitive advantage (An & Noh, 2009). As mentioned by An and Noh (2009), “service quality is the outcome of an evaluation process in which the consumer compares his or her expectations with the perception of the services that he or she has received”, meaning
14 that the flexible characteristics of the services provided by the airlines will make the passenger more sensitive to the quality provided (in-flight service, for instance).
If managers understand this gap between what is provided and what is expected they could minimise their losses (Tiernan, Rhoades, Waguespack, & Tiernan, 2013), so it is imperative to monitor their passengers satisfaction in order to meet their expectations (Azmi et al., 2010), after all, service failure can not only have an effect on financial aspects but also and non-financial aspects such as negative WOM and consumer retention (Akamavi, Mohamed, Pellmann, & Xu, 2013).
Exploring is on the human genes (Young, Pilon, & Brom, 2009) and the increasing demand for this type of transport made this industry a vital industry for the global economy (Tiernan et al., 2013). Since the deregulation of the airline industry, competition has risen with the entrance of low-cost carriers (Tiernan et al., 2013) and leaving consumers satisfied became crucial for airline survival (Park et al., 2006). This elimination of restrictions combined with tourism allowed transcontinental flows of people to circulate across the globe (Hazbun, 2004) with more ease than ever before. The Middle East airlines changed the world traffic flows due to their geographical centricity and strategic location. Around 4.5 billion people live within an 8-hour flight ration of the region (O’Connell, 2011), making this area connecting stop between continents. Emirates Airline, Etihad Airways, and Qatar Airways are the full-service airlines, which presented the fastest growth in the world. Their success is due to their hub location, and being also called “global super connectors” (Ulrichsen, 2015), high-quality in-flight service and brand awareness campaigns, which has been setting them as the airline standard for the other airlines. The development of this airlines is connected with the Arabian Gulf post-oil plan to diversify the offer of that area (from international conferences to trade shows, like Expo 2020 in Dubai) (O’Connell, 2011). Not having politic or legal constraints in comparison with American and European Legacy carriers (Ulrichsen, 2015) allows their services to become more diversified and go far and beyond to add value and establish loyalty among their passengers (Kuo & Jou, 2017).
The overload of information on the internet created by users generates attention poverty as result of the abundance of information available (Zhang et al., 2010). As a consequence, text mining became more attractive in the process of analysis of consumer feedback in opposition
15 to other methods which are more time-consuming and declarative (Liau & Tan, 2014) making the ever-growing information available in blogs and social networking more alluring (Serrano-Guerrero et al., 2015). Accessing customer review websites encourages independent travellers due to the value of personal recommendations in this industry (Jeacle & Carter, 2011). These online reviews allow customers to search for information that they consider reliable and share past experiences (Liu & Park, 2015).
Numerical data was always used to create databases since are more intuitive to handle and treat. However, textual data is directly created by customers, and with the rise of text mining, significant attention has been paid to this source of information. It is a hard asset since it requires particular skills to handle it but can be used in many sources of information to retrieve knowledge (Zhan et al., 2009).
Text mining's goal is to uncover patterns and trends of information from unstructured texts, and on the age of social media where people share their points of view, experiences and assumptions that can be used to collect insights about the consumer decision making (Liau & Tan, 2014). A research field of NLP (Liu, 2015), Sentiment Analysis has a few challenges that start with the definition of concepts such as opinion, subjectivity and emotion (Serrano-Guerrero et al., 2015). Identifying sentiments is also challenging (Kim & Hovy, 2004) because it requires an in-depth knowledge of the language of the text (Cambria et al., 2013) and the ability to classify text into positive, negative or neutral (Fang & Zhan, 2015). Since 2002 the research in this area has prospered. Not only because of the growing amount of social media data but also because opinions take an essential part of human activities.
Sentiment Analysis has three levels of research: Document-level, Sentence-level and Aspect-level. Document-level Sentiment Analysis has the task of classifying the whole opinion document as indicating a positive or negative sentiment, making it very common on product review (Liu, 2015) but also approached in tourism and travel studies by Liau and Tan (2014) and Ye, Zhang, and Law (2009). It is the most studied research topic of Sentiment Analysis and considers the document, ignoring aspects of the document, making it less specific than Aspect-level Sentiment Analysis. Sentence-Aspect-level is similar to Document-Aspect-level but a shorter version of it, except when it comes to the classification: it does not ignore the neutral (no sentiment). It shares the same issue as the one mentioned before: one opinionated sentence can express
16 many sentiments about multiple entities making it challenging to be also applied (Liu, 2015). Sentence-level was implemented by Khan et al. (2011) for reviews from airlines and airports from Skytrax. The Aspect-level Classification also called entity-based sentiment analysis or even target-based sentiment (before was called feature-level or feature-based opinion mining and summarisation, making it common for some authors still referring it in that way). It has been approached in many aspects of the tourism industry, from airlines (Yao et al. in 2015 and Misopoulos et al. in 2014) to hotels (de Albornoz et al. in 2011).
As mentioned by Guo et al. (2016) prior studies related to online reviews have been explored before. From Yahoo Movies analysis of box office comments by Liu (2006) to books in Amazon.com by Forman, Ghose and Wiesenfeld (2008). In the tourism and hospitality industry, Liu and Park (2015) used restaurant reviews from Yelp.com for their analysis. Making this subject applied to almost any field of study including tourism and hospitality (Liu, 2015).
To understand if the aspects mentioned on the literature are associated between them and provide an idea of the possible aspect to be analysed, topic modelling was performed on the aspects manually collected from the literature with the aid of SAS EM and the findings can be found in on table 1.
17 Authors (O st ro w sk i, O ’b ri en , & Go rd o n , 1 99 3 ) (Pa rk , R o b er ts o n , & Wu , 2 0 0 5 ) (Pa rk et al ., 2 0 06 ) (Pa rk , 2 00 7 ) (C h en & Wu , 2 0 0 9) (H o ss ai n , O u ed ra o go , & R ez an ia, 2 0 1 1 ) (E rd il & Y ild iz , 2 0 1 1) (Wan g, H su , L in , & Tsen g, 2 0 1 1 ) (B asf iri n ci & M itra , 20 1 5) (Ku rt u lm u şo ğl u et al ., 20 1 6) (J ee ra d ist , Th aw esae n gsk u lt h ai , & S an gs u w an , 2 0 1 6 ) (J ia n g & Z h an g, 2 01 6 ) (Ki m & Pa rk , 2 0 1 7) Tot al of A spec ts M ent ione d in the lit e ra tur e Aspects Topic
Quality of the Meal Service
+service, meal service, +meal,
in-flight service, quality X X X X X X X X X X X 11 In-flight Entertainment In-flight, entertainment, in-flight entertainment, +service, in-flight service X X X X X X X X X X 10 Aircraft +facility, aircraft, +cabin, in-flight, +crew X X X X X X X X X X 10 Baggage handling baggage, handling, delivery, accuracy, convenience X X X X X X X X X 10 Convenience of Flight Schedule +flight, +schedule, convenient, convenience, safety X X X X X X X X X 9 Employee Courtesy +employee, courtesy, help, appearance, +customer X X X X X X X X X 9 Ticket Reservation +reservation, +ticket, convenience, accuracy, promptness X X X X X X X X X 9 Flight Attendant promptness and service +attendant, +flight attendant, +flight, ticket, responsiveness X X X X X X X X X 9 On-time performance on-time, performance, on-time performance, time, +flight X X X X X X X X X 9
Airline Image +airline, +customer,
image, time, +good X X X X X X X X 8
Seat Comfort +seat, space, legroom, comfort, +seat X X X X X X X X 8 Interest in solving customers problems Interest, +solve, +problem, +customer, +delay X X X X X X X X 8 Reliability of Customer Service reliability, +customer, +service, +cabin, convenient X X X X X X X 7 Attention to Passengers +passenger, attention, personal, help, reliability X X X X X X X 7
Ticket Price ticket, +meal, price, ticket price, quality X X X X X X X 7
Airline Staff Image
Airline, image, +customer, staff,
accurate
X 1
Table 1 - Aspects found in the literature combined with the SAS EM topics
The most mentioned aspects on the literature were Quality of the Meal Service which included topics such as Food Quality and Amout of food that were mentioned by Ostrowski, O ’Brien, and Gordon (1993); Meal Service that was mentioned by Park, Robertson, and Wu (2005), Park, Robertson, and Wu (2006) and Park (2007); Provision of flight meal on Wang, Hsu, Lin, and Tseng (2011) research; In-Flight Meals which included Quality, quantity, variety
18 and frequency of meals on Hossain, Ouedraogo, and Rezania (2011) study; Jeeradist, Thawesaengskulthai, and Sangsuwan (2016) refered the Quality of the meal service; Also in 2016, Jiang & Zhang mentioned In-flight food and drinks while Kurtulmuşoğlu et al. (2016) called it In-flight food and beverages; Kim and Park (2017) named this topic In-flight meals (food & beverage): menu, quality; and also valued the avaliability of special meals.
Quality of the Meal Service is followed by In-flight Entertainment which was mentioned by Park et al. (2005), Park (2007), Chen and Wu (2009); Park et al. (2006) refered this aspect combined with movies and magazines; Wang et al. (2011) refered it as Books, newspapers and entertainment programs on the flight; Hossain et al. (2011) combined not only overhead TVs, PTVs, Music, Radio, newspaper and games but also the avaliability of functioning entertainment systems and the avaliablity of help to use them; In-flight Entertainment is also referenced in 2016 by Jeeradist et al. (2016), Jiang and Zhang (2016) and Kurtulmuşoğlu et al. (2016); Kim and Park (2017) also mentioned this aspect.
Aircraft was also mentioned in the literature multiple times, by Ostrowski et al. (1993) related to the condition of the aircraft and the attractiveness of the interior; Park et al. (2005), Park et al. (2006) and Park (2007) mentioned the recency of the aircraft; Wang et al. (2011) refered the internal decoration and the cleanliness of the cabin; Erdil and Yildiz (2011) had on their variables the current appearance of the aircraft; Basfirinci and Mitra (2015) included to the modern aircraft the cleaniness of the cabin; Jeeradist et al. (2016) also included the current appearance of the aircraft; Kurtulmuşoğlu et al. (2016) mentioned not only the air conditioning, which wasn't mentioned before but also the cleaniness of the cabin, which is also mentioned by Kim and Park (2017).
There were other less mentioned topics such as Frequent Flyer Program that can be found on authors such as (Park et al., 2005), Jiang and Zhang (2016), Kim and Park (2017), Kurtulmuşoğlu et al. (2016); travel service which can be found on Jeeradist et al. (2016); Boarding announcement and Boarding Process on Jiang and Zhang (2016); Airport lounge on Jiang and Zhang (2016) and Kim and Park, (2017); In-flight events such as shopping and duty free are mentioned by Jiang and Zhang (2016) and Kim and Park (2017); Marketing aspects such as website, advertisements, airline image, alliances, nationality, are mentioned by Kurtulmuşoğlu et al. (2016) and Kim and Park (2017).
19 Regarding the airlines in analysis, Emirates Airlines was established in 1985 and is one of the airlines with the most accelerated growth in the world (Squalli, 2014). With more than 140 destinations (TripAdvisor, 2017) and their young fleet of aircraft (Squalli, 2014), along with their geographical location, allows them to prospect 75 million passengers by 2020. A confirmed tourist destination, Dubai will be the home of Expo 2020. Qatar Airways is the counterpart from Doha, Qatar. Even though with a lower tourism volume in comparison with Dubai, Doha works more as a hub/connector than a tourism destination. QR was also the first of the three most prominent airlines in the Middle East to join a global alliance, Oneworld, in 2012 (Ulrichsen, 2015). The city of Qatar will host the FIFA World Cup in 2022 (Ulrichsen, 2015) and QR will be not only the official partner but also the official airline of the event (FIFA, 2017), which will give a significant boost to the promotion of the area. Etihad Airways is the youngest of the three, and the flag carrier of the United Arab Emirates with its hub at Abu Dhabi. Not an alliance member but has many codesharing agreements (Ulrichsen, 2015).
20
3. METHODOLOGY
This study is going to be focused on the online community of airline reviews to answer the purpose research questions. The data collection will be extracted from reviews made by customers on two websites: Skytrax1 and TripAdvisor2. Based in London, UK, Skytrax is a
research specialist in the air transport industry. It is dedicated to enhancing the customer experience for airlines and airports and yearly publishes quality awards regarding Airline and Airport quality, which they publicly state, doesn’t include customer ratings or reviews. Their business is focused on consulting (Skytrax, 2016). TripAdvisor is an American company, which claims to be “the world’s largest travel site”. This platform congregates advice from travellers about the most varied aspects connected to this activity (TripAdvisor, 2016).
All the sites mentioned before are ideal for the type of research the author intends to do in this study since they are renowned websites on the air travel and tourism industry. This study will have the following organisation: Web Crawl the reviews, preprocess the reviews, extract aspects, sentiment analysis and, results and discussion of the results obtained. This analysis will happen for Skytrax and TripAdvisor websites. The process can be demystified in figure 1.
Figure 1 - Diagram of the Project.
The detailed explanation of the figure 1 components will be addressed hereafter.
1http://www.airlinequality.com/ 2https://www.tripadvisor.pt/
21
3.1. WEB CRAWL THE REVIEWS AND PREPROCESSING
For the Skytrax website, Mozenda.com was the website used to extract the consumer reviews. It has software that uses a “point-and-click” tool (mozenda.com, 2017a) making it easier to extract the wished information without any coding. Mozenda extracts drop-down information and performs pagination (mozenda.com, 2017b), which was this author primary goal for the Skytrax extraction. The extraction was completed on the February 5th, 2017, extracting all the
information from reviews section on the website till the date of completion, for all three airlines. Afterwards, were extracted three CSV files from the platform with the following information: Date, Review and Score. Those files were later transformed into an XLSX file to not have issues with the commas on the texts at the column split. The Date was in YYYY-MM-DD format and the Score on a 1 to 10 scale. Then the database was shortened to only have data from 2014 till 2016, to be able to create a historical analysis later. The database transformation was performed manually on a spreadsheet. No duplicated reviews were found, and even though only English reviews were selected on the website a language, another language check was performed on Google Sheets with the =DETECTLANGUAGE( a formula which confirmed that the filter was well applied.
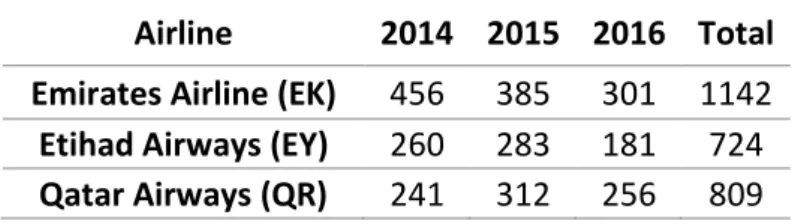
In total, the number of reviews was the following:
Table 2 - Number of reviews extracted from Skytrax (by Airline).
For the TripAdvisor website, dexi.io was the platform used. TripAdvisor.com had a peculiarity when compared with Skytrax.com: it required a user account to be able to access the full review, which was a barrier to most web scrapers, but not for dexi.io. The extraction was performed on February 24th, 2017. XLSX files were used for the TripAdvisor analysis.
Since the Airline Reviews on TripAdvisor were only available since 2016, only that year will be used for analysis. The information extracted was the following: Date, Review and Score.
Airline 2014 2015 2016 Total Emirates Airline (EK) 456 385 301 1142 Etihad Airways (EY) 260 283 181 724 Qatar Airways (QR) 241 312 256 809
22 The Date was in the MM-DD-YYYY format. The score was extracted on a 1 to 5 scale. Some reviews were duplicated and were removed with the aid of Microsoft Excel leaving Emirates Airlines with eight fewer reviews, Qatar Airways with three fewer reviews and Etihad too. A language check was also performed for this data, and the results were similar to those from Skytrax. The outputs had some HTML code that was not appropriately removed on extraction which was removed with the aid of Find and Replace tool which replaced the break code with space and the same happened for the score. The score was on “Number” of “Total Number” of bubbles format. In total, the number of reviews was the following:
Table 3 - Number of reviews extracted from TripAdvisor (by Airline).
A random ID was created and added to each review. This ID was ten characters long, including numeric digits, uppercase letters, lower case letters and was indented to be unique (random.org, 2017). With this ID, the marketing managers will be able to identify which reviews are critical to being the answer to work on the client recovery.
Airline Total Reviews Emirates Airline (EK) 6976
Etihad Airways (EY) 2547 Qatar Airways (QR) 3267
23
3.2. ASPECT EXTRACTION AND SENTIMENT ANALYSIS
As mentioned in 2, the aspects of the analysis were based on topics found in the literature. Notwithstanding, aspects such as Employee Courtesy, Reliability of Customer Service, Attention to Passengers, Airline Staff Image, Flight Attendant promptness and service, Interest in solving customers problems, are somehow related with intangible aspects of the service (Azmi et al., 2010) and in order to not perform a redundant analysis all the aspects mentioned before will be part of one aspect named Employee. Even though not mentioned in the literature, the authors sense that is important also to include the aspect Airport. Since all the air travel is performed via an airport, it was essential to understand how this space related to the passenger’s sentiment towards the airlines.
To perform the Sentiment Analysis, an add-in for Excel from MeaningCloud was used. MeaningCloud is a SaaS product that allows users to perform text analytics. With the aid of their Sentiment analysis API, their Excel Add-in can extract aspect-based sentiment, differentiate facts from opinions, detect irony and polarity, between other features (MeaningCloud, 2017); all this without programming which could be very pleasant to marketing managers. The outputs generated by this add-in for Excel include a Document Analysis, which explores the global sentiment of the text (this analysis generates the polarity tag, the agreement of the polarities detected, if the text is considered subjective or objective, and if the text has some irony in it), and Topic Analysis, which works similar to the document but on specific topics with their polarity associated to which topic (MeaningCloud, 2017). To get a more refined information, a dictionary was created on the MeaningCloud platform. It has per basis the aspects mentioned in the literature, combined with some adaptations. An exploratory analysis was performed combining all the topics picked up by the software on a single spreadsheet from Excel. The Skytrax topics and the TripAdvisor topics resulted in a total of 233 155 words, which, after being eliminated the duplicates resulted in a total of 8 221 words. Then these words were manually checked and distributed into the aspects mentioned in the literature with the goal of adding them as Alias of the primary aspect of the dictionary. Other generic words that were relevant to each aspect were also added to the dictionary.
24
4. RESULTS AND DISCUSSION
4.1. SKYTRAX
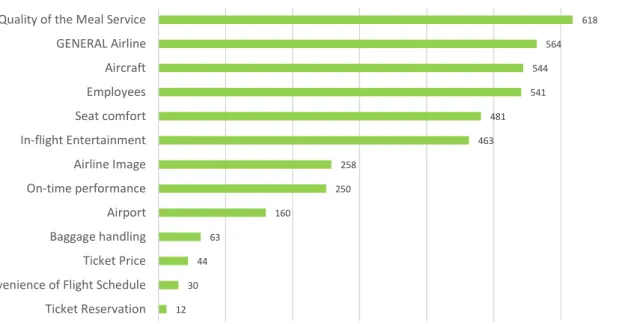
Figure 2 - Number of aspect mentions found on Skytrax Reviews.
Before the aspect analysis is relevant to understand the weight that each one of the aspects had in the reviews of Skytrax. As found on figure 2, the aspect that stands out is Quality of the Meal Service which was also the most mentioned aspect found on the literature, followed by GENERAL Airline, which is related with terms of each of the airlines in the analysis. The disparity in some aspects is colossal, for instance when comparing Quality of the Meal Service with the least mentioned aspect, Ticket Reservation, but negative WOM can severely impact brands (Litvin et al., 2008) since micro-level WOM may have an effect on the macro-level (Ye et al., 2009)and those 12 mentions can be related to extremely negative sentiment which can influence potential passengers (Garg et al., 2009) and make them choose an airline in detriment of others.
After the sentiment analysis, the obtained results included objective sentences. Moreover, since objective sentences can also transmit sentiment and opinions due to the desirability and undesirability of facts (Liu, 2015), it was decided to use all the reviews available for all airlines and respective websites.
618 564 544 541 481 463 258 250 160 63 44 30 12 Quality of the Meal Service
GENERAL Airline Aircraft Employees Seat comfort In-flight Entertainment Airline Image On-time performance Airport Baggage handling Ticket Price Convenience of Flight Schedule Ticket Reservation
25 Table 4 - Cross analysis: scores vs polarity on Skytrax EK.
Since, on the extraction, a retrieval of the score was also performed. It was essential to cross the information picked up by the software with the scores each reviewer attributed to their review. Ignoring the neutral reviews and all of the reviews without sentiment, table 4 was created. Skytrax scores are presented on an even number; it was established that all the scores above the score six (including) were considered to be positive and all the scores below the score five (including) were considered to be negative. On the negative polarity, 86.4% of the results were scored negatively too. For the positive polarity, 86.1%, which may be a sign that most reviews scores are in tune with the classification made by the add-in.
Table 5 - Cross analysis: scores vs polarity on Skytrax EY.
On the cross-score analysis, which can be found in table 5, 93.7% of the negative sentiment match the scores below 5, which is in tune with what would be expected. On the other hand, the positive sentiment and the scores above six only match 80.2% of the positive scores. A surprise on this analysis is the sentiment on the score of 10, which is lower than it would be expected, for the highest score available for the positive sentiment.
Table 6 - Cross analysis: scores vs polarity on Skytrax QR.
Scores: 1 2 3 4 5 6 7 8 9 10 Negative 28.2% 15.0% 17.4% 10.8% 15.0% 6.6% 3.8% 1.4% 1.0% 0.7% Positive 2.5% 2.0% 2.6% 2.0% 4.7% 5.0% 9.5% 21% 23% 28% Scores: 1 2 3 4 5 6 7 8 9 10 Negative 38.2% 25.0% 14.0% 8.8% 7.7% 1.5% 2.9% 0.4% 1.5% 0.0% Positive 5.0% 4.4% 3.2% 3.5% 4.1% 6.3% 13.9% 16% 26% 18% Scores: 1 2 3 4 5 6 7 8 9 10 Negative 14.4% 6.2% 14.4% 12.4% 16.5% 17.5% 8.2% 5.2% 4.1% 1.0% Positive 0.0% 1.3% 1.8% 1.6% 3.9% 5.5% 10.8% 18% 26% 31%
26 As found on the cross-analysis in table 6, QR only had 61.3% of its negative sentiment on the scores below the score five, with 17.5% of the score six being accounted as negative which is quite unusual. On the positive side, 91.3% of the positive sentiment being matched with the scores above six is in tune with what the authors found in the previous analysis of EK and EY.
On the later chapter, it will be performed a sentiment analysis on the aspects found in the literature combined with the aspect Airport, which presence was justified in the previous chapter.
4.1.1. GENERAL Airline
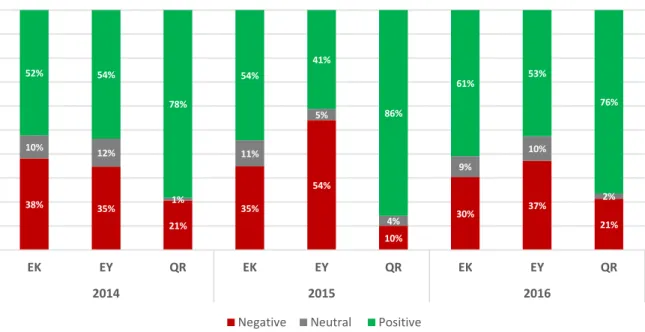
Figure 3 - Sentiment distribution for the aspect GENERAL Airline on Skytrax Reviews (2014-2016).
In 2014, the highest positive sentiment was from QR, as found in figure 3, with 78%, followed by EY (54%) and EK with only 52%. In the following year, EK and QR increased their positive sentiment in 2% and 8% respectively. While EY had an increase in their negative sentiment to a problematic 54%. In 2016, that tendency decreased for EY with an increase of the positive sentiment of 12%, making it an essential aspect to pay attention for 2017. EK increased their positive sentiment while QR decreased their positive sentiment but still has the highest positive sentiment of the three airlines.
38% 35% 21% 35% 54% 10% 30% 37% 21% 10% 12% 1% 11% 5% 4% 9% 10% 2% 52% 54% 78% 54% 41% 86% 61% 53% 76% EK EY QR EK EY QR EK EY QR 2014 2015 2016
GENERAL Airline Sentiment distribution for Skytrax Reviews (2014-2016)
27 4.1.2. Quality of the Meal Service
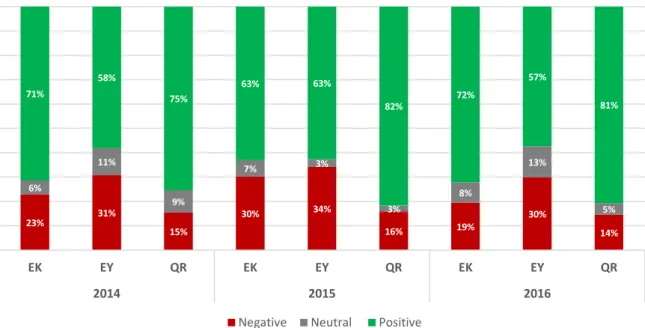
Figure 4 - Sentiment distribution for the aspect Quality of the Meal Service on Skytrax Reviews (2014-2016).
Being the most mentioned aspect of the literature and the most referenced in both websites make this aspect one of the most relevant of the analysis.
As mentioned on figure 4, for EK, 2014 was a year with a very high positive sentiment (71%) however have not surpassed QR, which had more 4% of positive sentiment for this aspect. EY, on the contrary, had only 58% of positive sentiment and was also the airline with the highest negative sentiment with 31%.
While 2015 was a very negative year for EK with a drop on the positive sentiment of 8%; it was a very positive year for EY which had an increase of 5% on the positive sentiment and QR and increase of 7%.
However, EY did not maintain it for 2016, suffered a drop in the positive sentiment to 57% still to an increase of the neutral sentiment. QR also had a decrease of 1% to increase the neutral sentiment. EK was the only airline that increased the positive sentiment in 2016 with an increase of 9% when compared with the previous year.
23% 31% 15% 30% 34% 16% 19% 30% 14% 6% 11% 9% 7% 3% 3% 8% 13% 5% 71% 58% 75% 63% 63% 82% 72% 57% 81% EK EY QR EK EY QR EK EY QR 2014 2015 2016
Quality of the Meal Service sentiment distribution for Skytrax Reviews (2014-2016)
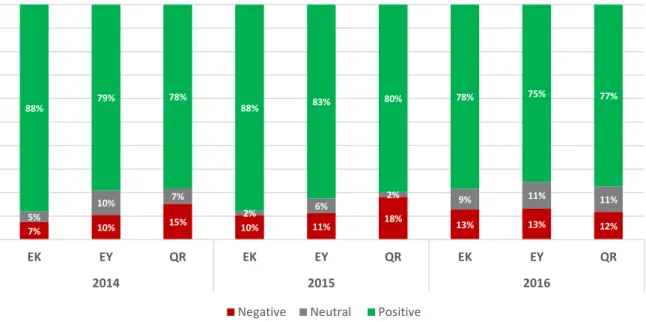
28 4.1.3. In-flight Entertainment
Figure 5 - Sentiment distribution for the aspect In-flight Entertainment on Skytrax Reviews (2014-2016).
In-flight Entertainment is an aspect with a high positive sentiment over the years and across all three airlines as found in figure 5. On this aspect, EK stands out as the airline with the highest positive sentiment over the years in analysis. In 2014 EK had 88% of positive sentiment, a trend that keeps into 2015 and suffers a decrease of 10% in 2016. EY and QR positive sentiment are very similar throughout the years however while EY stands out on the first two years, QR outstrips EY in 2016 by 2% of the increase in the positive sentiment.
The negative sentiment is shallow, but there’s always room for improvement. Meaning that the airlines should invest in solutions that keep those negative sentiment levels low for the years to come. 7% 10% 15% 10% 11% 18% 13% 13% 12% 5% 10% 7% 2% 6% 2% 9% 11% 11% 88% 79% 78% 88% 83% 80% 78% 75% 77% EK EY QR EK EY QR EK EY QR 2014 2015 2016
In-flight Entertainment sentiment distribution for Skytrax Reviews (2014-2016)
29 4.1.4. Aircraft
Figure 6 - Sentiment distribution for the aspect Aircraft on Skytrax Reviews (2014-2016).
For this aspect combined with the analysis of figure 6, is clear that QR has the highest positive sentiment over the years of the analysis. Still, all three airlines registered increases between 1% and 8% making this aspect a promising one.
EY could invest to improve the negative sentiment, even though it has been dropping on the last two years of this analysis, it should be an aspect to pay attention to make sure it does not increase on the following year.
28% 40% 20% 27% 37% 22% 27% 33% 18% 6% 6% 9% 4% 8% 7% 3% 4% 4% 66% 54% 71% 68% 55% 71% 69% 63% 78% EK EY QR EK EY QR EK EY QR 2014 2015 2016
Aircraft sentiment distribution for Skytrax Reviews (2014-2016)
30 4.1.5. Baggage handling
Figure 7 - Sentiment distribution for the aspect Baggage handling on Skytrax Reviews (2014-2016).
Baggage handling is always a source of many problematics when travelling. As stated in figure 7, this analysis is no different. EY had the highest negative sentiment for this aspect and is even more worrying since the trend of this negative sentiment is increasing through the years. QR, on the other hand, had a considerable drop on the negative sentiment in 2015 yet increased on the following year by 20%, making it reach the 27% of negative sentiment which was also the negative sentiment for 2014. EK is also keeping negative sentiment growing path, which can become a more prominent problem than already is. So is essential for all three airlines to improve this aspect of the service.
36% 67% 27% 53% 74% 7% 58% 75% 27% 9% 7% 4% 5% 55% 33% 73% 47% 26% 86% 38% 20% 73% EK EY QR EK EY QR EK EY QR 2014 2015 2016
Baggage handling sentiment distribution for Skytrax Reviews (2014-2016)
31 4.1.6. Convenience of Flight Schedule
Figure 8 - Sentiment distribution for the aspect Convenience of Flight Schedule on Skytrax Reviews (2014-2016).
Owed to its geographic location, some of the ME3 flights occur in the early hours of the morning or night due to their lack of night flight restrictions. It can be challenging for passengers who do not flight often. The Convenience of Flight Schedule, as stated in figure 8, also has high values of negative sentiment. Being the most obvious the increase of 21% from 2014 to 2015 of EY, that in 2016 dropped to 57% on the following year. EK and QR had oscillations thought the analysis: started with 64% and 43% respectively, experienced a drop to 38% and 25% and then to experience an additional increase of the negative sentiment of 50% and 56%. This inconsistent pattern only enforces the need to tackle this aspect and create solutions to decrease the negative sentiment.
64% 62% 43% 38% 83% 25% 50% 57% 56% 9% 8% 6% 27% 38% 57% 54% 17% 69% 50% 43% 44% EK EY QR EK EY QR EK EY QR 2014 2015 2016
Convenience of Flight Schedule sentiment distribution for Skytrax Reviews (2014-2016)
32 4.1.7. Employee
Figure 9 - Sentiment distribution for the aspect Employee on Skytrax Reviews (2014-2016).
The employees are the closest the company can get to their customers. On this aspect, and stated in figure 9, the overall sentiment is positive with QR having the highest positive values, even with a 3% drop in 2016. On the opposite side, EY revealed themselves, throughout the years, to be the airline with the highest negative sentiment in this aspect. However, still, EY registered a massive drop in this sentiment from the year 2015 to 2016 with a variation of 16%, which is a huge accomplishment.
25% 34% 18% 27% 42% 11% 20% 26% 6% 6% 7% 7% 5% 6% 4% 7% 7% 69% 60% 75% 68% 53% 89% 76% 67% 86% EK EY QR EK EY QR EK EY QR 2014 2015 2016
Employees sentiment distribution for Skytrax Reviews (2014-2016)
33 4.1.8. Ticket Reservation
Figure 10 - Sentiment distribution for the aspect Ticket Reservation on Skytrax Reviews (2014-2016).
This aspect has experienced extreme variations as seen in figure 10. EK and EY in 2014 had the lowest negative sentiment, with 33% however in the following year EK negative sentiment increased 34% while EY positive sentiment reached the 100%. To, in 2016, the sentiment became utterly reversed: EK had 100% of positive sentiment while EY had 100% of negative sentiment. On the other hand, QR had a constant decrease of the negative sentiment on the years in analysis. For EK and EY the sentiment of the Ticket Reservation aspect is as volatile as the ticket fares.
33% 33% 67% 67% 50% 100% 33% 33% 67% 33% 33% 33% 100% 50% 100% 67% EK EY QR EK EY QR EK EY QR 2014 2015 2016
Ticket Reservation sentiment distribution for Skytrax Reviews (2014-2016)
34 4.1.9. On-time performance
Figure 11 - Sentiment distribution for the aspect On-time performance on Skytrax Reviews (2014-2016).
On figure 11, is stated the sentiment distribution for On-time performance. EY had the most prominent negative sentiment in all the years, followed by EK. QR was the airline with the highest positive sentiment. Still, all airlines could implement measures in order keep the performance of their flights on time, since their hub-and-spoke strategy and location on the globe making them a vital connector on flights between the East and West, valuing the importance of making on time to connecting flights. Since the sentiment pattern of 2014 is very similar to the one of 2016 could be important to understand the sentiment variation for the following year and if possible invert this trend.
32% 52% 29% 30% 65% 15% 30% 46% 23% 3% 2% 2% 6% 5% 7% 7% 5% 9% 65% 46% 69% 64% 31% 78% 63% 49% 68% EK EY QR EK EY QR EK EY QR 2014 2015 2016
On-time performance sentiment distribution for Skytrax Reviews (2014-2016)
35 4.1.10. Airline Image
Figure 12 - Sentiment distribution for the aspect Airline Image on Skytrax Reviews (2014-2016).
This is related to the awards, PR and advertising aspects of the airlines. These airlines know how to brand themselves all around the world. If not by their identifiable cabin crew, by also their sponsorship of sports events or sports clubs. The positive sentiment is pronounced for airlines such QR when analysing figure 12 which had a constant increase which could be related to the fact that QR was awarded the prize of best Airline of 2014 and 2015, losing the 2016 title to EK. EY has been experiencing an increase on the negative sentiment (even with a drop of 2% in 2016) that could reveal to be problematic for this airline image and how the world sees it when compared with their peer airlines.
31% 31% 19% 36% 46% 18% 34% 44% 6% 7% 10% 2% 12% 7% 1% 3% 9% 3% 63% 59% 79% 52% 46% 81% 64% 47% 91% EK EY QR EK EY QR EK EY QR 2014 2015 2016
Airline Image sentiment distribution for Skytrax Reviews (2014-2016)
36 4.1.11. Seat Comfort
Figure 13 - Sentiment distribution for the aspect Seat Comfort on Skytrax Reviews (2014-2016).
On figure 13, it is shown the sentiment distribution for the aspect Seat Comfort, on which EK had a steady increase in the positive sentiment from 2014 to 2016. QR had a break in 2015 (a variation of less 4%) but caught up in 2016 reaching the 70% of positive sentiment. EY is again the airline with the highest negative sentiment. Even though EY had negative sentiment values that were very close to the 50%, it had a significant decrease in the following year and an increase of 10% on the positive sentiment.
29% 41% 30% 28% 45% 25% 27% 37% 21% 8% 5% 4% 8% 4% 12% 7% 1% 9% 63% 55% 67% 64% 52% 63% 66% 62% 70% EK EY QR EK EY QR EK EY QR 2014 2015 2016
Seat Comfort sentiment distribution for Skytrax Reviews (2014-2016)
37 4.1.12. Ticket Price
Figure 14 - Sentiment distribution for the aspect Ticket price on Skytrax Reviews (2014-2016).
Ticket Price curiously presented a similar sentiment distribution pattern as Ticket Reservation but on the opposite way: while Ticket Reservation aspect had very high negative sentiment, Ticket Price, on the other hand, had a very positive sentiment as stated on figure 14.
QR had in 2014 the year with the most positive sentiment: 100%. While EK only reached 93% in 2015. The higher positive value for EY was in 2016 with 80% of positive sentiment. On the negative sentiment, in 2016 is very low and when comparing with the previous years, it also seems to have experienced a significant decrease.
27% 33% 7% 38% 23% 7% 20% 22% 8% 8% 7% 73% 67% 100% 93% 54% 69% 87% 80% 78% EK EY QR EK EY QR EK EY QR 2014 2015 2016
Ticket price sentiment distribution for Skytrax Reviews (2014-2016)
38 4.1.13. Airport
Figure 15 - Sentiment distribution for the aspect Airport on Skytrax Reviews (2014-2016).
The Airport aspect, positive sentiment has been growing every year, and the overall sentiment for this aspect is positive for every airline except EY in 2014 and 2015 which negative value was very close to the 50%. This tendency reversed in 2016 when EY only had 36% of negative sentiment as mentioned in figure 15. QR and EK have experienced a constant drop in the negative sentiment from 2014 to 2016, and it would be pleasant for this airline to keep with that tendency. 37% 48% 38% 34% 49% 26% 29% 36% 23% 6% 12% 4% 9% 9% 7% 4% 7% 8% 57% 40% 58% 57% 42% 67% 67% 58% 69% EK EY QR EK EY QR EK EY QR 2014 2015 2016
Airport sentiment distribution for Skytrax Reviews (2014-2016)
39
4.2. TRIPADVISOR
Figure 16 - Number of aspect mentions found on TripAdvisor Reviews.
On a general note, TripAdvisor had registered more reviews than Skytrax on the periods in the analysis and by consequence a higher number of mentions as mentioned in figure 16. It also had Quality of the Meal Service as the most mentioned aspect but on TripAdvisor is followed by Aircraft with almost 1200 fewer mentions. For TripAdvisor, even though the Airline section was created more recently than Skytrax’s website, TripAdvisor is renowned for reviews. Also, minus specific than Skytrax by focusing on travel in general than exclusively in air travel.
5370 4180 3919 3846 3603 3443 3207 1785 1271 584 548 251 150
Quality of the Meal Service Aircraft Employees GENERAL Airline Seat comfort Airline Image In-flight Entertainment Airport On-time performance Baggage handling Ticket Price Convenience of Flight Schedule Ticket Reservation
40 4.2.1. Emirates Airline Aspect Negative TripAdvisor Skytrax Neutral TripAdvisor Skytrax Positive TripAdvisor Skytrax
Quality of the Meal Service 12% +8% 3% +5% 85% -12%
Aircraft 12% +15% 4% -1% 83% -14% GENERAL Airline 19% +12% 6% +3% 75% -14% Employees 14% +6% 3% +1% 83% -7% In-flight Entertainment 5% +8% 4% +5% 91% -13% Seat comfort 17% +11% 3% +4% 80% -14% Airline Image 16% +18% 5% -2% 80% -16% Airport 25% +4% 4% 0% 71% -4% On-time performance 30% -1% 7% 0% 62% +1% Baggage handling 40% +18% 3% 0% 57% -19% Ticket Price 23% -16% 2% +5% 75% +12% Convenience of Flight Schedule 32% +18% 3% -3% 65% -15% Ticket Reservation 18% -18% 5% -5% 77% +23%
Table 7 - Sentiment comparison of TripAdvisor with Skytrax sentiment variation for EK in 2016.
When comparing Skytrax and TripAdvisor results for EK on table 7, in 2016 Skytrax reviews have a higher negative sentiment than TripAdvisor reviews, and by consequence, TripAdvisor has a higher positive sentiment. For the neutral, is relatively even for both websites. The only aspects where Skytrax stands out from the TripAdvisor results are on ticket-related aspects such as Ticket Reservation (more 23%) and Ticket Price (more 12%) since the On-time performance only differs by 1%.
Even though TripAdvisor has a very positive sentiment in most aspects, there are some which EK could work on such as Baggage handling, with 40% of negative sentiment, Convenience of Flight Schedule which had 32% of negative sentiment, and On-time performance with 30%. On a more positive note, In-flight Entertainment is undoubtedly the most positive aspect with 91% of positive sentiment, followed by Quality of the Meal Service with 85% and Aircraft and Employees, both with 83%.
41 4.2.2. Etihad Airways Aspect Negative TripAdvisor Skytrax Neutral TripAdvisor Skytrax Positive TripAdvisor Skytrax
Quality of the Meal Service 22% +7% 6% +6% 71% -14%
Employees 21% +5% 4% +4% 76% -8% Aircraft 22% +11% 6% -2% 72% -9% GENERAL Airline 24% +14% 6% +4% 70% -17% Seat comfort 29% +8% 4% -3% 66% -5% Airline Image 28% +17% 5% +4% 68% -21% In-flight Entertainment 10% +3% 7% +5% 84% -8% Airport 35% 0% 8% -1% 57% +1% On-time performance 45% +1% 6% 0% 49% 0% Baggage handling 59% +16% 6% -1% 35% -15% Ticket Price 21% -1% 5% -5% 74% +6% Convenience of Flight Schedule 48% +9% 4% -4% 48% -5% Ticket Reservation 38% +63% 3% -3% 59% -59%
Table 8 - Sentiment comparison of TripAdvisor with Skytrax sentiment variation for EY in 2016.
For EY, the trend is the same as on EK, as specified in table 8. Skytrax registered the higher results on the negative sentiments when comparing with TripAdvisor, and on the positive sentiment, TripAdvisor had the higher percentages. Again, Skytrax stands out on the Ticket Price with 6% more positive sentiment than TripAdvisor.
EY, on TripAdvisor reviews, didn’t have extremely positive sentiment, but some aspects stand out such In-flight Entertainment (with 84%) followed by Employees (with 76%). This airline has room for improvement with Baggage handling registering 59% of negative sentiment, Convenience of Flight Schedule and On-time performance with 48% and 45% respectively.
42 4.2.3. Qatar Airways Aspect Negative TripAdvisor Skytrax Neutral TripAdvisor Skytrax Positive TripAdvisor Skytrax
Quality of the Meal Service 13% +1% 4% +1% 83% -2%
Aircraft 14% +4% 4% 0% 82% -4% Employees 11% -5% 2% +5% 87% -1% GENERAL Airline 18% +3% 5% -2% 78% -1% Seat comfort 19% +2% 5% +4% 76% -6% Airline Image 17% -11% 5% -2% 77% +13% In-flight Entertainment 9% +3% 5% +6% 87% -9% Airport 30% -7% 5% +3% 65% +4% On-time performance 26% -3% 5% +4% 68% 0% Ticket Price 13% +9% 4% -4% 83% -5% Baggage handling 42% -15% 7% -7% 51% +22% Convenience of Flight Schedule 37% +19% 3% -3% 60% -15% Ticket Reservation 22% +11% 4% -4% 73% -7%
Table 9 - Sentiment comparison of TripAdvisor with Skytrax sentiment variation for QR in 2016.
QR registered a more balanced variation when comparing the negative sentiment of Skytrax with TripAdvisor, as stated in table 9. Skytrax had a higher positive sentiment on Baggage handling than TripAdvisor, Airline Image (more 13%) and Airport (more 4% than TripAdvisor). By consequence the aspects mentioned before are also those with the best performance for Skytrax on the negative sentiment, also adding aspects such as Employees (which had less 5% of negative sentiment) and On-time performance which registered less 3% than TripAdvisor on the negative sentiment. On TripAdvisor, In-flight Entertainment and Employees had the higher values of positive sentiment with 87%; a close second was Quality of the Meal Service and Ticket Price both with 83%. On the negative, QR should work on Baggage handling which registered 42% of negative sentiment and Convenience of Flight Schedule with 37%.