Equity Valuation:
Banco Português de Investimento
José Miguel Alves França
Coordinator: Professor José Carlos Tudela Martins
Dissertation Submitted in partial fulfillment of requirements for the degree of International MSC in Finance, at Universidade Católica Portoguesa, September 12th 2014
Abstract
In this dissertation I will expose the process that lead me to give BPI a BUY recommendation for a price target of 1,75€ (against 1,466€ in August 2014). My work adds to the investment community (compared with the BCP report of May 2014) by giving a more detailed and forward-looking valuation. Detailed because I valuate domestic and international activities separately, accounting this way for a higher risk in the latter, but also greater profitability. Forward looking because I value BPI based on the excess return it is expected to generate. Using this approach I penalized BPI in the near future but I captured the long-term opportunities.
Acknowledgments
Being this dissertation the last step of my short journey in Católica-Lisbon, I want to express my gratitude to the people that made it possible: my parents. Second all my dear colleagues for making this journey a pleasant one, I will only name José, Rui and Rui. Also a thank you to Lisa for support.
Regarding this dissertation I need to acknowledge my coordinator, Professor José Tudela, for the guidance and feedback; without him this work could not be finished the way it did.
Executive Summary
The return of the NII
A new chapter has just started for BPI. In August 2014 the bank has already paid back all the borrowed capital to the Portuguese government, has strengthen its financial position, reduced its main risk exposures1 and almost completed its cost-reduction plan.
• BPI is no longer dependent on the developments of the debt crisis. The bank has reduced significantly its exposure to Government debt, holding now €850M (only Portuguese Debt); one third of its exposure in 2012.
• The banks credit structure, based in mortgages loans, made it more resilient to the deterioration of credit quality felt in Portugal. Credit at Risk stands at 5,1%, the lowest in Portugal.
• NII is expected to pick up. On the cost side, the heavy weight of the CoCoʼs2
has been eliminated, and aggressive cost-cutting policy is underway. On the revenue side a new credit structure is expected, with an increase on the corporate side, as investments start to pick up. At the same time we watch a decrease in the deposit yields, as banks are not competing so aggressively for fund
1 The Government debt portfolio is now only one third of 2012 values
2 Contingent convertible bonds subscribed 100% by the Portuguese government in 2012
Recommendation: BUY M€ 2013 2014E 2015E
Price Target (YE14): € 1,75 Total Assets 43 795,10 41 602,60 43 922,63
Upside:
Vs €1,46 19% NII 475,10 513,96 614,21
BPI change (YTD) 63,53% Dividends 0 0 0
PSI20 (YTD) -0,22% Cost credit Risk 1,05% 0,67% 0,76%
PT / Financials -89,72% Net profit 66,9 -12,04 212,69
Table of Contents
The return of the NII ... iii
Part I. Literature Review ... 7
1. Introduction - “All roads lead to Rome” ... 7
1.1. Note on Financial Institutions ... 8
2. Valuation Models - Discount Cash flow ... 9
2.1. Dividend Discount Models ... 10
2.2. Free Cash-Flow to Equity ... 12
2.3. Excess Return Model ... 12
3. Valuation Models - Relative Valuation ... 13
4. Valuation Models - Option Models ... 14
5. Cross-border valuation ... 15
6. The Cost of Equity ... 16
7. Conclusions ... 18
Part II. Banking industry ... 19
1. Banking industry outlook ... 19
1.1.Portugal Case ... 20
1.2. International activity - Angola ... 22
2. Regulations in Portugal and Europe ... 24
2.1. Basel III - Financial Crisis aftermath ... 24
2.2. Transformation Ratios ... 25
2.3. Contingent Convertibles - The CoCoʼs ... 26
2.4. Further stress tests ... 28
Part III. Banco Português de Investimento ... 29
1. Banco Português de Investimento ... 29
2. Activity Indicators ... 30
2.1. Funding ... 30
2.2. Customer deposits ... 31
2.3. Asset-Quality and Loan portfolio ... 33
2.4. Profitability and Performance ... 35
2.5. Operating costs ... 37
2.6. Return on Equity ... 38
Part IV. Valuation ... 39
1. Introduction ... 39
2. Loans, Deposits and NII ... 39
2.1. Loan volumes ... 39
2.2. Deposit volumes ... 41
2.3. Net interest income - the NII ... 42
2.4. International Activities ... 44
3. Financial operations and Commissions ... 45
3.1. Commissions ... 45
3.2. Income from financial Assets ... 45
4. Costs ... 46
5. Pension Liabilities ... 48
Part V. Inputs and Methodology ... 50
2. Inputs to the model ... 50
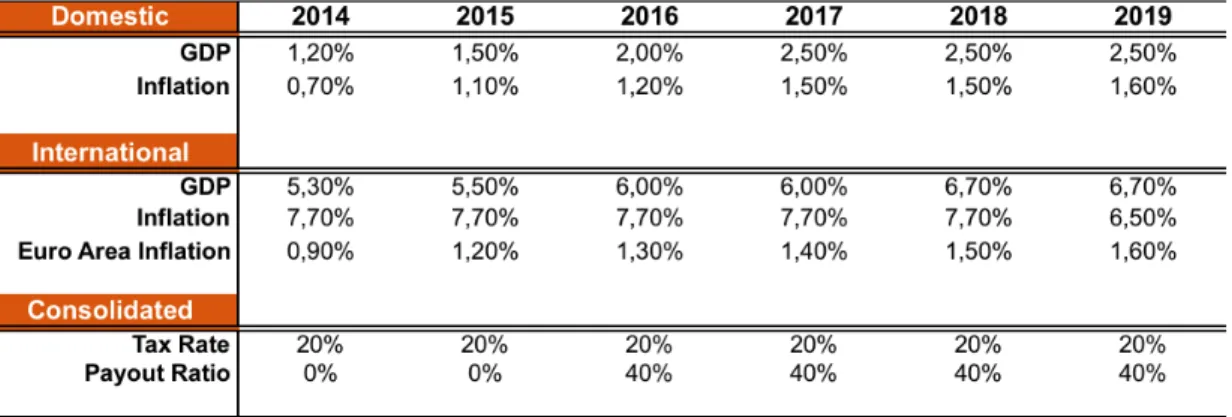
2.1. Macroeconomic future ... 50
2.2. Discount rate and Beta ... 51
2.3. Return on Equity ... 53
2.4. Terminal Value – The valuation menace ... 55
Part VI. Valuation results ... 58
1. Free cash Flow to Equity ... 58
2. Dividend Discount model ... 58
3. Residual Income ... 59
4. Relative valuation ... 60
5. Results Conclusion ... 61
Part VII. Comparison - BCP Millennium Investment Bank ... 63
Part VIII. Annexes ... 66
Part I. Literature Review
1. Introduction - “All roads lead to Rome”
The first myth of equity valuation (Damodaran 2002) is that valuation is objective, since models are quantitative. There are indeed a lot of quantitative models to value a company; they exist due to the importance in todayʼs financial world of finding the ʻvalueʼ of a company. ʻWhat is surprising, (…) is
not the differences in valuation techniques across assets, but the degree of similarity in basic principles.ʼ (Damodaran 2002). All valuation models are based on the underlying assumption that the value of a company needs to be backed up by something real, not just how others price it. Value is backed up by the cash flows that the company is expected to generate in the future; different models just get to these cash flows differently, depending on industry or capital structure or country. What makes valuations subjective are the inputs to the models, the assumptions the analyst makes regarding the future; because the future is uncertain. However, if the assumptions are consistent, the value obtained using different models should be quite similar if not the same; because “all roads lead to Rome” (Holt, W., Nokhasteh, A., Sullivan, P., Young, M. (1999))
Different paths
There are two main ways to get to the value of equity: the first is the direct one, valuating just the equity stake of the company. The second, the indirect, consists in valuing the whole company and later discount everything that is not equity (debt). There are also 3 main different valuation approaches that can be either direct or indirect:
1. Discounted Cash Flow
a. Free Cash Flow to the Firm b. Free Cash Flow to the Equity
c. Dividend Discount Model a. Adjusted Present Value b. Economic value added c. Economic Profit
d. Cash Value Added e. Dynamic ROE 2. Relative valuation a. EV/EBITDA b. EV/Sales c. P/E d. P/BV e. P/CF f. P/Sales
3. Contingent Claim Valuation a. Option theory
This thesis has the objective of valuing a financial institution, Banco Português de Investimento (BPI) therefore, next will be discussed the possible valuation methods for financial institutions.
1.1. Note on Financial Institutions
There are four key particularities in financial institutions that make them a special regarding equity valuation. First Financial institutions operate under regulatory requirements that dictate how much capital they need to have and how to use it (how much can they grow). Second, accounting rules are quite particular, with most of the assets are mark-to market. Third, debt is difficult to define as it is used as a ʻraw materialʼ for the bank to produce loans. Enterprise value for a bank is practically meaningless as it is very difficult to distinguish between debt and raw materials. Also, the principal source of funding is deposits and interbank loans; both will have a very low interest rate that would make the Weighted Cost of Capital (WACC) unrealistically low. Forth, and lastly, is the definition of reinvestment. While a manufacturing
company invests in factories to increase production capacity, a financial institution invests in regulatory capital (increase capital to increase capacity to generate new loans). It will be argued further in this dissertation how a new definition of working capital needs to be made for financial institutions.
2. Valuation Models - Discount Cash flow
This is the group of models more used in practice, it fits perfectly the philosophical description of equity valuation: the value of the company is its expected cash flows it is expected to generate in the future, discounted to the present.
Because it is hard to accurately define debt for a bank, and the WACC would be undervalued, for financial institutions there is the need to use direct valuation methodologies: valuing equity rather than the assets. Damodaran (2009) defines the free cash flow to equity as:
!"## !"#ℎ!"#$ !" !"#$%& !"!#
= !"# !"#$%& − !"# !"#$%"& !"#$%&'()*$
− !ℎ!"#$ !" !"! !"#ℎ !"#$%&' !"#$%"& − (!"#$ !"#$%& − !"# !"#$ !""#!")
(Equation 1)
Filling this equation is not a straightforward exercise when dealing with financial institutions. There is the need to redefine the reinvestment needs, both the capital expenditures (CAPEX) and working capital. In this regard the Damodaran (2009) presents three solutions:
Use dividends as cash flows, by assuming that the company over time pays their free cash flow to equity as dividends. Because they are observable, this approach adds the extra benefit of not facing the question of how much does a firm reinvest. The model is called Dividend Discount Model (DDM) and will
be discussed in the next section (Part I. 2.1.). The second solution is to assume all reinvestment is made in regulatory capital, since this is the one that enables banks to grow larger (make more loans). This is the Free Cash Flow to equity model (FCFE) and will be discussed in Part I. 2.2. In the last section, Part I 2.3. , the focus will be on excess returns, following the Residual Income Model.
2.1. Dividend Discount Models
Dividend Discount Model (DDM) is very simple in their background reasoning: the price of a stock should reflect all the future cash flows that the stock will generate. Those cash flows are the dividends. The analyst needs to assume that all the cash flows to equity investors are paid though dividends, this is not a very damaging assumption but in reality, companies have other instruments to remunerate investors, (like stock buybacks).
The basic model introduced by William (1938):
!"#$% !"# !ℎ!"# = !"#! (1 + !!)! !!! !!! (Equation 2) Where:
!"#! is the dividend at time t
E(.) means the dividend is expected !! is the cost of equity
Because this model simplifies too much reality, making the dividend constant forever, Gordon (1962) upgraded it to allow dividends to grow in the future (at a constant rate).
!"#$% !"# !ℎ!"# = !"#! !!− !
(Equation 3) Where:
This model is more flexible, it can be modified to allow for an extraordinary growth period and only then apply the steady state dividend growth rate.
The DDM is a simple model needing only 3 inputs: Cost of equity (ke), to discount the cash flow, (this input is also used in the FCFE approach and is obtained using the CAPM model discussed ahead). Payout ratio and expected divided growth rate (g), they are connected according to the following equation:
! = 1 − !"#$%& !"#$% ∗ !"#!"#$%& !"#$%!
(Equation 4)
The Return on Equity (ROE) is here critical for the valuation, together with the payout ratio will help determine growth, as two variables imply the third one. It is particularly important for banks as they are required by law to maintain certain capital ratios; the less they pay as dividends the more they can grow. In this sense the assumption on how much will be the steady state ROE is crucial3.
This valuation approach is widely used in financial institutions as their capital structure tends to be constant, (due to regulations), and the dividend yield tends to be fixed by the management. It is also very practical as no calculations need to be made to arrive at the cash flow value.
The main drawback of this method is that dividends may not be linked to value creation. Damodaran (2006) points that firms can holdback more earnings for future investments or the other way around; they can pay the dividend even when they are not able to do so, just for the sake of fulfilling its dividend policy, funding this dividend by issuing more debt or equity.
2.2. Free Cash-Flow to Equity
Banks do not invest like other firms, their reinvestments needs are not in plants nor in inventory, they invest in regulatory capital so they are allowed to grow their asset side according with the applicable law requirements. Thus we
only need to change the Equation 1 to:4
!"## !"#ℎ !"#$ !" !"#$%&!"#$#%"$& !"#$%&'( !" !
= !"# !"#$%& − !"#$%"&'("$' !" !"#$%&'()* !"#$%"& (Equation 5)
To arrive ate a good estimative for the Reinvestment in Regulatory Capital there are two important considerations. First is how conservative is the company? Does it desires to hold the imposed capital? Or in addition hold a buffer. Second is the profitability of the activity, as net profit has a direct impact on the companyʼs equity.
2.3. Excess Return Model
Another way to value firms is to sum the capital currently invested and then add the present value of the excess returns, which the firm is expected to generate on its capital. Because a bank will be valued, instead of valuing the
whole capital it is useful to value directly the equity following this equation:5
!"#$% !" !"#$%&
= !"#$%& !"#$%"& !"#$%&$' !"##$%&'(
+ !"#$#%& !"#$% !" !"#!$%!& !"#$%% !"#$%&' !" !"#$%& !"#$%&'(%
(Equation 6)
With this model the analyst will have not only to how the financial institution will invest in the future but also the returns it will make on those investments.
4 According with Damodaran (2009) 5 According with Damodaran (2009)
The model has two inputs: the equity already invested, and the expected excess returns to equity investors in the future. For the first the book value of equity can be used; bear in mind that this is only true for financial institutions, as the financial assets are marked up to market, (also the depreciation is negligible). The second is the Excess Equity Return, which can be obtained
looking to the ROE and the cost of equity:6
!"#$%% !"#$%& !"#$%&
= !"#$%& !" !"#$%& − !"#$ !" !"#$%& ∗ (!"#$%& !"#$%"& !"#$%&$')
(Equation 7)
Note that the ROE needs to be forward looking for the model to make sense;
a backward looking ROE will not reflect the future return on the equity.7
3. Valuation Models - Relative Valuation
In this kind of model, the companyʼs value is “based upon how similar assets
are currently priced in the market” Damodaran (2002). A multiple is a ratio of
the stock price (Equity value multiple) or the Enterprise value (Firm value multiple) to some value driver (earnings, sales or book value are just three examples). Since in this dissertation a bank will be valued, an Equity value is more appropriate due to the debt-measurement problems that have been already discussed. Damodaran (2009) makes a particular focus on Price-earnings ratio (P/E) and Price to book value (P/BV), being the first dependent on expected growth rate in earnings, the payout ratio and the cost of equity. The second is mostly dependent on return on equity (ROE). Being ROE the most important value driver for financial institutions it is not a surprise that Fernandez (2013) said the P/BV is the most used multiple for banks. This is
6 According to Damodaran (2009)
because a bank will only trade at a P/BV higher than one if it is expected to generate excess return in the future (Equation 7).
One of the biggest advantage of relative valuation is how easy it is to apply, Schreiner (2006) structures four stages: selection of the value driver, selection of the comparable group, building a synthetic multiple and finally applying the value driver of the company to the calculated synthetic multiple.
DCF valuation is the most used and trusted of all valuation techniques, however it has a very important pitfall, the valuation is based in subjective assumptions, “accurately estimating companyʼs cash-flows and choosing the appropriate discount rate are difficult” (Lie & Lie, 2002). Indeed relative valuation is much more straightforward as it does not rely on assumptions, which implies that valuation values should not differ a lot from different analysts. However it still has a subjective input into it, the choice of the peer (comparable) group. Adding the high number of multiples available to use, it is possible that multiple valuations can be easily manipulated; any analyst can get this way to any ʻdesiredʼ value. Fernandez (2013) also points to the fact that multiples have broad dispersion, which implies that they provide a static valuation that is dependent of the market mood at the moment when the valuation is made; this can be seen as a relative value rather than the intrinsic value (which can be obtained using a DCF approach). In this regard Fermandez (2013) also points that multiples should be used as a “second stage of the valuation” so it enables the analyst to “gage the valuation performed and identify differences between the firm valued and the firms it is compared with”.
4. Valuation Models - Option Models
Assets that behave like options need to be priced in a different way than all the others. Option-like assets do not follow the basic rule that the value of the company equals the sum of its discounted cash flows. This is because their
value is dependent in other assets or dependent in the occurrence, or not, of a specific event in the future. Because banks do not behave like an option-like asset this topic with not be further discussed in this dissertation.
5. Cross-border valuation
BPI operates at the moment two in major markets, Portugal and Angola. Being Angola a developing country there are special consideration related to equity valuation that need to be addressed. It is clear that countries with different levels of development need different strategies and investment policies, and for the bankʼs valuation different underlying assumptions.
First there is a different currency and different tax rate, second the timing when to discount the cash flows: when they are earned or then they sent back home. Third the calculation of the WACC, more risks need to be incorporated as political risk. Finally the macroeconomic scenario is different, different growth levels and different regulatory requirements that the bank will face (Kenneth A., and W. Carl Kester 1997).
In addition, for developing countries investors demand being rewarded by the extra risks that may arise due to macroeconomic volatility, political unrest, war or corruption. These risks are not considered in the CAPM, however there are two ways to add them to the valuation (Mimi James and Timothy M. Koller 2000): by incorporating in the actual cash-flows (changing the numerator in the DCF calculation) or adding an extra risk premium to the discount rate (the denominator). The authors argue that the first option is the best since it enable analysts to diversify the risk, as it does not apply in the same way to all industries and most times not even to all companies within and industry. Also finance theory is clear, in the CAPM only non-diversifiable risk is considered (Sharpe (1964), Lintner (1965) and Black (1972)).
6. The Cost of Equity
The cost of equity is one of the most important inputs for most valuation models, (except relative valuation), so it is important to overview how it can be determined. The return on equity that the investor requires reflects the risk that cannot be diversified away, this is measured by a beta, using the Capital Asset Pricing Model (CAPM, Equation 9) or by a number of betas (multi factor model). Even though the CAPM cannot be tested (following Rollʼs critique that the market portfolio cannot be obtained) Fama & French (1996) argue that the existing evident is enough to infer that the CAPM provides bad approximations for beta. However, in the end of the day, practitioners use the CAPM, implying that all rely in its assumptions, and thus agreeing that it is valid.
Following Fama & French (2004), “the market beta for an asset i, is the covariance of its return with the market return divided by the variance of market return”, calculated using the following formula:
!! = !"#(!!, !!) !!
!
(Equation 8)
Where:
!! is the beta of the asset i
!"#(!!, !!) is the convaciance of the returns !!
! is the variance of the markets returns
CAPM:
!! = !!+ !!(!!− !!)
(Equation 9) Where:
!! is the risk-free rate
Damodaran (2002) argues there are 3 ways to estimate the Beta: Historical Betas (same approach as Fama French (2004) described above), estimated from Fundamental characteristic of the investment or use accounting betas. To estimate Historical betas one need to regress the historical returns of the investment against a benchmark market portfolio and take the beta (Equation 8). There are however a multitude of ways to do that, first the choice of estimation period. Here one needs to evaluate the trade-off between quantity of data and noise; also the company in question may change its risk structure if the estimation period is too long. Second the return interval, which faces a similar problem as the estimation period. Third the choice of market index, this choice should not be only based on where the company is based, (choosing this way the national index), but where this company operates.
However, the cost of equity in a far too important input to discount cash flow models to used noisy and skewed estimations of betas. Damodaran argues that a better way to estimate betas is using firm fundamentals: the type of business they are in and their degree of leverage (operating and financial). In the fundament approach business risk is separated from leverage risk by calculating first the Unleveraged Beta (also called Asset beta) that is determined by the kind of assets the company uses, and then the leveraged (or equity) beta that reflects both the Risk of the business and the firm-specific leverage risk; which will be the one eventually used for the CAPM model.
To get the unleveraged Beta first it the activity of the firm must be defined. If the company has more than one activity the beta will be the weighted, (by the importance of that segment to the companyʼs value), averaged of the betas from each activity. To get the beta for each activity simply use the historical approach defined above for all the comparable companies in the industry. The final step for the beta then is to make a normal average, betas obtained this way are called ʻBottoms-upʼ. The error results in an average are far more precise than the individual errors; also this approach can be adapted for a
change is structure in the companyʼs business mix, (by changing the weights on the final average).
Damodaran (2009) points that for financial institutions beta does not need to be adjusted for financial leverage. The average levered beta for comparable firms is used as a bottoms-up beta for the company to be valued.
7. Conclusions
Financial institutions do not have one particular valuation method that fits them the best; normal methods just need to be molded to fit its requirements. Thus, for the valuation of BPI four methods will be used: FCFE, DDM, relative valuation and Excess Return. The final value will be chosen after analyzing how the models allow the assumptions about the future to be incorporated in the valuation.
Part II. Banking industry
1. Banking industry outlook
The global economy is just now showing signs of strengthening with advanced economies growing slowly still. In 2013 global output grew 3%, advanced economies 1,3%, while the Eurozone has contracted 0,5% (WEO IMF estimates). The growth in developing economies was hurt by the low demand from developed ones. This is expected to change in 2014 with the US in the center of the trend, as its private demand continues to grow driven by the recovery of the labor market (Graph 1).
Graph 1. Unemployment rates (IMF)
Only politics are still causing some degree of uncertainty, mainly due to the US as the debate over the shift in the financial policy by the Federal Reserve is intensifying. It is expected to generate volatility in the long rates, as the reduction of liquidity not only affects the US (which saw its 10-y treasuries yields increase from 1.758% to 3.029% in 2013) but also the rest of the world. Primarily the emerging markets but also Europe, even if in a lower extent as the ECB is keen on letting the markets know its principal refinancing rate and the deposit-placing facility rate will stay at historically lows.
Graph 2. ECB interest rates (EBC data)
By doing this, the ECB is trying to boost confidence levels, private demand,
investment and ultimately inflation to normal values8.
A deleveraging effort of the peripheral countries, which has been caused by the financial crisis, is still underway, as does a risk aversion environment that blocks the banks from financing the private sector, and the private sector itself to invest. Southern countries are still struggling; their domestic demand is still depressed, with unemployment still to peak in 2014 (Graph 1).
However signs of recovery can be noted, particularly in central countries, where a “change in mood” (IMF WEO of October 2013) can be noted as the private sector starts to increase demand.
1.1.Portugal Case
Portuguese discipline in implementing the measures agreed with Troika (IMF/ECB/EC) was the main constrain for the national economy. These measures were agreed back in 2011, following the 78B€ economic and financial assistance plan. All the austerity measures kept internal demand low, due to cuts in public spending and tax increases, joined with poor external demand, particularly by European countries (70% of the export markets), resulted in a contraction of GDP, (Graph 3.), and a degradation of the labor market, with unemployment still expected to peak at 17.7%1IMF in the end of 2014 (Graph 1).
8 Close to, but not reaching 2%
Graph 3. Portuguese GDP evolution (IMF)
As a consequence, significant progress was made in stabilizing the budget, having for the first time a positive structural balance in several decades (note that in 2010 the deficit reached 6% of the GDP). This, aligned with looser financial credit restrains in the European market, (Graph 2.), made Portugal look less risky to the markets, and thus the Portuguese banking sector.
Indeed, the Portuguese government and two9 domestic banks already used
the international wholesale debt market for financing.
The Portuguese budgetary consolidation, aligned with the new ECB function of supervising European banks, gave a very positive signal to the markets, making Portuguese debt attractive to investors, which made 10-year yields fell bellow 4% (Graph 4.), the lowest since August 2010, in March 2014; closing this way the high spreads Portugal was paying over Germany.
Expectations are for the yields to continue to decrease, in a moment when the hunt for high yields is increasing due to ECBʼs negative interest rate policy. This conditions enabled Portugal a ʻclean exitʼ from its three-year rescue program; emulating this way Ireland. The Government debt evolution is very important for the Portuguese banks as they have a high exposure to it, which was fuelled by the ECBʼs decision to allow them to be used as collateral for refinancing purposes.
Graph 4. European 10y Government debt yields
1.2. International activity - Angola
Angola enjoyed a period of very high economic growth after the civil war ended in 2002, with Real GDP growth levels above 20% between 2005 and 2007. This economic evolution ended in 2008 (Graph 5) when the global financial crisis made oil prices fall abruptly.
Angolan economy is highly exposed to oil prices, indeed, 45% of the GDP comes from oil (down from 47% the year before), being it also responsible for
95% of the exports and 75% of the public income10.
Graph 6. Composition of Angola GDP10
There is however at the moment an effort to reduce this dependence, with government investments in the services sector. Indeed Angola dependence in the oil sector is quite worrying; the country has a stable oil production regarding volumes, making the countryʼs GDP very correlated with oil prices. Still the IMF expects an average real GDP growth of 5,9% for this economy in the next years, which is the average growth since 1990 (Graph 6).
Regarding the Financial sector
Angola still has a low banking services penetration, around 23% in the beginning of 201311; indication that there is a lot of potential to grow. The structure of the sector is quite concentrated; the biggest 5 banks detain 78% of total assets, which may explain why the number of banks has remained unchanged in the last years. This highly competitive environment leads to banks to grow in size, indeed, the number of branches has been increasing year after year, so does the use of ATMs and electronic cards and Internet banking.
10 BPI report on Angola’s Economy, December 2013
BPI operates in Angola though BFA, it is focused in costumer deposits gathering, where 98% of the funding comes from (also 22% of all the BPI group customer resources). The loan portfolio however is quite shy, representing only 4% of the groupʼs gross loan portfolio. The bankʼs transformation ratio is around 20% not only well below the Portuguese counterpart but also well below the Angolan average of 62,7% in the end of 2012.
Looking forward it is expected that loans continue to grow and thus the transformation rations. The Banco Nacional de Angola, has being providing liquidity to the market by reducing the cost of lending and at the same time reducing the liquidity absorption interest rate, this is to motivate banks to lend to the private sector.
2. Regulations in Portugal and Europe
2.1. Basel III - Financial Crisis aftermath
The 2008 financial crisis exposed how insufficient banking regulation was at that point, both at European and global level. The excessive growth in credit, before the downturn in the markets, caused such a large quantity of losses that overwhelmed the capital financial institutions had reserved, following Basel I and II accords. The problem was not only base capital quantity, but also capital quality (availability, liquidity management and corporate governance also played their role). Governments had to rescue failing financial institutions in order to restore the financial sector (and thus the whole economy) stability and confidence. In this regard, the Basel Committee on Banking Supervision (BCBS) issued in December 2010 detailed new rules on capital and liquidity requirements (Basel III).
Table 1. Key Basel II and III rules
Because Basel III are only standards, the EU implements it to all European banks though a Regulation, Capital Requirements Regulation (CRR) and a Directive, Capital Requirement Directive, (CRD-IV).
This regulatory framework will put banks in a stronger position to absorb abnormally high market shocks by demanding better and more capital, more focused this time in common equity. Even though total capital required will still be 8% (10,5% after 2019 adding a conservation Buffer of 2,5%) of risk weighted assets (as in Basel II), the amount that has to be of the highest quality, common equity tier 1, CET1 increases 2,5 percentage points to 4,5%. A leverage backstop to prevent the accumulation of credit, a counter party credit risk, capital buffers and a more intense liquidity management are also required. The application of these new legislations started in 1 January 2013 and is schedule to be fully implemented on 1 January 2019.
2.2. Transformation Ratios
A further imposition by the BoP was that until 2014 all the Portuguese banks must have a Loan-to-Deposit (LtD) ratio of no more than 120% to ensure liquidity in the market, which lead banks to a deleveraging of their portfolios. They could accomplish this by attracting deposits; however they were limited by a maximum remuneration rate imposed in 2011 by the BoP. This way corporate credit was the segment that was hurt the most as banks have limited power to reduce mortgage loans. Indeed BPI managed to sustain customer resources while reducing corporate credit from 8.7B€ in 2009 to
5.3B€ in 2012, achieving this way a LtD ratio of 101% in June 2013 (less than 100% now, Graph 7). Only other Portuguese banks have already reduced their LtD ratio below the maximum threshold of 120%, CGD (with a LtD ratio of 107.5% in 2012).
Graph 7. Transformation ratios in Portugal
This means that BPI has little dependence in the debt market; so BPI has the incentive to take a more aggressive position in credit granting as soon as the economy shows signs of strengthening. Aligning this with rising credit spreads, BPI has here a unique opportunity to increase its profitability.
2.3. Contingent Convertibles - The CoCoʼs
After 30 June 2012 the European Banking Authority (EBA) required a minimum common capital ratio (CET1) of 9% after a stress test to Portuguese banks. This recommendation also included a capital buffer for exposure to
sovereign debt calculated at 30th September 2011 market prices. BPIʼs
exposure to southern Europe sovereign debt, particularly Greek and Portuguese, was the main reason for a capital shortfall that made the financial institution carry out a recapitalization plan. That buffer is currently outdated, because both Portuguese yields have improved and the exposure to Greek debt exposure was eliminated. Still the bank had to hold the buffer until EBAʼs reevaluation (expected at the end of 2014). If this buffer was updated as of
24th January 2014 prices, the value would decrease 877M€3 (BPI press release 30Jan 2014 OPORTO).
The capital shortfall that amounted up to 1,359B€ could not be dealt using only private solutions due to the lack of confidence prevailing in the markets at the time. Thus BPI was forced to reach to the 12B€ recapitalization facility that Troika (ECB, IMF and EC) made available to the Portuguese banks, within the scope of the adjustment program, negotiated with the Portuguese government. BPI raised 200M€ in a capital issue and 1,5B€ issuing convertible bonds (CoCoʼs), which were subscribed by the government. They cost the bank dearly, having an effective interest rate of 8.75% (increasing every year). This rate is expensive when compared with 7.125% that the Portuguese bank BES could get in the wholesale debt market in the beginning of 2014.
BPI managed to payback all the CoCosʼ in the first half of 2014, well before the deadline. The ability for BPI to repay the CoCoʼs before the expected date was very important, it wont penalize the future growth of Net Interest Income. Just in 2013 alone CoCoʼs had a 85M€ negative impact in the Net Profit.
2.4. Further stress tests
This year banks will face new Asset Quality Review by the ECB, these reviews are expected to be particularly challenging because the ECB will assume supervisor responsibilities as of November 2014. ECBʼs new responsibilities may make the tests over demanding, since the Central bank is keen in minimize future problems by reducing the risks in the banks balance sheets.
In the Portuguese case the Bank of Portugal and Troika (EC, IMF and ECB) have already made several inspections, at least to the Portuguese bankʼs loan book, which makes future need for loans provisions less likely.
Part III. Banco Português de Investimento
1. Banco Português de Investimento
Banco Português de Investimento (BPI) is a financial multi-specialist group based in Porto, Portugal. It was conceived in 1981 under the name “Sociedade Portuguesa de Investimentos”, having at this stage the specific purpose of participating in the creation of a dynamic capital market, with the final objective of financing private-sector investment projects. Only 4 years later it was renamed “Banco Português de Investimento” (BPI) and transformed into a commercial and investment bank. It now has around 2.9 billion costumers (1.7B and 1.2B in Portugal and Angola respectively), offering a wide range of financial services in Portugal and internationally, in Angola
and Mozambique. It is the 3th largest financial institution in Portugal, quoted in
Lisbon-Euronext stock market with a market cap of 2.3B€1 MAY 2014 and
weighting 2,03% in PSI-20 (the Portuguese stock index). BPIʼs Assets as of June 2014 were 45Bi€, this was made possible by a number o acquisitions, organic growth and expansion to multinational markets (graph 9).
Domestic activities are the core business of BPI with 82,9% of the capital allocated to it, being 80,6% for commercial banking and only the remaining 2,3% for financial investments. Internationally BPI holds a leadership position in Angola though Banco de Fomento (BFA) (50,1% owned) with market shares of 10.9% in loans and 16.2% in deposits. In Mozambique BPI focus on retail banking operating though Banco Comercial e de Investimentos (BCI) (30% owned), with market shares of 28.6% for deposits and 29.1% for loans.
Graph 10. BPIʼs business and financial profile:
2. Activity Indicators
2.1. Funding
Since April 2010 and until very recently, the wholesale debt market was closed to Portuguese banks, as the successive credit downgrades to Portuguese sovereign debt dragged down Portuguese bankʼs credit ratings as well (Graph 11).
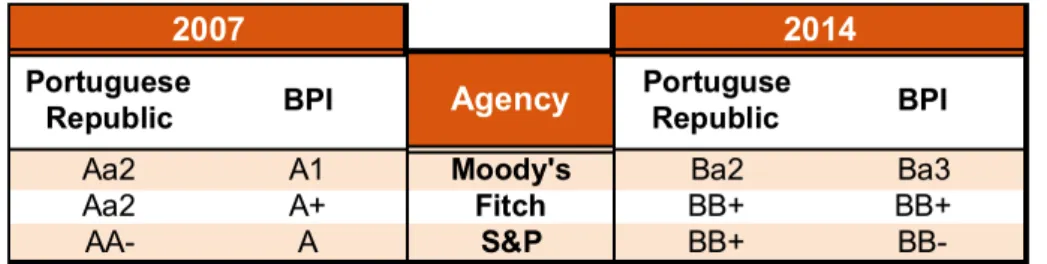
Table 2. BPIʼs credit ratings
In this scenario the ECB stepped in with the function of lender of last resort, in which Portuguese banks relied heavily, reaching a peak of 60.5B€ in June 2012. BPI is the Portuguese bank that is relying the less in ECBʼs funding; both in relative and absolute terms using 4.1B€ or 7,9% of the total 51,8B€. The bank has as well very little medium and long-term debt refinancing needs, as all the debt until 2017 is covered by the remaining available ECB collateral. These low refinancing needs were made possible though a deleveraging strategy, while maintaining stable customer resources.
After this period, is it expected that BPI will be in a strong position to access the debt markets. First, the hybrid bonds have already been paid back to the government. Second the yields in Portuguese debt are falling, and are expected to continue. Third, already two Portuguese banks have successfully issued debt to the markets in 4Q13.
Additionally, one interesting note to take from Table 2 is that one of the three agencies already classifies BPI debt as risky as the Portuguese one, which just reflects the solid financial situation of the bank.
2.2. Customer deposits
More than half of BPIʼs funding came from deposits (graph 11); they have increased significantly since 1Q10 from 17,5B€ to close to 19,5B€ in 1Q12, year when they suffered a decrease to 18,5B€. The attraction of new deposits was of key importance as other funding solutions, rather than the ECB, were limited due to adverse macroeconomic conditions. However during the last year deposits have recovered some of their losses; households deposits grew
1,1% and non-financial companies 2%12. This increase is noteworthy because rates on deposits have been decreasing since 2011 after the penalty on capital that the BoP imposed to new deposits with rates above 2,54% until 3M, 2,89% until 6M and 3,56% for 12M and more. This implies that something other than returns is behind the increase in deposits. The households higher saving rates may reflect precautionary motives and a change in consumer pattern12.
The mutual fund industry may also have something to say in the evolution of deposits, as trust in financial markets was at historical lows (getting better now), a risk averse environment is predominant and a run away to more conservative capital allocation solutions has been the rule.
Looking forward, as these non-recurring situations fade away, bank deposits may become uncompetitive when compared to other asset class particularly Portuguese government debt.
Graph 11. BPIʼs Resources (M€)
12 Half year 2013 BPI report
2.3. Asset-Quality and Loan portfolio
After entering in the Eurozone, Portugal benefited from historical low interest rates and thus an easy access to the credit market. Households, corporate and even the government overused the loose financial conditions, making credit growth way superior to GDP growth, which is simply unbearable in the long term. Indeed after the 2008 financial crisis credit growth declined sharply being now negative.
Graph 12. Portuguese Government Credit13 Vs GDP
In 2012, indebtedness as a percentage of the GDP was 124,1% (almost double of the European average) for the government and 223% for the private sector (the European average is 156,6%).
In the years after the financial crisis, the deterioration of the macroeconomic environment caused a sharp reduction in the available income, this lead to the increase of Non-performing Loans in the banking sector. Not every sector was affected the same way, being the most affected consumer loans as they depend mostly in unemployment and disposable income. The least affected segment was mortgages; they depend more in housing prices, future income and interest rates, which have been at historical lows. The corporate sector is in a middle term, they are not as dependent in the economy as the consumer
segment, still they have been suffering from companiesʼ decreasing profitability that may prevent them to make the loan repayments.
BPIʼs credit portfolio, which is mainly domestic (96%), is 46% mortgages and 40% corporate debt, with only 10% consumption.
Graph 13. BPIʼs domestic credit portfolio breakdown
This portfolio structure helped BPI maintaining a low Non-Performing Loan Ratio (NPL) of 5% (in 2013) compared with Ratios above 10% for the other two large financial institutions in Portugal (BES and BCP).
Graph 14. BPIʼs Non-performing loans (% loan portfolio)
Looking ahead it is expected that the Asset quality will stop decreasing however not instantly. Even though its expected that the 2014 Portuguese GDP evolution to be positive, there is normally a lag of 3 quarters until for the positive macroeconomic signals to have an effect in the credit portfolio, thus it is expected that the negative trend will end in the last quarter of 2014.
2.4. Profitability and Performance
Profitability in all Portuguese Financial institutions has being challenged by the poor macroeconomic environment, more noticeably by the decrease in Net Interest Income (NII). It came under stress due to the deleveraging impositions made by the BoP and the increase in credit provisions and impairments; caused by the deterioration of asset quality. BPI has, however, been the most resilience to the adverse environment of all the Portuguese banks, due to the mortgage-based structure of the credit portfolio and the good performance of its international operations.
Graph 14. BPIʼs Net Interest Income and Net Profit (M€)
BPIʼs Group Net Profit in 2013 was 66.8M€, 182,3M€ less than in 2012. Domestically, in 2013, the contribution to the consolidated net income was negative, which can be explained first by the decrease in the NII and secondly by a decrease in profit from financial operations.
As for the NII, the biggest challenge was the higher CoCoʼs cost that amounted to 85M€ in 2013 (from 56M€ in 2012). Also the increasing costs to attract customer resources combined with a low Euribor (as most loans rates are defined as a spread over it) created a contraction in the average margin on sight deposits. Finally the sale of a portfolio of Portuguese Bonds with high yield that generated in 2012 76M€ in interest income and only 2M€ in 2013.
Net Commissions decreased by 9% due to the reduction of corporate bounds issues. Since the financial crisis this source of income as been below the
normal as a risk-averse environment prevails and costumers prefer
on-balance sheet assets rather then off-on-balance sheet, which also makes commissions related to credit to consumption lower (like credit cards).
Results from financial operations are the most volatile, depending in the composition of the financial assets portfolio, which in BPIʼs case is 82% composed of Southern European countries debt, and how their price varies in the market.
Graph 15. BPIʼs Gains or Losses from financial operations (M€)
The 171,6M€ in income generated in 2013 is mostly due to the liquidation of Treasury bonds acquired in 2012.
Looking ahead its foreseeable that BPIʼs profitability will improve. First credit spreads have already started to improve, as banks will stop competing to attract costumers and loans are being reprised; this adjustment will take more time to BPI as its credit portfolio structure is more long-term (mortgages). It is also important to notice that BPIʼs LtD ratio is below 100% (well below the imposed 120%) so the bank has some slack to increase its loan portfolio as soon as credit spreads start to pick up. Non Performing Loans (NPL) are still to peak as employment rate is expected to grow still this year (Graph 1), but will start to recover after that. As for commissions, a positive evolution is expected as the macroeconomic environment is showing signs of recovery,
the high-risk-averse environment is fading away and new products are being placed in the market. The trading income is mostly dependent in the evolution of the south European debt yields, which even though they are also expected to have a positive evolution BPI has decided to follow a conservative approach and reduce to half its position.
2.5. Operating costs
BPI has an efficiency ratio14 quite high compared with other important
Portuguese banks.
Graph 16. BPIʼs Efficiency Ratio14
This implies that BPI still has space for improvement. Indeed, included in BPIʼs recapitalization plan there are a group of measures aimed at reducing the bankʼs operating costs. The most significant ones due to its weight on the P&L of the bank are: reducing the number of employees to 6000 by 2015, (a 363 reduction) and closing 21 branches by 2014.
2.6. Return on Equity
After the financial crash in 2008 all major banks have seen their profitability plunge. This is quite clear when looking to BPIʼs ROE, with a value of 24,7% in 2007 and only 2,9% in 2013. This was mainly due to the big decrease in net income (around 58%) in 2008 that hasnʼt pick up yet. It is however interesting to look at only international figures, where the ROE has been significantly higher during the whole period (2007-2013). Looking forward, as the net income is expected to rise, the ROE will improve even if not to the 2007 levels.
Part IV. Valuation
1. Introduction
I will first expose the reasoning behind the key drivers of the balance sheet and the P&L for the bank. Once a clear understanding of how the bankʼs balance sheet and P&L will look like in the future I will breakdown the most important inputs used for the different models. Finally I am going to compare the results I obtained using different models and arrive at the value of BPIʼs equity.
2. Loans, Deposits and NII
2.1. Loan volumes
Loans to customers are the most important component of BPIʼs Asset base, (between 60 and 70%, Graph 18.), it is important thus, to understand why Loans have been decreasing since 2010 and why 2014 will be the turning point.
As in Part II, the Portuguese financial system went through a deleveraging effort, as the Bank of Portugal imposed new rules regarding Loan-to-deposit ratios. Since resources were difficult to obtain, due to the lack of liquidity in the markets following the financial crisis, BPI (and all the other financial institutions in Portugal) needed to reduce its Loan portfolio. BPI started with a Loan-to-deposit ratio of 136% (calculated in accordance with Bank of Portugal Instruction 23/2011), Graph 19, and reached a ratio of 92% in January 2014.
Graph 19. BPIʼs LtD ratio
This was possible because BPI was able to maintain the customer base; which was a difficult exercise, as deposits where in short of supply for all the demand in the banking sector. Indeed competition over interest rates on deposits was so fierce that the BoP imposed a celling (penalization over a certain rate). Another factor that helped the bank reach this ratio was the significant decrease in financing to the public sector that between 2012 and 2013 decreased 27%, while to non-financial companies only decreased 6,6% (-8,4% to customer loans).
However volumes are expected to pick up after 2014, supported by the recovery of the Portuguese economy (mostly backed by exports). BPI is in an exceptional position to benefit from this shift in economic environment, as it has LtD ratios well below the 120% imposed, being this way in a position to expand when desired.
Thus, loans are expected to increase with the bankʼs new appetite, supported by a new credit mix and the improvement (see 2.3 - NII below) in the Portuguese GDP.
2.2. Deposit volumes
Since 2009 following the financial crisis, and most significantly the South-European sovereign crisis, resources were very difficult (and pricy) to obtain as the financial markets closed up for the Portuguese government and thus to Portuguese banks. To face this imposed restriction financial institutions in Portugal turned to customer deposits at a time when the national GDP was contracting savings were not easily available, which created such a rate war between banks, in order to attract the few savings available, that the bank of Portugal needed to intervene, imposing restrictions on deposit yields. So in order to maintain deposits BPI sacrificed profitability increasing its deposits Yields.
Graph 19. BPIʼs Liabilities and total deposits
I believed that 2014 is also the turning point for deposits, as in May the Portuguese government announced the exit from the EU-IMF program, the markets have returned the confidence to the Portuguese banking system. This
enabled not only the government (that is already borrowing at rates below 4%
but also Portuguese15 banks to access the financial markets.
There are thus two forces moving customer deposits now: first the lesser need from banks to attract them (and thus a foreseeable reduction in yields) and the availability of more attractive ways to invest savings (also a shift in risk appetite), as other asset classes will become more attractive (government debt being on the top of the list). For deposits I expect an increase following GDP as more disposable income became available.
2.3. Net interest income - the NII
Net interest income has been under pressure in the last years for the whole market of commercial banking in Europe; BPI was no exception. For BPI volume wise, credits have been falling while deposits have remained constant. In past years, deposit yields have come up while credit spreads have already reached a maximum over the historically low EURIBOR that is why the need for a more aggressive credit strategy is required.
On the cost side the high cost with the CoCoʼs has alone penalized 167,7M€ since 2012; that is one of the reasons why BPI was so keen on paying back the government as fast as possible.
Looking forward, a NII recovery is expected: first the CoCoʼs have been fully reimbursed; second the Portuguese economy is picking up again showing positive growth still in 2014. Third, and most importantly, a new credit structure is expected (more corporate). BPIʼs focused on mortgage loans have made the bank more resilient to the macroeconomic downturn, it has also made the recovery longer as this kind of credit takes more time in the re-pricing process. A shift to a more corporate structure may come naturally, not only as a result of a change in policy as the new number of mortgages is lower than the amount being paid. The demand for loans by the corporate sector will surpass the demand by individuals as the risk mentality shifts and the economy is able to absolve higher investment levels (Graph 20).
Graph 20. Total Investment in Portugal16
Graph 21. BPIʼs term deposit spread and 3M Euribor Rate17
According to DG ECFINʼs 18 estimates, the saving rates (for households),
which was 12.6% in 2013, will be 11.6% for 2014 and 12% for 2015, while investment (Gross fixed capital formation) was -6.6% in 2013 with estimates of 3.3% and 3.8% for 2014 and 2015 (Graph 20). From Graph 21 a shift can
16 Total gross capital formation as a percentage of national GDP 17 Both graph taken from BPI 2013 Report
be seen both in deposit spreads and in the Euribor19; while the former rates started to decrease the former start to increase.
In Table 3 (below) I display my expectations for both credit and loan yields as well as the calculated NII for Domestic activities.
Table 3. NII calculations for Domestic activities
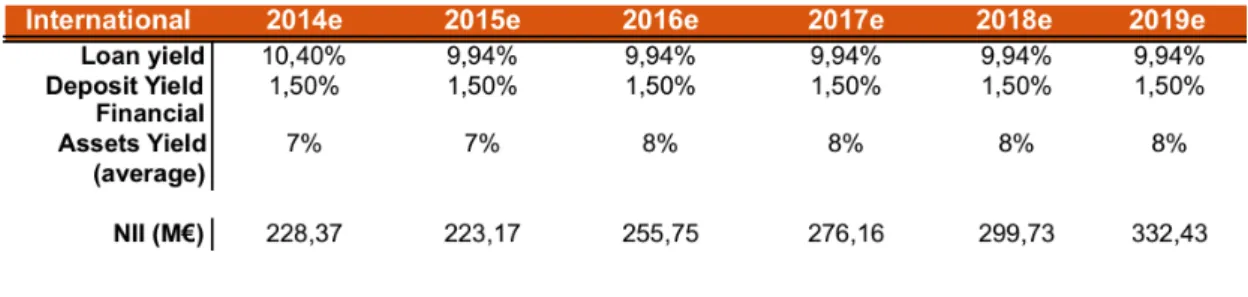
2.4. International Activities
International activities, particularly in Angola, have been supporting BPIʼs earnings, with a net profit of 95,5M€ against a net loss of 28,3M€ for Portugal in 2013. Customer resources have increases systematically as banking penetration in Angola becomes widely spread. BPIʼs international activity have LtD ratios in the order of 20%, which is less than one third of the average in Angola.
Looking forward I expect this ratio to increase. In Angola the government is making efforts to make the economy less reliant on the oil sector by making big investments, trying to boast the rest of the economy. A higher demand for loans is thus expected.
Table 4. NII calculations for International activities
3. Financial operations and Commissions
3.1. Commissions
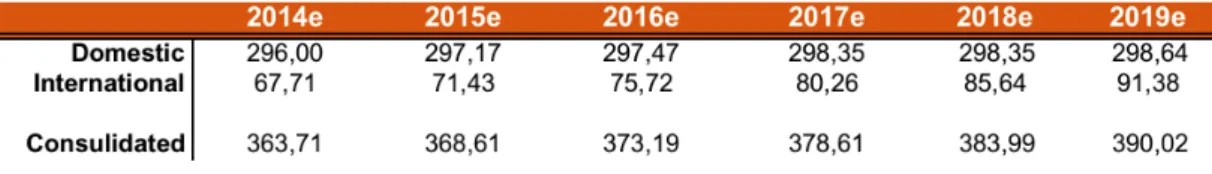
This is a very significant source of income for BPIʼs activities, particularly domestic ones (around 30% of Net operating income). The most significant component is Banking Services followed by Insurance Brokerage (73% and 12,5% respectfully in 2013). Commission income does not present a lot of volatility neither in domestic nor international activities. Because the main component is Banking Services, that include such services as bond placements and banking brokerage, it is expected that this income will growth with the economy, as the corporate sector gets ready to grow again, associated financial services should grow comparably. The table below shows expected commissions for both domestic and international activities, growing with GDP after 2014.
Table 5. Commission Income calculations (M€)
3.2. Income from financial Assets
This source of income is very different between Domestic and International activities. In Portugal it is very volatile; in the last years this can be explained not only by the big exposure to south-European government debt, but also by the extensive use of derivatives (to protect the bank against interest rates movements). Indeed in the first half of 2014 a loss of 102 M€ after taxes was register due to the sale, in April, of half the position on long-term Portuguese and Italian debt (850M€ and 487,5M€ respectfully). The sale itself originated a profit of 64M€, the position on related swaps caused the loss.
This sale was made reflecting a more cautionary attitude of the bank regarding the future, as, following Basel III rules, since 1st January 2014 the potential losses associated with government debt will be reflected, at market prices, in the CET 1 ratio. This would imply that a flotation in prices could lead the bank to need again an increase of capital, even if the debt was actually repaid at maturity.
Regarding international activities the income tends to be more stable due to a different exposition that does not suffer with the volatilities of European markets.
Looking forward, the expected future financial assets income will reflect a more conservative attitude in Portugal and a steady increase (with the economy) in international activities (Table 6).
Table 6. Income from financial assets calculations
4. Costs
Under BPIʼs restructuring plan the DG COMP20 imposed three quantitative
measures that BPI needed to comply until 2015. Two of them were already completed in the first half of 2014: the closure of 50 commercial units in Portugal, and the reduction of core assets by 700M€, which was easy to comply since the Loan portfolio, was decreasing anyway. The third was the reduction of headcount to 6.000 employees, which means that BPI needed to let go 363 employees. The president guaranteed that this would not be accomplished by massive collective terminations, indeed, BPI had already in implementation early retirement programs that accounted for 90 employees, but BPI still misses a further 166 (in the first half of 2014) to reach the 2015 goal.
20 European commission for competition
Having this in consideration, the expected personal costs have been calculated expecting the restructuring plan agreed with DG COMP would be honored until 2015. In the near future, BPI is expected to maintain them constant, growing only with inflation (Table 7).
Table 7. Costs with personal calculations (M€)
The opposite is expected of international activities; customer base and distribution networks have been expanding since 2008 (Graph 22). BPI is committed to strengthen its activities both in Angola and Mozambique, where, at the moment, most of the profit comes from. Angola has a very concentrated banking market, which makes investment in growth crucial to survive the competition. I will assume the current trend is going to continue.
Graph 22. Employees, Customer Base and Distribution Network overseas21
Regarding ʻOutsider Suppliers and Servicesʼ, its value as a percentage of Operating Revenue have been stable in the last years, and it is expected to remain the same.
Regarding international activities, personal costs are expected to increase with GDP following the desire of BPI to invest in its international operations, and the costs regarding outside suppliers were calculated the same way as for Domestic activities.
5. Pension Liabilities
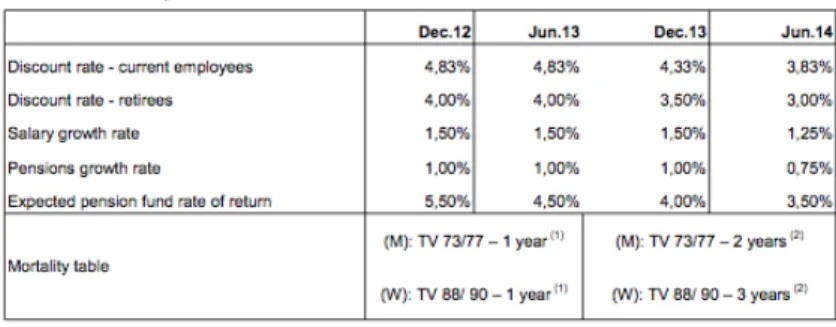
Pension Liabilities are an additional source of risk for any bank. Since 2011 Actuarial losses or gains ceased to be resisted on the balance sheet under assets or liabilities to be registered directly on Shareholders equity under the banner ʻOther Comprehensive Incomeʼ. Following Basel III full implementation rules, banks will need to adjust regulatory capital for actuarial differences. This could be potentially alarming since the size of the pension fund is more than 50% of the total market capitalization of BPI.
The used discount rates for the pensions were 4,5% in 2013 and expected to decrease to below 4% in 2014; Table 8 was extracted from BPIʼs 2013 Annual Report:
Table 8. Actuarial Assumptions (BPI 2013 Annual Report)
However, the average annual returns from the funds, of around 16% last year, and with an average of 9,1% since inception, creates a confortable positive actuarial income capable of absorbing actuarial losses from changes in assumptions (Graph 23). Furthermore, BPI has a ʻPrudential Corridorʼ that stands at 112M€ in 2013. This buffer was able to absolve accumulated