COMPARATIVE STUDY OF DIFFERENT NUMERICAL METHODOLOGIES
FOR THE CICLIC BEHAVIOR OF RC MEMBERS: EXPERIMENTAL
VALIDATION
N. Vila-Pouca
1, A. Arêde
1, A. Monteiro
1, P. Delgado
2, P. Rocha
2, J. Guedes
1, A. Costa
3and R. Delgado
11
Faculty of Engineering of the University of Porto, Portugal
2
Polytechnic Institute, Viana do Castelo, Portugal
3
University of Aveiro, Portugal
ABSTRACT :
This work mainly aims at a comparative study between several numerical methods for non-linear cyclic behavior simulation of reinforced concrete members, namely the continuum damage, the fiber and the concentrated plastic hinge models, in order to establish the applicability of each numerical tool. The damage model is based on 2D or 3D finite element representations, adopting two scalar damage variables for the simulation of non-linear concrete degradation mechanisms under tension and compression, and using the well known Giuffré-Menegotto-Pinto model to simulate the cyclic behavior of steel. The well known fiber model, computationally lighter than the previous one, resorts to 1D constitutive laws for both concrete and steel to simulate the non-linearity of fibers. Finally, the lightest model herein considered is the concentrated plastic hinge model: it is essentially a global element model for RC members, such that each is represented by an elastic central zone plus two finite-length plastic end-zones where non-linear behavior is simulated through cross-section level Takeda type moment-curvature global laws. The study was performed using these methodologies for simulating tests carried out at the Laboratory of Earthquake and Structural Engineering of the Faculty of Engineering of University of Porto (LESE - FEUP) regarding two types of elements, viz building solid columns and hollow-section bridge piers. The analyses allowed assessing each methodology advantages/limitations in simulating the cyclic behavior of the referred elements for different failure situations, particularly emphasizing those where shear failure is observed.
KEYWORDS: Non-linear analysis models, RC members, experimental tests, Shear failure.
1. INTRODUCTION
The effects of recent earthquakes have shown that several reinforced concrete structures still exhibit poor performance, especially those built according to previous, outdated codes. Therefore, all efforts are welcome to develop suitable seismic behavior evaluation methodologies that could serve as basis for objective collapse assessment and, consequently, as means to evaluate strengthening requirements.
In that context, an experimental comparative study has been developing at LESE (Laboratory of Earthquake and Structural Engineering) of FEUP (Faculty of Engineering of University of Porto), focusing on pier retrofitting solutions. Simultaneously, tests have been complemented with numerical simulations in order to provide reliable predictions of experimental results and also to help on better understanding the observed response. For this purpose, numerical methodologies should involve non-linear cyclic behavior but their use can become difficult, either to decide on an adequate balance of model complexity and efficiency, or just to choose model parameters.
Since several valid, more or less complex, numerical models are presently available to assess these issues, the present work aims at evaluating and proposing “applicability limits” of some of those models that were developed at FEUP (or in collaboration with FEUP members), depending on the dominant effort in the pier global response and the type of failure observed. The importance of this comparative study is also related with the available computational tools, since calculation speed and post-processing procedures heavily influence the choice between any of the referred models. Another important issue is the relation between an increasing model refinement and the complexity of result analysis. In this work the comparison was carried out between numerical strategies to evaluate the behavior of several bridge piers’ cyclic response, having adopted the following numerical models, ordered by increasing complexity degree:
• Concentrated plastic hinge model;
• Three-dimensional fiber model with distributed non-linearity.
• Continuum damage model, based in 2D and 3D finite element meshes.
The numerical analysis were made with the general purpose structural analysis computer code CAST3M (Pasquet, P. (2003)), where the damage (Faria, R. (1993, 1998); Costa, C. (2005)) and fiber models (Guedes, J. (1994)) are implemented. In addition, the stand alone PNL program was used to perform simulations by the plastic hinge model, based in a modified Takeda type model (Duarte, R.T. (1990) with some implementation modifications (Varum, H. (1996)).
2. EXPERIMENTAL CAMPAIGN
The experimental campaign related with the presented numerical simulations was based on rectangular or square, solid and hollow section piers (Delgado, P. (2006)).
The test setup, described in previous publications (Delgado, P. (2006)), involves two orthogonal independent actuators to apply the vertical and horizontal loads. Both the specimen and reaction frames are bolted to the strong floor with high strength prestressed rods. A constant axial load of 250 kN was applied during the tests herein described, while the lateral loads were cycled, under displacement controlled conditions.
The actuator control and data acquisition resorts to PXI controller systems from National Instruments (NI) and specifically home developed control routines based on the LabVIEW software platform (also from NI). The data acquisition system allows direct readings from strain gauges, load cells, LVDTs (Linear Voltage Displacement Transducers) and other types of amplified analogical or digital sensors.
For the present study scope, two different piers were adopted; their types are distinguished by their designation, namely PA1 and PO2. Pier PA1 represents a group of rectangular (200x400mm2) cross-section piers, 1700mm high, built on a heavily reinforced rigid square footing (1300mm x 1300mm x 500mm). The steel contents layout of this pier type is illustrated in Figure 1-a, where the longitudinal and transverse steel yielding strength is 500 MPa and 700 MPa, respectively. From experimental testing in small cubic specimens, the concrete compressive strength was evaluated with 26.5 MPa. The other pier type, PO2, with a rectangular hollow section, corresponds to a reduced scale bridge pier. The tested specimen has a 450x900mm2 cross-section (external dimensions) with 75mm thick walls and the steel layout is shown in Figure 1-b.
3 φ 12
3 φ 12
φ 6//0.15
a) b)
Figure 1 – Tested piers’ cross sections. a) PA1 with solid section; b) PO2 with hollow section.
3. NUMERICAL MODELS
3.1. Continuum Damage Model
The concrete constitutive model herein described was developed by Faria (Faria, R. (1993, 1998)) and is based in the Continuum Damage Mechanics. Essentially, this model requires the use of an “effective stress tensor”
σ
, which in the presented applications may be identified with the elastic stress. This tensor is decomposed into tension (σ+) and compression (σ−) tensors (in the principal directions space) associated with two independent, scalar damagevariables, d+ and d− for tension and compression, respectively. These variables fulfill the condition 0 ≤ d+(−) ≤ 1
and can be intuitively associated with the concrete degradation produced under tensile or compressive stresses. Adequate combination of these partial tensors is made according to Eqn. 3.1.
− − + +
+
−
−
=
σ
σ
σ
(
1
d
)
(
1
d
)
(3.1)In the present model, the damage variable evolution laws yield good results (Faria, R. 1993; Vila Pouca, N. (2002)), resorting to the definitions expressed by Eqns. 3.2 and 3.3, where +(−)
r can be regarded as hardening variables that control the evolution of the damaged surfaces:
)
1
(
1
o o + + + + + +=
−
A
−
r
r
e
r
r
d
, se + + ≥ o r r (3.2) ) 1 ( ) 1 ( 1 o o − − − − − − − − = − − − B −r r e A A r r d , se − − ≥ o r r (3.3) The A+(-) e B- parameters are calculated according to their dependency on some model associated issues, namely finite element mesh refinement, tensile concrete behavior parameters (tensile strength fct and fracture energy Gf) and others related with compressive behavior. Schematically, Figure 2(a) shows the concrete cyclic behavior obtained with this model when the damage variables are defined according to Eqns. (3.2) and (3.3).In the numerical simulations herein described, the damage model was used with both 3D solid and 2D plane stress finite element meshes. Initially developed and implemented by Faria in a stand alone program (Faria, R. 1993), the model is also available in the above referred code CAST3M (Pasquet, P. (2003) ; Costa, C. (2005)).
3.2. Menegotto-Pinto Model
Simultaneously with the above described damage model and also the fiber model (referred later in section 3.3), the steel reinforcement bars were represented in their own original position as bar elements connecting corresponding concrete mesh nodes. Such bar elements resist to axial loadings only, according to the formulation proposed by Giuffré and Pinto (Menegotto, M. (1973)), illustrated in Figure 2(b) which is also implemented in the CAST3M software.
TEN SIO N
C O M PRE SSIO N
ε σ
a) cyclic loading b) cyclic behavior model of reinforcement steel
Figure 2 – 1D behavior of concrete and steel
3.3. Fiber Model
The fiber model follows a well-known formulation, longitudinally discretizing the structure with linear beam elements. In the present case, Timoshenko beam elements are adopted in order to include shear deformations. For the cross-section the model resorts to an autonomous 2D finite element representation, at each longitudinal Gauss point and thus it is able to individualize concrete or steel fibers, according to their cross-section corresponding location, by setting up the different 2D finite elements with distinct constitutive laws. This model version, as implemented in CAST3M, assumes uniform bending in each beam element for which fiber deformations are computed according to
the kinematics of Timoshenko formulation (Figure 3(a)), while shear stresses are handled independently, assuming linear behavior with a given stiffness (derived and calibrated upon from the elastic one).
The non-linearity of this model thus comes only from the behavior laws chosen for the different fiber represented materials. The concrete behavior is thoroughly described by Guedes (Guedes, J. (1987, 1994)), and takes into account effects such as post-cracking stiffness loss, crack closure mechanisms and concrete confinement repercussions in peak strength and post-peak softening. As for the steel, the adopted model was the above referred Menegotto-Pinto model.
a) σ ε σ = f(ε) 1 2 3 6 9 5 8 σ ε =4 =7 σ ε σ = f(ε) σ = f(ε) 1 2 3 6 9 5 8 σ ε σ ε =4 =7 b)
Figure 3 – Fiber Model. a) Cross-section level kinematics; b) 1D concrete cyclic behavior (figures extracted from Guedes.(Guedes, J. (1987))
3.4. Concentrated Plastic Hinge Model
The adopted version of this model (Duarte, R.T. (1990; Varum, H. (1996)) uses bar elements with linear elastic or non-linear behavior associated with plane bending in a stand alone code named PNL. The non-linear behavior is concentrated solely on its extremities, defined in a finite length with plastic characteristics, since those are the critical zones where the main cracking and yielding phenomena often occur. Between end-sections, the central zone is defined as linear elastic.
The cross-sections associated with non-linear behavior (viz plastic hinges) are calculated according to a global modified Takeda type model (Takeda, T. (1970), Duarte, R.T. (1990), CEB (1996), Varum, H. (1996)), based on moment-curvature base curves describing the monotonic behavior of RC structures, and a set of loading, unloading and reloading hysteresis rules to accommodate stiffness and strength degradation, pinching effects and small cycles phenomena.
4. COMPARATIVE STUDY
This study focuses on a set of results coming from three pier tests made at LESE. Two of the specimens under study (PO2-N2-E1 and PA1-N6-E1, where N# stands for the model number and E# refers to the specimen testing order) have been previously described in section 2. The third specimen (PO2-N2-R1) is the same as the hollow pier presented before (PO2-N2-E1), which was rehabilitated and retrofitted with CFRP sheets after the first test failure. Those results help on evaluating each model abilities to simulate the involved phenomena, namely, shear and bending resistance, as well as on understanding the quality of the obtained information. The models presented in section 3 are used in numerical simulations using imposed displacement time histories on the top end of piers (corresponding to the experimentally imposed displacements) coupled with suitable RC element discretizations (the fiber and concentrated hinge models follow their own RC element representation, while the damage model uses a 2D finite element mesh for PA1-N6-E1 and 3D ones for the others). For the damage model simulation, the pier footing was fully modeled, while for the fiber or concentrated plastic hinge models it was represented as an elastic beam, whose characteristics were calibrated in order to account for the initial stiffness exhibited in the tests.
4.1. PO2-N2-E1 Simulation
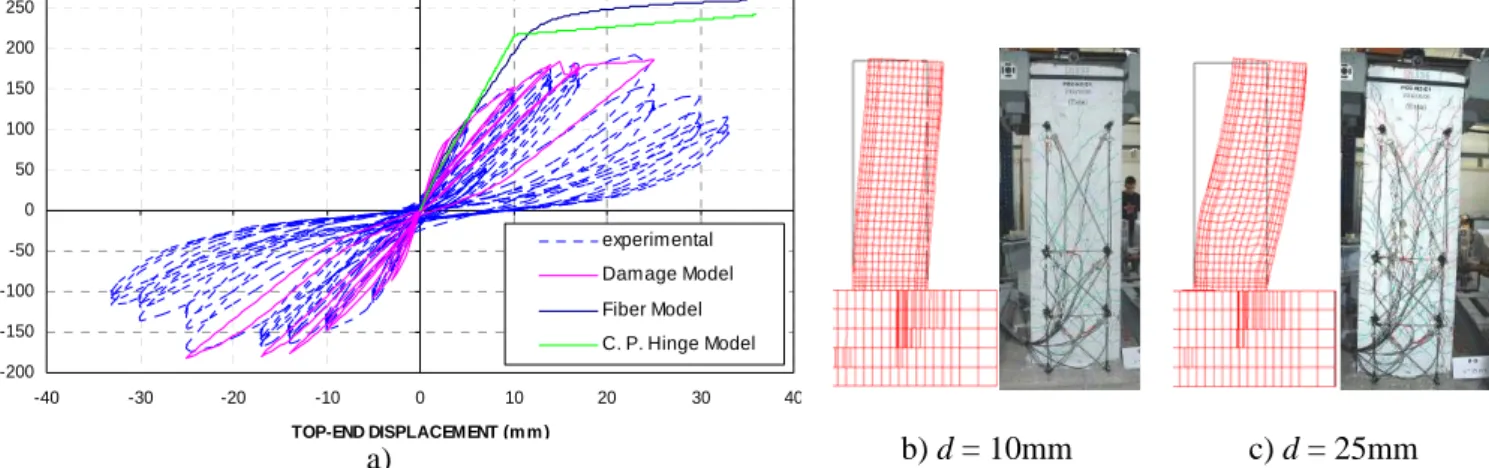
This hollow-section pier exhibited deformation and failure modes strongly influenced by insufficient shear resistance. For this reason the damage model was the only one able to describe the force-displacement relation recorded during the test, as shown in Figure 4(a) and it is also the one better describing the concrete tensile behavior, since shear deformation is governed mostly by tension. In contrast, by assuming linear elastic shear stiffness, the other models
Bending Moment and Axial Load Deformation
Torsional Moment and Shear Load Deformation
evidence a bending failure mode responsible for strength overestimation. However, despite presenting results clearly better than the others, the damage model involved some difficulties in predicting this unloading behavior; although this is issue still under analysis, it might be related to the complexity of RC shear deformation that requires demanding calibration of parameters for the concrete behavior damage model and also some difficulties of the model itself in predicting deformation at the crack level.
-200 -150 -100 -50 0 50 100 150 200 250 -40 -30 -20 -10 0 10 20 30 40 TOP-END DISPLACEMENT (m m ) HO RI Z O NT A L L O AD ( k N experimental Damage Model Fiber Model C. P. Hinge Model a) b) d = 10mm c) d = 25mm
Figure 4 – PO2-N2-E1 test – Original hollow pier. Experimental response vs. Numerical simulations. (a) Force-displacement diagram. (b) and (c) Deformation modes for two displacement levels.
Concerning the damage model results, it is apparent that they match the experimental ones, not only from the force-displacement diagram shown in Figure 4(a), but also from the damage and steel bar stress level. In fact, as shown in Figure 5(a) for a 25mm top-end displacement (close to failure), the numerical results illustrate very little compressive damage, which is in accordance with the observed during the test (the specimen only had a bit of concrete crushed and falling off on the bottom corner zones, precisely where the damage model shows bigger compressive damage). On the other hand, the shear effect influence shown in the failure mode is also reflected by yielding of most of the transverse steel stirrups along the pier height (Figure 5-b). This is further confirmed in the longitudinal steel rebar strain distribution that highlights heavy deformations concentrated on the outer bars (Figure 5-c), which is also related with small base rotation typical of a shear governed deformation mechanism.
Figures 4(b) and 4(c) show the numerical deformation modes in comparison with some pictures from the test for two displacement levels (10mm and 25mm), where a good correspondence can be seen between numerical and experimental findings. Vertical failure lines were observed on the web sides, located near the connection with the flanges, were well captured by the model as apparent from the distortions in some finite elements of the web (Figure 4(c)).
a) Compressive damage b) Stirrup stress map c) Longitudinal bar strain map
Figure 5 – PO2-N2-E1 test – Original hollow pier. Numerical damage model results for d=25 mm.
Regarding the presented results, it should be highlight that for a shear-dominated structural behavior, it is not possible to predict the real response with the other more simplified models herein adopted
4.2. PO2-N2-R1 Simulation
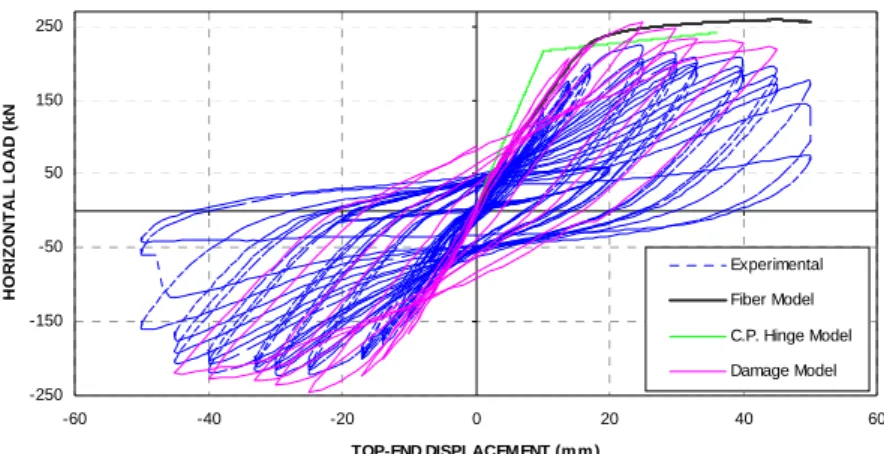
After the above described test, and due to the strong damage, the PO2-N2-E1 pier web sides were totally rehabilitated and the specimen was globally retrofitted using CFRP sheets. In fact, the real deformed picture and the PO2-N2-E1 test results suggested that flange sides were not severely damaged and therefore it can be assumed that the new specimen (PO2-N2-R1) is identical to the previous one, with addition of CFRP sheets. This solution mainly aimed at preventing the shear failure observed in the original pier and, as shown in Figure 6, it exhibited a larger strength and ductility than before. This particular increase was not only due to the confinement provided by CFRP, but especially from a more bending-like oriented failure mode in contrast with the clear shear failure mode exhibited by PO2-N2-E1.
Force-displacement diagrams illustrated in Figure 6 show that all the models provide reasonable simulations of the experimental results, although the cyclic calculation was computed with the damage model only. The other models exhibit monotonic response predictions with good peak force value, despite the elastic stiffness being slightly larger in the plastic hinge model case; this is due to the impossibility of including any change in the original pier characteristics, namely the concrete tensile behavior, by contrast with the damage or fiber models where the flange cracking and local concrete tensile strength losses can be simulated in order to obtain a smaller stiffness.
-250 -150 -50 50 150 250 -60 -40 -20 0 20 40 60 TOP-END DISPLACEMENT (m m ) H O R IZ O N TA L LO A D ( k N Experimental Fiber Model C.P. Hinge Model Damage Model
Figure 6 – PO2-N2-R1 test – Hollow retrofitted pier. Experimental response vs. numerical simulations.
Figure 7(a) includes a deformed shape (from damage model) where the lateral displacements are mostly due to base rotation. In fact, the curvature diagram obtained with the fiber model (Figure 7(c)) confirms that a plastic hinge was formed very close to the pier base, above which a mainly linear behavior is found. The compressive damage distribution (Figure 7(b)) shows some concrete crushing at the pier base, in accordance with what was recorded during the test. It is thus quite clear that all these findings point to that same bending-oriented failure mode.
a) deformed mesh b) Compressive damage
0,0 0,2 0,4 0,6 0,8 1,0 1,2 1,4 -0,10 -0,05 0,00 BENDING Z ( m )
c) Curvature (m-1) along pier height
Figure 7 – PO2-N2-R1 test, hollow retrofitted pier. Numerical results for d=25 mm. 4.3. PA1-N6-E1 Simulation
In comparison with the previous case, this pier presents more common characteristics that lead to a simpler analysis. The solid cross-section gives this pier good shear resistance, coupled with transverse reinforcement capable of
resisting shear loads of more than 200 kN. The main deformation mode of this pier is characterized by bending, which, as shown in Figure 8, is well predicted by all models.
-80 -60 -40 -20 0 20 40 60 -90 -60 -30 0 30 60 90
TOP-END DISPLACEM ENT (mm)
HO RI Z O NT AL L O AD ( k N ) C.P. Hinge Model Fiber Model Damage Model Experimental a) 0 0,2 0,4 0,6 0,8 1 1,2 1,4 1,6 -0,16 -0,12 -0,08 -0,04 0 BENDING z ( m ) b)
Figure 8 – PA1-N6-E1 test – Solid pier. Experimental response vs numerical simulations. (a) Force-displacement diagrams. (b) Curvature (m-1) along the pier height (from fiber model)
In bending-type deformation modes, the RC tensile behavior, particularly “tension-stiffening” and tensile strength effects are apparent only in the cracking phase, being almost negligible in a global analysis and especially when close to failure. Therefore, any model that correctly includes both the 1D concrete (in compression) and steel constitutive laws is capable of obtaining satisfactory results, particularly in a post-yielding phase, as shown in Figure 8. However, the concentrated plastic hinge model (the least refined one) denotes less ability to correctly reproduce the initial stiffness, which is understandable since this model does not include a soft transition phase between the elastic regime and yielding because progressive crack spread is not allowed due to the fixed plastic hinge length and the constant elastic stiffness of the central zone.
As for the other pier cases, several results are presented as to illustrate the bending failure mode of PA1-N6-E1. Although with fiber or plastic hinge models is not possible to obtain results as detailed as those from the damage model, numerical findings agree in the failure type. Again, the deformed shape (from damage model) depicted in Figure 9(a) is consistent with a concentrated base section rotation with large curvature demand (from fiber model) as illustrated in Figure 8(c) and with the compressive damage shown in Figure 9(a); all these results correspond to the same time step for 40mm top displacement.
a) Deformed mesh b) Compressive damage c) Longitudinal reinf. strength
Figure 9 – PA1-N6-E1 test, solid pier. Damage model’s numerical results for d=40mm.
5. FINAL REMARKS
A mere qualitative evaluation of the results obtained from the different models allows the conclusion that they are
essentially equivalent, with the exception for the information detail that each one provides. Therefore, to choose a certain formulation it is important to know beforehand what exactly is the desired information to obtain from the model, knowing that a tool such as the damage model provides a more realistic behavior simulation, but at high cost in computational resources and computation time; moreover, additional difficulties arise if only simple results are needed such as moment-bending diagrams.
Each model efficiency cannot be evaluated independently, isolated from the problem at hand, because a simple tool can be enough to solve a simple problem (ex: knowing the peak force), while a more complex one might be needed to evaluate a difficult issue (ex: to analyze stress transfer between the web and flange sides of hollow piers). Obviously, by adopting an heavier the tool, the more difficult it will be to analyze the obtained results.
6. ACKNOWLEDGEMENTS
This study was partially performed with the financial support of the FCT through the Project PTDC/ECM/72596/2006, “Seismic Safety Assessment and Retrofitting of Bridges”, which one thankfully acknowledges.
The authors would like to thank the company João da Silva Santos, Lda. for the construction of the solid piers, the company Irmãos Maia, Lda. for the construction of the tested hollow piers and also the company S.T.A.P. – Reparação, Consolidação e Modificação de Estruturas, S.A. for the retrofitting and rehabilitation work. Final acknowledgements for the laboratory team, Engº André Martins and Mr. Valdemar Luís, for all the careful support given during testing preparations.
REFERENCES
CEB (1996) RC Frames Under Earthquake Loading. Comité Euro-International du Béton, Bulletin nº231.
Costa, C., Pegon, P., Arêde, A. and Castro, J. (2005), Implementation of the Damage model in Tension and Compression with Plasticity in Cast3m. Report EUR, ISPC, CEC, JRC, Ispra (VA), Itália.
Delgado, P., Rocha, P., Rodrigues, V., Santos, M., Arêde, A., Pouca, N., Costa, A. and Delgado, R. (2006), “Experimental Cyclic Tests and Retrofit of RC Hollow Piers”, Proceedings of the 13th European Conference on Earthquake Engineering (13ECEE), Geneva, Switzerland, 3-8 September, Paper N. 1205
Duarte, R.T., Oliveira, C.S., Costa, A.C., Costa, A.G. (1990) A Non-linear Model for Seismic Analysis, Design and Safety Assessment of Reinforced Concrete Buildings. Earthquake Damage Evaluation & Vulnerability Analysis of Building Structures, edited by A.Koridze, OMEGA Scientific.
Faria R. and Oliver, J. (1993) A rate dependent plastic-damage constitutive model for large scale computations in concrete structures. CIMNE Monograph 17, Barcelona.
Faria, R., Oliver, J. and M. Cervera, (1998) A strain-based plastic viscous-damage model for massive concrete structures. International Journal of Solids and Structures 35(14), 1533-1558.
Guedes, J. (1987) Seismic behaviour of reinforced concrete bridges. Modelling, numerical analysis and experimental assessment. PhD Thesis, Faculdade de Engenharia da Universidade do Porto, Porto.
Guedes, J., Pegon, P. and Pinto, A.V. (1994) A fibre/Timoshenko beam element in Castem 2000. JRC Special Publication N°I.94.31, Ispra, Itália.
Menegotto M. and Pinto, P. (1973) Method of analysis for cyclically loaded reinforced concrete plane frames including changes in geometry and non-elastic behaviour of elements under combined normal force and bending. IABSE Symp. Resist. Ultimate Deform. of Struct. Acted on by Well-Defined Repeated Loads, Lisbon, Portugal. Pasquet, P. (2003) Manuel d’utilisation de Cast3m. Commissariat à l’Énergie Atomique, www.cast3m.cea.fr. Simo, J. and Ju, J. (1987) Strain- and stress-based continuum damage models. I: Formulation. Int. J. Solids
Structures, 23(7), pp. 821-840.
Takeda, T., Sozen, M.A., Nielsen, N.N. (1970) Reinforced concrete response to simulated earthquakes. Journal of the Structural Mechanics Division of the ASCE, ST12, 96.
Varum, H. (1996) Modelos Numéricos para a Análise Sísmica de Pórticos Planos de Betão Armado. Tese de Mestrado, Faculdade de Engenharia da Universidade do Porto, Porto, 1996.
Vila Pouca, N. (2002) Simulação Numérica da Resposta Sísmica de Elementos Laminares de Betão Armado. Tese de Doutoramento, Faculdade de Engenharia da Universidade do Porto, Porto.