DIFFUSING BLOGS, WIKIS AND SOCIAL NETWORKS IN THE
WORKPLACE: CONSIDERING EMPLOYEE PERCEPTIONS
by
Samantha Resendes Silva
Dissertation submitted in partial fulfillment of requirements for the degree of MSc in Business Administration at Universidade Católica Portuguesa
Lisbon, Portugal
January 2012
Abstract
Diffusing Blogs, Wikis and Social Networks in the Workplace: Considering Employee Perceptions
Samantha Resendes Silva
Research shows that executive satisfaction and the measurable business benefits of becoming an “Enterprise 2.0” firm is directly correlated with the amount of users participating on said network (Bughin and Chui 2011). Despite high overall adoption rates worldwide, Web 2.0 tools tend to have low internal usage rates (Bughin, Manyika and Miller 2008). This
dissertation aims to outline suggestions for those considering the diffusion of certain Web 2.0 communication and collaboration tools in the workplace through the examination of employee perceptions. Research shows that technology strategies often fail because executives tend to discount the importance of considering employee perceptions when developing technology strategies (Hall 2000).
As such, this dissertation uses primary data to gain a better understanding of employee perceptions on three major communication and collaboration tools: blogs, wikis and social networks. It also seeks to understand the role that these perceptions play on an employee’s willingness to adopt the technologies. Employee perceptions are summarized based on Everett Rogers’ five forces framework (1995). This framework directly links the individual’s
technology perceptions to their final decision to adopt the technology, and constitutes the foundation of this research (Rogers 1995).
The findings show that, despite similar positive attitudes across all three tools, age group 19-29 and 30-49 had notably different motivations for their willingness to adopt the tools. The results suggest that each tool requires different considerations, and should be approached in different ways.
Acknowledgements
I would to sincerely thank my dissertation supervisor, Paulo Cardoso do Amaral, for his all his advice, patience and attention. He was the one who suggested the investigation of Web 2.0 technology as I toyed with the idea of technology and collaboration in the workplace. Without his guidance, this dissertation would not have been possible.
Last but not least, I’d like to express my deepest gratitude toward my parents, Fernando and Lucy, for their unrelenting love and support throughout my academic career thus far.
Table of Contents
Abstract ... ii Acknowledgements ... iii Table of Contents ... iv 1. Introduction ... 1 1.1 Introduction ... 1 1.2 Background to Research ... 11.3 Problem Statement & Research Questions ... 3
1.4 Methodology ... 4
1.5 Outline ... 5
1.6 Conclusions ... 5
2. Literature Review ... 6
2.1 Introduction ... 6
2.2 Web 2.0 Communication and Collaboration Tools ... 6
2.2.1 Introduction ... 6
2.2.2 Introduction to Web 2.0 ... 6
2.2.3 Definitions of Major Web 2.0 Communication and Collaboration Tools... 7
2.2.4 Selection of Communication and Collaboration Tools ... 9
2.2.5 Conclusion ... 10
2.3 The Fully Networked Enterprise ... 10
2.4 The Link Between Employee Perception and Information Technology Strategy ... 11
2.5 Age and Computers ... 12
2.6 The Rogers Five Forces: Diffusion Theory ... 12
2.6.1 Introduction ... 12
2.6.2 Everett Rogers and the Diffusion of Technology ... 13
2.6.3 Relative Advantage ... 14
2.6.4 Compatibility ... 15
2.6.5 Complexity ... 16
2.6.6 Trialability ... 16
2.6.8 Conclusion ... 17
2.7 Conclusion ... 17
3. Methodology and Data Collection ... 18
3.1 Introduction ... 18
3.2 Research Design and Statistical Procedures ... 18
3.2.1 Introduction ... 18
3.2.2 Research Model ... 18
3.2.3 Survey Design ... 19
3.2.4 Research Question Response Procedure ... 19
3.2.5 Conclusion ... 20
3.3 Research Model and Statistics-Related Justifications ... 21
3.3.1 Introduction ... 21
3.3.2 Overall Model Inspiration ... 21
3.3.3 Likert Scale Interpretation ... 21
3.3.4 Multiple Regression Choice ... 22
3.3.5 Special Treatments of Data ... 22
3.3.6 Conclusion ... 22
3.4 Hypotheses ... 23
3.5 Unit of Analysis ... 26
3.6 Sample Population Characteristics ... 26
3.7 Limitations with the Procedure ... 27
3.8 Conclusion ... 28
4. Results’ Analysis ... 29
4.1 Introduction ... 29
4.2 Multiple Regression Output Significance ... 29
4.3 Findings ... 30
4.3.1 Introduction ... 30
4.3.2 Research Question 1 – Relative Advantage ... 30
4.3.3 Research Question 2 – Compatibility ... 32
4.3.4 Research Question 3 – Complexity ... 34
4.3.6 Research Question 5 – Observability ... 36
4.3.7 Conclusion ... 37
4.4 Conclusion ... 37
5. Main Conclusions and Future Research ... 38
5.1 Introduction ... 38
5.2 Research Question Conclusions ... 38
5.3 Problem Statement Conclusion ... 39
5.4 Implication for Theory ... 40
5.5 Implications for Professional Practice ... 41
5.6 Limitations ... 42
5.7 Future Research ... 43
5.8 Conclusion ... 44
6. Bibliography ... 45
7. Appendices ... 48
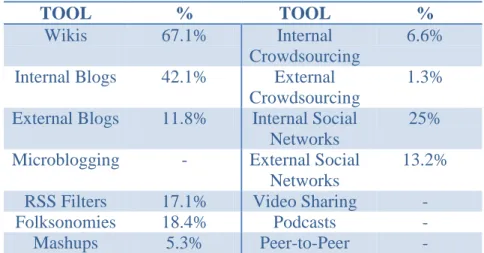
Appendix A: Communication and Collaboration Web 2.0 Tools ... 48
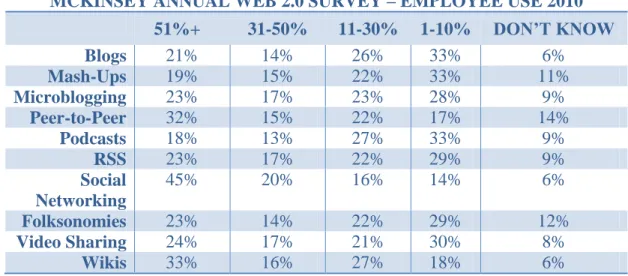
Appendix B: Business and Web 2.0: Employee Use ... 49
Appendix C: Number of Responses by Age and Tool ... 50
Appendix D: Survey ... 51
Appendix E: Multiple Regression Models ... 53
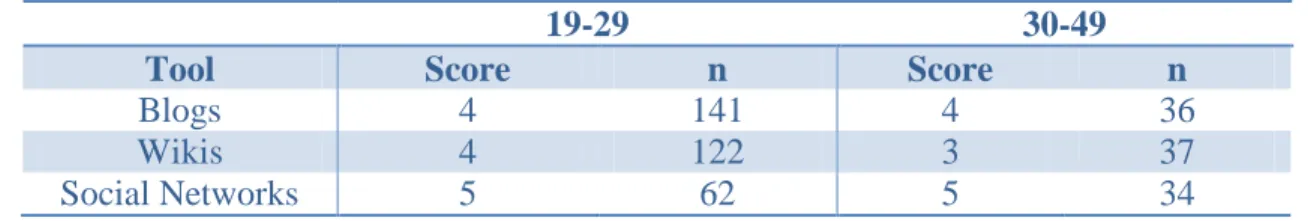
Appendix F: Relative Advantage Perception Scores ... 54
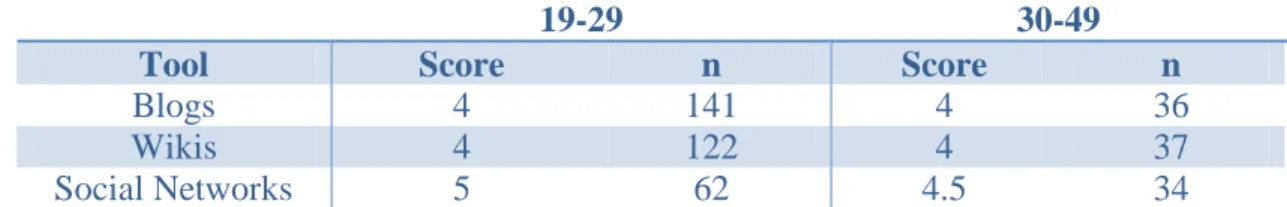
Appendix G: Compatibility Perception Scores ... 55
Appendix H: Summary of Perceptions for Ages 19-29 ... 56
1. Introduction
1.1 Introduction
This dissertation aims to understand two aspects of employee perceptions on blogs, wikis and social networks. The first aspect concerns general perspectives on these tools. The second aspect analyzes whether these perspectives influence their willingness to adopt the tools in the workplace. The perspectives are analyzed using the Rogers five forces framework. These tools represent Web 2.0 communication and collaboration tools. This chapter summarizes how these two aspects of Web 2.0 communication tools are investigated in this dissertation. To begin, the inspirations for investigation of this topic are explored. Then, the problem statement and research questions are established. The next section explains how this problem and consequent research questions are answered. Lastly, the dissertation overview is presented.
1.2 Background to Research
Coined by Dale Dougherty and Tim O’Reilly in 2004, Web 2.0 was a departure from the famous “Dot Com Revolution” of Web 1.0. Web 1.0 focused on merely publishing information on the Internet, whereas Web 2.0 focused on interacting amongst others concerning said information. This interaction is best by Tim O’Reilly as “adding value” to published information though the use of user generated content (O’Reilly 2005).
The business world did not miss this revolution, and Enterprise 2.0 is continually growing in importance and popularity, according to the research done by Jacques Bughin and Michael Chui (2011). Their last annual survey for McKinsey&Company in 2010 reported that out of the 3 249 executives interviewed, two thirds of the respondents are already using at least one type of Web 2.0 technology in the workplace. Two thirds of these adopters plan to increase future investments in these technologies – a 25% increase in investment from the prior year. Furthermore, almost 9 of 10 businesses are experiencing measurable business benefits from the use of Web 2.0 technology, nearly a 20% increase from 2009 (Bughin and Chui 2011). In 2009, respondents were already reporting measurable business benefits including more
innovative products and services, more effective marketing, better access to knowledge, lower costs of doing business and higher revenues (Bughin, Chui and Miller 2009). Research by
Stephan Adriole explains that although Web 2.0 tools are used for a host of functions, it is primarily used for communication and collaboration within workplaces (Adriole 2010).
However, Bughin and Chui explain that there is a correlation between the amount of workers using Web 2.0 and the benefits received by the companies (2011). Out of the three types of Web 2.0 adopting organizations, the fully networked enterprise is significantly correlated with measurable business gains in market share, operating profits and market leadership relative to internal or external networked organizations (Bughin and Chui 2011). However, according to the 2008 McKinsey&Company study, companies using Web 2.0 tools have, on average, only one in four employees using these tools (Jacques, Manyika and Miller 2008). In addition, executives dissatisfied with their Web 2.0 investment cite impediments in organizational structure and a lack of knowledge of how to use these tools to add value as their two main sources of dissatisfaction (Chui, Miller and Roberts 2009). Thus, it is assumed that there is unrealized potential with the adoption of these tools in the workplace as a result of low diffusion amongst employees in organizations, and also a lack of understanding how the tools can be used to create value.
According to Alan Hall, technology change in the workplace needs to be handled with care. One of the leading causes of failure for technological change in the workplace is executive’s failure to understand employee attitudes (Hall 2000). In addition, it should be noted that research suggests that an individual’s decision to adopt technology is influenced by their age. It is proposed that this may simply be a result of less exposure at a younger age for older individuals (Morris and Venkatesh 2000). Everett Rogers developed a framework to better understand individual’s attitudes on technologies, and how people ultimately arrive at the decision to adopt new technology (1985). This framework measures five factors which lead to an individual’s decision to adopt a technology: relative advantage, compatibility, trialability, complexity and observability. According to this theory, the user chooses to adopt when they perceive high relative advantage, compatibility, trialability, observability and a low
complexity (Rogers 1985).
To summarize, the highest business benefits of adopting Web 2.0 technology is positively correlated with how widespread adoption the adoption is amongst companies, and that a better understanding of employees attitudes concerning these technologies is essential to a successful
technology rollout (Bughin and Chui 2011, Hall 2000). Moreover, the Rogers five forces can be used to evaluate an individual’s attitudes on technologies, and how individuals decide to adopt them (Rogers 1985). This dissertation thus assumes that by understanding what encourages employees’ willingness to adopt Web 2.0 technology, executives can reduce the risk of Web 2.0 communication and communication tool implementation failure through the addition of this knowledge. The Web 2.0 communication and collaboration tools that are evaluated in this dissertation are blogs, wikis and social networks. This is due to their
consistency of being researched as communication and collaboration tools, as expanded on in the next chapter in greater detail (Adriole 2010 & McKinsey Quarterly 2011).
1.3 Problem Statement & Research Questions
The problem this dissertation seeks to answer is: what are employee perceptions on blogs, wikis and social networks according to the Rogers five forces, and which of these forces impact their decision to adopt these Web 2.0 communication and collaboration technologies in the workplace?
The Rogers five forces is the chosen framework to comprehend employee perceptions on Web 2.0 technologies, and as such, it is the foundation of the problem statement. Recall that Rogers directly links individual’s perceptions to the decision to adopt technologies, and that the five forces are relative advantage, compatibility, complexity, trialability and observability (Rogers 1985). There, to attempt to answer the problem statement, each communication and
collaboration tool needs to be evaluated twice to understand both: a) the general perception of the tool, and b) whether the particular force impacts the decision to adopt.
Research questions are used in order to suggest an answer to the problem statement. They also are structured around the Rogers five forces:
1. Do employees a) perceive a relative advantage in the use of Web 2.0 tools, and b) is it correlated with their willingness to adopt it blogs/wikis/social networks in the workplace?
2. Do employees a) perceive the tools as compatible with the nature of their work and the organizations values, and b) is this compatibility correlated with their
3. Do employees a) perceive the tools as difficult to use [complexity], and b) is this difficulty correlated with their willingness to adopt blogs/wikis/social networks in the workplace?
4. Do employees a) feel they know how to use the tools [trialability], and b) is it correlated with their willingness to adopt blogs/wikis/social networks in the workplace?
5. Do employees a) perceive others using the tools [observability], and b) is this correlated with their willingness to adopt blogs/wikis/social networks in the workplace?
1.4 Methodology
The methodology to answer the research questions is briefly explained, as follows. Primary data is collected and analyzed in order to suggest answers to the research questions. The primary data is collected via an online survey. The primary data allows for the understanding the two parts of each research question mentioned above; a) the overall perception of each force according to each technology and b) whether the force leads to the decision to adopt each technology. The overall perception of each Rogers force, (a), is evaluated to gain an understanding of the perception of each tool – for example, to understand the overall relative advantage in using a blog as perceived by employees, answering the first part of the first research question. To answer the second part of each research question, (b), multiple regression analysis is used to see whether each force sufficiently explains the willingness to adopt. For example, if relative advantage returns a sufficiently significant coefficient, then it is safe to say that there is a correlation between relative advantage and the willingness to adopt. The information returned for parts a) and b) of the research questions are then analyzed and discussed to propose an answer to the problem statement – what are the overall attitudes on blogs, wikis and social networks, and do the Rogers forces impact the decision to adopt a technology.
1.5 Outline
The next chapter, the literature review, expands on the topics explained above and provides the background information necessary to answer the problem statement. This includes background on Web 2.0, communication and collaboration tools, statistics on enterprise 2.0, the theory of Rogers’ five forces and other literature necessary to properly construct the survey and propose hypotheses. Following the literature review, the chapter on methodology is
presented, where the information from the literature review is applied to formulate hypotheses, and to designing the survey. The discussion analyses the results from the survey, justifies and evaluates the hypotheses from the research questions. Finally, conclusions are presented at the end of this dissertation, along with a references list.
1.6 Conclusions
The problem this dissertation seeks to understand is how employees perceive communication and collaboration Web 2.0 tools (blogs, wikis and social networks), and if these perceptions influence their willingness to adopt the tools in the workplace. The Rogers five forces is a framework for evaluating such perceptions on technologies, and how users decide to adopt them (Rogers 1985). This information is assumed to be a component to the development of Enterprise 2.0 implementation strategies, as research indicates that a) employees’ perceptions are important factors in successful technology strategies, and b) the business benefits garnered from the use of these technologies is correlated with higher employee usage rates within firms (Hall 2000, Bughin and Chui 2011). The following chapter explores the background
information necessary to prepare to answer the research questions in order to come closer to answering the problem statement.
2. Literature Review
2.1 Introduction
This chapter, the literature review, aims to provide sufficient background in order to proceed into the methodology section. This is done by first expanding on topics presented in the introduction, and provides the necessary literature to develop propositions to the research questions. It is divided into four sections. The first investigates Web 2.0 and seeks to understand what exactly communication and collaboration tool which better defined the problem statement. The second section expands on statistics presented in the introduction and explains the benefits of increasing the number of employees using Web 2.0 communication tools in the workplace. The third section explains why understanding the link between employees and new technology is important for technology strategy, followed by age considerations and technology in the workplace. The fourth and last section is dedicated to explaining the Rogers five forces theory.
2.2 Web 2.0 Communication and Collaboration Tools 2.2.1 Introduction
In order to effectively discover which Web 2.0 tools best fits the description of a Web 2.0 communication and collaboration tool, three areas must be analyzed: what is Web 2.0 in general, common Web 2.0 tools, and which of these tools best qualifies as a communication and collaboration tool. Thus, it is explained why blogs, wikis and social networks have been selected to represent communication and collaboration Web 2.0 tools in the problem statement of this dissertation.
2.2.2 Introduction to Web 2.0
“[There’s] a huge amount of disagreement about just what Web 2.0 means,” says Tim O’Reilly, the pioneer of the phrase “Web 2.0”, in a 2004 conference with MediaLive International with Dale Dougherty where he explained some key features of Web 2.0
technology. As O’Reilly is the pioneer of the term, this dissertation follows his description of Web 2.0. It is important to note he states that Web 2.0 is not a physical technological
innovation; rather it is a shift in the way the Internet is actually being used compared to its predecessor, Web 1.0 (O’Reilly 2005). O’Reilly stresses that Web 2.0 is not defined as simply using the Web as a platform, since this is a feature also common to Web 1.0 technologies (2005). Web 1.0 focused on using the web as a platform to publish information, whereas Web 2.0 focuses on user participation, resulting in a rich, diverse database of information (O’Reilly 2005). According to Tim O’Reilly, as participation increases (and thus network effects
increases) the service provided improves due to increased contribution (2005). Users ultimately decide what is important, as they are the one who choose to add content, and as such they are seen as “trusted co-developers” to databases (O’Reilly 2005). O’Reilly views this database as a core competency and as extraordinarily valuable, as it a source of its user’s collective intelligence (O’Reilly 2005).
2.2.3 Definitions of Major Web 2.0 Communication and Collaboration Tools
Due to the wide amount of speculation concerning Web 2.0 tools and their definitions along with no principal source of what constitutes a communication and collaboration tool
specifically, it is important to narrow down which tools satisfy the title of Web 2.0 communication and collaboration tool to avoid redundancy. The following tools are consistently mentioned as regular Web 2.0 tools:
Wikis: Published webpages with the ability to be created and edited by various users through a web browser. Wikipedia is the most famous example. They contain a built-in search feature, a simple site structure, support for multiple users, a wiki markup language, simple navigation and a simple workflow. Content accuracy is a concern due to the ability for anyone to edit the page; this is all security related preference dependent, however (Murgensen 2007).
Blogs: Similar to an online journal. Two way communication tool; one user is responsible for publishing content (a blog entry), and anyone who wishes to comment or share the post is permitted. Can use text, images, links to other pages. The content after publishing is instantly available to the whole web, and searchable via a search engine. Granted, these characteristics are all dependent on the settings the user enables. Examples include LiveJournal, Blogspot and Twitter (micro-blog) (Murgensen 2007).
Crowdsourcing: Outsourcing the gathering of information to the “crowd”, in a voluntary way; it is not directly a tool for internal collaboration. Example: Wikipedia, although in the a Wiki, uses crowdsourcing to develop its database. Other examples include Amazon’s Mechanical Turk and Second Life (Howe 2006).
Social Networks: “Social structure made of nodes, generally individuals or organizations, which are connected by one or more specific types of interdependency”. Examples include Facebook, LinkedIn and Twitter (Harris 2009). Generally, these sites allow for the sharing of personal preferences, interests, and abilities (Bughin & Manyika 2007).
Folksonomies: User-created taxonomies of open-ended tags, used to organize web activities. Example, Flickr allows tags to be added to posted pictures, with no limitations on vocabulary. Users are then able to use a search engine to find photos with similar tags. Note that the tag system does not generally encourage the use of a full line of thought (Murgensen 2007).
RSS: Really Simple Syndication. A user “subscribes” to receive updates from specific websites/topics when they are published, reducing the need to continually check a website to seek updates. The information is delivered via an XML files which summarize the information and link the appropriate sources. The user is required to use a “feed reader” or “aggregator program” to literally “feed” the users the information when it becomes available. This tool links to other published items, and thus is more of a prompting system (Murgensen 2007).
Peer-to-Peer Networking (P2P): A way of sharing files, either throughout the whole Internet or to a closed-set of users. (Bughin & Manyika 2007). Beware that the existence of these
networks superceed the common notion of Web 2.0, there is much debate of its qualifications as a Web 2.0 tool (O’Reilly 2001).
Virtual Worlds: Interaction in an online “world” or community via personalized avatars. Examples include Second Life, ActiveWorlds and Twinity (Harris 2009)
Mashups: Combining information and or services from multiple websites. An example is HousingMaps, which uses Craigslist sales and rental posting combined with Google Maps interactive services (Murgensen 2007).
2.2.4 Selection of Communication and Collaboration Tools
Despite these Internet tools being suited for interaction, they are not necessarily suited for collaboration and communication according to the definitions above, and also some of the tools commonly referred to precede the existence of Web 2.0. Therefore, the identification of core Web 2.0 communication and collaboration tools was necessary to paint to decide which tools to evaluate to satisfy the problem statement. This dissertation assumes that a) only tools which are consistently present throughout existing Web 2.0 research and that b) encourage the exchange of full sentences are considered eligible as a communication and collaboration tool.
Stephan Andriole interviewed and then surveyed 76 executives using Web 2.0 technologies evaluated six different performance areas and the level of satisfaction and which tools were most used depending on the area (2010). Communication and collaboration was seen to have the highest amount of perceived benefits out of all six areas in this study (Adriole 2010). Appendix A shows which tools are used the most for communication and collaboration purposes according to Adriole.
The measures used in the McKinsey Business and Web 2.0 Business feature also highlight the same Web 2.0 tools, including Microblogging, Peer-to-Peer, Video Sharing and Podcasts (McKinsey Quarterly). This information is presented in Appendix B. Please note that this table does not focus exclusively on communication and collaboration as the prior did, but does indicate which tools are being used the most in companies with 51% of employee Web 2.0 use, and helped indicate which tool to choose (McKinsey Quarterly).
Table 2 presents podcasts and videosharing as Web 2.0 tools (McKinsey Quarterly). Despite fitting the above definition for Web 2.0 communication tools, since all other researchers included in this paper have excluded it, it is safer to not include it here without further research. Therefore, with the commonalities in the above information from both McKinsey and Andriole along with the definitions of Web 2.0 technologies, we assume that the tools most used for communication and collaboration are: wikis, blogs, social networks, mashups, folksonomies, RSS and peer-to-peer networks. However, peer-to-peer networks have
extensive debates upon whether they are actually a Web 2.0 technology and in fact precede the existence of Web 2.0, in order to keep consistency it cannot be included (O’Reilly 2001).
Moreover, RSS feeds and folksonomies are a notification system and a tagging system respectively, and do not necessarily allow for the exchange of full thoughts and thus must be eliminated, according to this dissertation’s definition established earlier. Mashups are
combinations of various tools, and thus there is a high risk for redundancy and possibilities and must also be excluded (Murgensen 2007). The only tools which are both consistent across Web 2.0 communication and collaboration tool research are blogs, wikis and social networks.
2.2.5 Conclusion
The section above justifies why blogs, wikis and social networks were chosen to represent communication and collaboration Web 2.0 tools. This was necessary due to no pre-existing source of what officially constitutes a collaboration and communication Web 2.0 tool.
2.3 The Fully Networked Enterprise
This section seeks to expand on why Web 2.0 technology is an important area to investigate by providing more statistics of the usage of this technology from the surveys cited in the introduction. It explains that there are scale benefits to using the technology across organizations. It also briefly mentions projected investment trends in the area.
Several sources cite perceived benefits from the use of these technologies; in particular, the 2009 McKinsey Global Web 2.0 survey cited that sixty nine percent of all respondents report measurable business benefits in the following areas: more innovative products and services, more effective marketing, better access to knowledge, lower cost of doing business and higher revenues (Bughin, Chui, Miller 2009). In the latest survey, this number had increased to almost 9 out of 10 Web 2.0 companies gaining measurable benefits from the use of these technologies, across business metrics such as gains in market share, operating margin and market leadership (Bughin and Chui 2011).
The dissatisfied users have problems with implementing the technologies due to
organizational structures and a lack of understanding of how to create value using these tools (Chui, Miller and Roberts 2009).
The success of Enterprise 2.0 seems to stem from the fact that as the amount of people participating increases, the value of the content also increases (Bughin 2011). Bughin states
that not only is daily Web 2.0 use amongst employees the key success factor to benefit from these tools, but also that its benefits are low without higher levels of adoption and usage (Bughin 2011). Bughin, Manyika and Miller in 2008 reported that the usage of Web 2.0 tools is uneven throughout most companies, and only one in four uses Web 2.0 tools. The
companies most satisfied with the results from using Web 2.0 tools, a quarter of them have more than fifty percent of all employees using the tools (Bughin, Mayika, Miller 2008).
Investment in Web 2.0 tools is growing, which is an excellent sign for those considering investing in fully networked enterprises, as mentioned, the greatest benefits are expected from those who manage to incorporate these tools not only internally, but externally as well. Oliver Young of Forrester Research states:
“Our most recent Web 2.0 survey demonstrates that despite early frustrations, a growing number of companies remain committed to capturing the collaborative benefits of Web 2.0. Since we have first polled global executives two years ago, the adoption of these tools have continued. Spending on them is now a relatively modest $1 billion, but the level of investment is expected to grow by more than 15 percent annually over the next five years, despite the current recession.” (Young 2009).
Therefore, investigation into what factors affect employee adoption of Web 2.0 collaboration tools, whether it be lack of awareness, impeding company values, complexity, etc. provides insight on how to best develop strategies in order to capture these business benefits, and follow the Web 2.0 adoption trend.
2.4 The Link Between Employee Perception and Information Technology Strategy This section further explains the importance of researching employee perceptions as the
problem statement. Research on the link between understanding employee perceptions and developing information technology strategies with higher chances of success is presented here.
One of the main causes of failure to introduce new technology in firms is due to employee resistance. Very often, executives discount the importance of employee’s attitudes toward technologies, which is the leading cause for adoption failure (Hall 2000). This lack of executive planning can be avoided by better understanding the needs of the employees. Hall
states, “resistance to change from lack of training or support – or fear that jobs will be lost – is the main cause of failure” (Hall 2000).
Therefore, understanding employee perceptions and attitudes is an important part of
integrating new technology in the workplace, as there are higher chances of failure when this factor is ignored. One of the most famous frameworks to measure individual’s perception and the adoption of technology is the Rogers five forces.
2.5 Age and Computers
Michael Morris and Viswanath Venkatesh performed a study which demonstrated that older individuals are less inclined to initially adopt new technology than younger individuals (2000). In particular, their research was focused on user reaction and technology usage behaviour in the workplace (Morris and Venkatesh 2000). The study was conducted over a 5 month period with a sample of 118 workers, who could voluntarily opt to use a new software in the firm analyzed (Morris and Venkatesh 2000). In the short term, Morris and Venkatesh reported significant differences in accepting new technologies in the workplace between younger and older workers using hierarchal regression analysis (age is a continuous value) (2000). Older workers resisted adopting the new technologies and opted to continue to use the traditional methods (Morris and Venkatesh 2000). In the long term, after three months of experience with the new technology, the older workers showed similar attitudes to the younger workers and were more inclined to accept using the new technology (Morris, Venkatesh 2000). This research suggests that it is important to collect demographic information on age when collecting primary data, as age influences the attitudes of accepting new technologies in the workplace.
2.6 The Rogers Five Forces: Diffusion Theory 2.6.1 Introduction
At this point, this dissertation returns to the main framework used to evaluate employee attitudes from the problem statement. This begins with explaining the theory of diffusion of technologies by Rogers. This includes his five step decision process and the five forces theory used in this dissertation (1995). After the general five forces theory is explained, this section
dedicates a section to a deeper explanation of each of the five forces. This information is later used to select hypotheses, presented in the following chapter.
2.6.2 Everett Rogers and the Diffusion of Technology
Everett Rogers’ conducted research on the diffusion of innovations to ultimately provide insight into how to speed up the rate of diffusion of an innovation within a social system (Rogers 1995). In this case, the social system being examined is the work place, and the innovation being investigated is Web 2.0 communication and collaboration tools. It is important to note that Rogers uses the word “innovation” interchangeably with “new
technology”; as discussed in a chapter on his research’s criticisms, he does not want to make the assumption that the technology being investigated is an “innovation” that completely annihilates the previous standard (100% adoption) or that while the innovation is diffusing it is becoming reinvented and thus changes the data collected (Rogers 1995). Rogers has designed several models to illustrate why and how fast technology diffuses within a social system, and his work extensive work on diffusion is considered the current standard (1995).
Everett Rogers developed an innovation-decision process to understand how a decision-making unit ultimately decides to adopt a new technology (1995). Potential technology adopters go through five steps before ultimately deciding to adhere to a new technology, being: 1. Knowledge, 2. Persuasion, 3. Decision, 4. Implementation and 5.Confirmation (Rogers 1995). Rogers explains the five steps; knowledge consists of the initial exposure to the basic idea of the innovation and its function, persuasion consists of establishing an attitude, either favourable or unfavourable, toward the innovation. The decision step explains the activities the adopter engages in to choose to adopt or reject the innovation. Lastly, the implementation step is the individual actually putting the technology to use, and confirmation is reinforcing the innovation decision (Rogers 1995).
For this dissertation, the perception (attitudes) portion of the innovation-decision process is investigated, in order to understand employee attitudes on the topic of Web 2.0 (Rogers 1995). Rogers isolated five attributes of innovations that were universally relevant, mutually
exclusive and but also interrelated (1995). These are called the Rogers Five Forces: relative advantage, compatibility, complexity, trialability and observability (Rogers 1995). The rate of
adoption within a social system increases the higher the perceived relative advantage, compatibility, trialability, observability and lower complexity (Rogers 1995). Rather than using this attitude information to understand to its full extent to understand the rate of
adoption, this dissertation simply investigates the attitudes in order to understand the decision, or willingness, to adopt.
2.6.3 Relative Advantage
Relative advantage is the first of the Rogers five forces. He defines relative advantage as the degree to which an innovation is perceived as superior to the idea preceding it (1995). He states that relative advantage can have many facets, most notably being economic status, social status and superior functionality (Rogers 1995). He presents the example of the power of social status – this is purely the cause of most purchases of designer clothing, since there is rarely ever any superior functional benefit (Rogers 1995). Evidently, if one is able to perform a function in a more efficient way than before, such as a decrease in discomfort, saving
time/effort or speeding up the immediacy of the reward, there is a perceived relative advantage according to Rogers (1995). Also, a relative advantage can be perceived in attempting to avoid the possibility of some future event, otherwise known as preventative innovation (Rogers 1995). Relative advantage is a test of the reward or punishment present in the adoption of a technology (Rogers 1995). Therefore, Rogers identifies three markers of relative advantage: economic, social status and functionality (1995).
In order to identify further narrow down which would be the best possible relative advantages to investigate for Web 2.0 collaboration and communication technologies, the McKinsey Quarterly Web 2.0 survey reported in Spring 2011 and Stephan Andriole’s survey from 2010 is used for further inspiration. Respondents were asked to identify where benefits were
achieved using Web 2.0 technologies either for internal, customer-related purposes or external purposes (McKinsey Quarterly). According to McKinsey’s survey, it seems that economic profitability, facilitating and accelerating communication and speeding up operations were reported notable benefits from using Web 2.0 technologies (McKinsey Quarterly). Andriole, his survey methods already explained in the collaboration and communication tool section, evaluated the utility of the tools using four measures: the ability to coordinate discussions, the ability to reach more people faster, the ability to synchronize projects and tasks, and the ability
to audit communication streams (2010). This ability is evaluated on a four-point scale, from “not at all” to “a great deal”. Results from 76 executives show that out of the four areas, the majority of respondents declare a “somewhat” improvement in all areas; coordinating discussions, reaching people faster, and synchronizing projects and audit communications streams (Andriole 2010).
Using the three above stated sources of what constitutes a relative advantage, the following advantages assume to be in common: profitability (lowering costs), accelerating
communication exchange, facilitating collaboration, synchronizing tasks and exchanging information. This dissertation assumes that this is a fair way to evaluate relative advantage, and is the basis for the survey questions based on relative advantage.
2.6.4 Compatibility
Compatibility is the second listed Rogers five forces (1995). Rogers noted that innovations are rarely adopted if they go against cultural values in a social system, despite their functionality (1985). An example is the failed adoption of boiling water in a Peruvian Village – despite its proven effectiveness to dissuade diseases such as typhoid, boiling water simply did not fit with the culture, which believed that “hot” foods are only for the sick, not for preventative
measures (Rogers 1985).
Apart from cultural values, radical new ideas have a higher level of risk associated with them (Rogers 1985). Thus, the rate of adoption of an innovation is highly dependent on the idea that it supersedes (Rogers 1985). As Rogers states, “one cannot deal with an innovation except on the basis of the familiar and the old fashioned” (1985). This compatibility between the old and the new can either speed up, or delay the rate of adoption (Rogers 1985).
Thus, to answer this research question, we assume that evaluating whether the company has the resources available and the appropriate technologic culture to adopt the technology, and whether the individuals’ job requires group work can measure compatibility. So for part a) of the research question, company resources, company culture and individual skill and work function is evaluated to evaluate perceptions on compatibility.
2.6.5 Complexity
The third Rogers five forces is complexity (Rogers 1985). Rogers’ definition of complexity is “[the] degree to which an innovation is perceived as relatively difficult to understand and use” (Rogers 1985). His logic is that the harder a technology is to understand, the less likely
someone would be willing to adopt it into their lives (Rogers 1985). Rogers states that the complexity of an innovation is negatively related to the rate of adoption (Rogers 1985).
2.6.6 Trialability
Trialability is the fourth Rogers five forces (1985). Trialability implies the possibility of conducting a trial, or experimental period, with the technology seeking diffusion (Rogers 1995). Rogers states that through the use of trials, subjects decline their perceived risk of adopting a technology, as this allows hands-on insight to how the product may be useful for them – verbal descriptions may not be enough to grasp the value of an innovation (Rogers 1995). Rogers states that trialability is positively related to the rate of adoption (Rogers 1985).
In this case, this dissertation assumes that trialability can be evaluated with the user’s ability to browse content, publish content, and add to pre-published content, and thus this is what is evaluated in the survey. For example, whether a user can browse blogs, post blog entries, or comment on blog entries; whether a user can browse wiki pages, publish their own wiki page, and edit a wiki page; whether a user can browse pages on a social network, create their own profiles, or comment on existing data on social networks. Therefore, part a) of the question is evaluated by understanding the user’s ability to browse, add and add-to content on these Web 2.0 tools.
2.6.7 Observability
Observability is the fifth Rogers five forces (1985). Rogers defines observability as “[the] degree to which the results of an innovation are visible to others” (Rogers 1985). Simply stated, if a subject sees the innovation being used, there is a higher likelihood that they themselves may consider to using it, for a plethora of reasons (Rogers 1995). Seeing an innovation used by another person diminishes the uncertainty of the adoption of the product (Rogers 1985).
This dissertation assumes that whether someone has seen or heard of the tool from another person before is a sufficient way to evaluate observability from others.
2.6.8 Conclusion
Section 2.5 was dedicated to explaining the main framework used in the research questions, the Rogers five forces. It began by explaining the general theory, and then proceeding to explain each individual force according to the research questions, which is why the rest 2.5 is divided by research question.
2.7 Conclusion
In summary, the above sections established which tools should represent Web 2.0 communication and collaboration tools; blogs, wikis and social networks. Then, the
importance of increasing employee usage rates and considering employee perceptions in the formation of technology strategies was highlighted in this chapter, to emphasize the
importance of answering the research question. The last section in this chapter was dedicated to explaining Rogers five forces theory in detail. The next chapter is explains the methodology in order to evaluate part a) and b) of each of the above research questions.
3. Methodology and Data Collection
3.1 Introduction
This chapter explains how the research questions are analyzed in the following chapter, Results’ Analysis. The first section begins by explaining the procedure used to analyze the research questions. The second section justifies the selection of this particular procedure. The third section presents propositions based on the previous research done on the research questions and hypotheses according to these propositions. The fourth section explains the statistical parameters which are applied to the hypotheses during the analysis. The fifth section characterizes the sample population from the primary data collected. Lastly, the sixth section explains limitations with using this methodology.
3.2 Research Design and Statistical Procedures 3.2.1 Introduction
Recalling the research questions listed in the introduction, there are two parts to every research question. The first part evaluates overall perception of each tool according to one of the five Rogers forces. The second part evaluates whether said Rogers five force is correlated with the willingness to adopt the tool. This section explains the procedure that is used to answer both parts of each of the research questions. It begins by presenting the dissertation’s research model. The survey design is then explained along with the particular procedure that is applied to the data collected from the survey.
3.2.2 Research Model
This dissertation uses the model below in order to answer the problem statement:
Discussion of the PS What are the
perceptions of web 2.0 communication
/collaboration tools and which
forces affect employee’s willingness to adopt? Statistical Analysis Blogs Wikis Social Networks Perceptions Data
Survey Relative Advantage Compatibility
Complexity Observability
Trialability
The problem statement, presented on the left, is answered by gathering primary data based on a survey. The survey evaluates perceptions on the three tools according to the Rogers five forces. Recall that the five forces are also the structure of the research questions. The outputted perception data is then analyzed using statistics. At this point, the dissertation returns back to the problem statement and the findings are discussed.
3.2.3 Survey Design
To suggest an answer to both parts of the research question, primary data is collected via an online survey on Google Forms. There is a page dedicated to each tool. Users are asked whether they already use the tool in the workplace (yes or no), and then are asked several questions based on the Likert scale dedicated to four of the five forces: relative advantage, complexity, trialability and observability and also questions the overall willingness to adopt the tool in the workplace. A fourth page evaluates compatibility (also using the Likert scale) as it would be redundant to repeat this step for each tool due to the nature of the force, and also questions the age of the respondent. Appendix D breaks down each question and what each question evaluates. The survey was distributed online via LinkedIn, on a McMaster University forum, and throughout my e-mail contacts. Please refer to chapter 3, section 7 for important notes about the limitations of this method.
3.2.4 Research Question Response Procedure
The data collected from the survey is exported into Microsoft Excel. First, Likert scale answers are coded from 1-5: 1 – Strongly Disagree, 2 – Disagree, 3 – Neither Agree nor Disagree, 4 – Agree and 5 – Strongly Agree. A few of the questions operate on a reverse scale, as justified in chapter 3, section 3.5 below. Answers are then divided into separate books by age; under 18, 19-29, 30-49 and 50+, and by separate sheets according to each tool. Unusable data is removed, namely respondents who have not worked before or did not fill out all the questions in the compatibility section.
Since the dissertation focus on implementing these tools in the workplace, those who have responded “Yes” to the control question of whether they have used the tool in the workplace before, have been discluded from analysis. The data left over, namely those who have never used x tool before, is used to answer part a) and part b) of each research question.
All the questions evaluating each force are grouped together to calculate a score for each respondent using the median – this is referred to as the individual [force] score. For example, there are five questions evaluating “relative advantage” and for each respondent, the median is taken to represent that user’s perception of relative advantage of the tool – so each respondent has an individual relative advantage score. The median of all of the individual [force name] score is the overall [force name] score. There is also a median calculated for each of the questions that compose the force score. For example, since overall relative advantage score is evaluated by understanding the perception of cost-effectiveness, there is also an overall [question] score, in this case overall cost-effectiveness score. Lastly, there is an overall willingness to adopt score for every tool. These three scores help answer the research questions.
The overall [force] score answers part a) of each question. The overall [question] score provides insight as to where the score came from, to more specifically understand the overall perception of each tool.
Part b) is answered by running a regression analysis on the overall force scores. Each
individual force is treated as an independent variable, and the willingness to adopt score is the dependent variable. This is done for each the force and the willingness to adopt for each tool. This results in three multiple regression models, which are tested for significance. Using Excel’s ANOVA output, the models and then forces whose coefficients pass the significance test (explained in chapter 3 section 5) are said to be correlated with the willingness to adopt. Then, these results are analyzed in the following chapter, results’ analysis.
3.2.5 Conclusion
The sections above outlined the structure of the survey, and the procedure used to analyze the primary data derived from the survey. This primary data is necessary in order to answer the research questions, and thus the problem statement of this dissertation. The following section explains why this procedure was chosen; the justification section.
3.3 Research Model and Statistics-Related Justifications 3.3.1 Introduction
This section is devoted to justifying the four principal reasons for following the procedure mentioned above. First, the overall inspiration for the particular model is explained. Then, reasoning for the Likert scale particulars are presented. Then, the choice of using multiple regression models in particular as opposed to other methods is discussed. Lastly, some special treatments of the data are discussed.
3.3.2 Overall Model Inspiration
The statistical procedure chosen to answer part b) of the research questions, to understand which factors impact willingness to adopt, is inspired after customer satisfaction surveys. These surveys ask questions concerning quality dimensions (such as professionalism, accessibility, etc.) and see how much each dimension is correlated with the overall customer service (Hayes 1998). This information can then be interpreted to find what areas need more attention, etc. (Hayes 1998). The same idea is applied to this survey; rather than quality dimensions, there are five forces, and instead of overall customer service, we measure willingness to adopt.
3.3.3 Likert Scale Interpretation
In this dissertation, the Likert scale it is treated as interval data, rather than ordinal. There is much controversy whether this is appropriate or not, as it is often done (Jamieson 2004). Since the regression analysis is only used to see whether there is a correlation or not, rather than how much of a correlation, this dissertation treats the data as interval.
Furthermore, the median has been picked as the method to measure central limit, as opposed to the mode or the mean. The mean is not suggested as the best measure of data centrality with Likert scales as it becomes difficult to interpret what the numbers mean (Hayes 1998). The mode is easiest to interpret according to the Likert scale, when looking at the data as a whole the median seems to best represent the findings.
Lastly, a 5-point Likert scale has been chosen. Scores of 1 and 2 on the Likert scale, corresponding to strongly disagree and disagree respectively, are sometimes referred to as “negative” perspectives in this dissertation. In addition, scores of 3 on the Likert scale, representing neither agree nor disagree, are interpreted as a neutral stance on the force analyzed. Lastly, 4 and 5, agree and strongly agree on the Likert scale respectively, are sometimes referred to as positive stances on the forces.
3.3.4 Multiple Regression Choice
For the correlation analysis, the data was analyzed using multiple regression analysis,
appropriate for interval treated data. Correlation analysis does not take into account cause and effect, and thus it would not be appropriate to use (Hayes 1998). In addition, simple regression analysis is not as appropriate as multiple regression analysis, since the Rogers theory states that the independent variables tend to overlap slightly which makes multiple regression analysis a more appropriate choice (Hayes 1998, Rogers 1995).
3.3.5 Special Treatments of Data
The following questions from the survey (Appendix D) used reverse scales when they were coded: “I find it difficult to use ____”, “My workplace follows strict work procedures”, “My workplace is very traditional”. This means that instead of 1 on the Likert scale representing “Strongly Disagree”, in this case it represented “Strongly Agree”. This was done in order to simplify the report of findings, so higher Likert scale intervals would suggest higher five forces scores, which by the theory improves the willingness to adopt (Rogers 1985).
3.3.6 Conclusion
The above information for the justification section aimed to clarify why the procedure
explained in section 2 was selected. It cited the procedures’ inspiration, clarified the choice of use of the controversial Likert scale, explained why the dissertation opts to use multiple regression analysis and explains some special treatments of the data. At this point, it is time to present the actual hypotheses that are tested using this procedure.
3.4 Hypotheses
Hypotheses are necessary to answer part b) of the research questions, which focus on statistical correlations. The hypotheses are based on the research done on the five forces already presented in the Literature Review (Chapter 2). To develop the hypotheses, first the research question is presented, and then propositions formed based on the five forces literature review research. The hypotheses are formed from these propositions.
Each question has two hypotheses. The null hypothesis implies that b0, the slope of the
independent variable’s coefficient according to the ANOVA output, is 0. This suggests no correlation between the independent and the dependent variable. The dependent variable is always the willingness to adopt [tool]. H1 suggests that b1 ≠ 0, implying there is correlation
between the independent and the dependent variable. There are two hypotheses for every research question. Chapter 4 presents the findings for these hypotheses.
1. Do employees a) perceive a relative advantage in the use of Web 2.0 tools, and b) is it correlated with their willingness to adopt it blogs/wikis/social networks in the workplace?
Revising from chapter 2, section 6.3, the Rogers five forces theory states that relative
advantage positively influences the decision to adopt (Rogers 1995). Thus the proposition and hypotheses for part b) of the research question is (Rogers 1995):
Proposition 1: Perceived relative advantage is correlated with willingness to adopt Web 2.0 communication/collaboration technologies.
H0: Relative advantage b0 = 0; Perceived relative advantage is not correlated with the
willingness to adopt blogs, wikis or social networks.
H1: Relative advantage b1 ≠ 0; Perceived relative advantage is correlated with the willingness
2. Do employees a) perceive the tools as compatible with the nature of their work and the organizations values, and b) is this compatibility correlated with their willingness to adopt blogs/wikis/social networks in the workplace?
For part b) of the research question, based on research from section 2.6.4, the Rogers five forces theory states that an individual’s compatibility with the technology influences the decision to adopt (Rogers 1995). Thus the proposition and consequent hypotheses are:
Proposition 2: Perceived compatibility of Web 2.0 technologies is correlated with willingness to adopt Web 2.0 tools.
H0: Compatibility b0 = 0; Perceived compatibility is not correlated with the willingness to
adopt blogs, wikis or social networks.
H1: Compatibility b1 ≠ 0; Perceived compatibility is correlated with the willingness to adopt
blogs, wikis or social networks.
3. Do employees a) perceive the tools as difficult to use [complexity], and b) is it correlated with their willingness to adopt blogs/wikis/social networks in the workplace?
The scale has been reversed for this section, and this is justified in chapter 3 section 3.5. This is simply to make it so that high scores in all five areas would correspond to a high willingness to adopt to facilitate the statistical analysis. According to the theory from chapter 2 section 6.5, complexity is negatively related with the decision to adopt technologies. Thus the proposition and hypotheses according to this theory are:
Proposition 3: Perceived complexity [ease of use] of Web 2.0 communication technologies is correlated with the willingness to adopt in the workplace.
H0: Complexity b0 = 0; Perceived complexity is not correlated with the willingness to adopt
blogs, wikis or social networks in the workplace.
H1: Complexity b1 ≠ 0; Perceived complexity is correlated with the willingness to adopt blogs,
4. Do employees a) feel they know how to use the tools [trialability], and b) is it correlated with their willingness to adopt blogs/wikis/social networks in the workplace?
According to the theory Rogers’ theory covered in chapter 2, section 6.6, trialability influences the decision to adopt (Rogers 1995). The proposition and hypotheses become: (Rogers 1995):
Proposition 4: Perceived trialability is correlated with the willingness to adopt Web 2.0 technologies.
H0: Trialability b0 = 0; Perceived trialability is not correlated with the willingness to adopt
blogs, wikis or social networks.
H1: Trialability b1 ≠ 0; Perceived trialability is correlated with the willingness to adopt blogs,
wikis or social networks.
5. Do employees a) perceive others using the tools [observability], and b) is it correlated with their willingness to adopt blogs/wikis/social networks in the workplace?
The theory from chapter 2, section 6.7 states that observability influences the decision to adopt (Rogers 1995). The proposition and consequent hypotheses are:
Proposition 5: Perceived observability is correlated with the willingness to adopt Web 2.0 technologies.
H0: Observability b0 = 0; Perceived observability is not correlated with the willingness to
adopt blogs, wikis or social networks.
H1: Observability b1 ≠ 0; Perceived observability is correlated with the willingness to adopt
blogs, wikis or social networks.
The hypotheses above are tested according to the parameters discussed in the next section, Unit of Analysis for each research question.
3.5 Unit of Analysis
A minimum sample population of 30 was established in order to comply with central limit theorem for normal distribution of population. The population is unknown.
The ANOVA output of the regression analysis is analyzed to answer part b) of the research questions. The returned r value (Multiple R in Excel) of the model explains how linear the data is, as it represents the slope of the line (Chandler-Gilbert). The r2 value highlights how accurate the linear model is at explaining the variance (Chandler-Gilbert). The data is treated at a 95% confidence level (naturally, at a significance level of α = 0.05). The slope of each independent variable (bn, the correlation coefficient) is analyzed to see whether it is correlated
with the dependent variable. The test to see if the slope is accurate is done by investigating the confidence interval. If 0 is contained within the confidence interval at 95%, then this means that there is probably no correlation between the independent and dependent variables. The P-test is then done to see the likelihood of whether output from the confidence interval is accurate. If p-value is less than the 0.05 significance level, then the data is considered significant and thus correlated with the dependent variable at the 95% confidence level.
The forces are represented as follows (independent variable, coefficient); relative advantage (x1), compatibility (x2), complexity (x3), trialability (x4) and observability (x5).
3.6 Sample Population Characteristics
There were a total of 268 respondents to the survey. A number of respondents were excluded from the analysis either due to age or improperly filled out forms. The age group Under 18 and 50+ only returned 5 and 21 respondents respectively. According to the previous section, Unit of Analysis, these respondents could not be included in the analysis because they did not meet the sample population requirements (n > 30). Moreover, 26 and 3 respondents from the 19-29 and 30-49 age group were not included due to their failure to answer all questions. Therefore, only 212 respondents were eligible for analysis. Appendix C presents the details of response rates according to age and tool.
The sample population investigated is aged 19-49. This represents two age groups in the survey: 19-29 and 30-49. The survey was presented to McMaster University students via
forum, to McMaster University alumni via LinkedIn and e-mailed to former colleagues and their respective networks. The majority of respondents are likely of Canadian nationality. It is assumed that all of the respondents are able to navigate the Internet and use computers, since they managed to complete the online survey. There is a high likelihood that the majority, if not all, respondents are either attending or graduated university students. Due to the nature of publishing links on the Internet, it is difficult to predict the population size. These distribution outlets were not only chosen simply due to the author’s available networks, but also since it is assumed that post-secondary students are most likely to be in an office setting when
employed. Naturally, these types of tools require accessibility to the Internet and group work to be used.
3.7 Limitations with the Procedure
The largest problem with this procedure is centered in the sample population evaluated. Note that the population surveyed was indiscriminate; the available data on Web 2.0 tool usage, the ones previously discussed in this dissertation, do not present data from particular sectors, industries or organizations, and thus to remain consistent, this survey did not collect
information on this either. It is limited to analyzing employee perception differences according to age.
All of the data was collected online, which needs to be considered when analyzing this data. Populations without much exposure to the Internet or computers are assumed to output significantly different results, when presented the same survey. Even more importantly, some of the data was collected using social networks (LinkedIn) which would definitely influence the scores for that category. This was done because the author of this dissertation was not confident in their ability to garner enough responses to be able to form an analysis at all, due to a lack of resources. This is a very profound bias. In retrospect, if time was not an issue, the surveys would have been distributed differently.
3.8 Conclusion
Establishing and justifying an appropriate methodology is essential to analyzing the data for the research questions. This chapter presented the procedure which is followed to do this, why this procedure was selection, the hypotheses for part b of the research questions, and some limitations with the logic of this section. The next chapter applies this methodology in order to come closer to solving the problem statement.
4. Results’ Analysis
4.1 Introduction
The previous chapter explained and justified the chosen methodology to answer the research questions. This chapter is dedicated to applying said methodology and presenting the results. Recall that every research question is divided into two parts, and is treated with different procedures. This chapter presents the results to these two tests according to the order of the research questions. Due to the nature of multiple regression analysis however, there are only three regression models to evaluate all of the five factors and the tools. As such, first the three tools regression models’ significance is presented. Then, the chapter is divided per research question and the procedure is followed as previously explained.
4.2 Multiple Regression Output Significance
For the full equation for each of the regression models, please see Appendix E. The results from the multiple regression models for each tool are shown below, in table 6. The r and r2 results displayed show how linear the models are. For the measures “Under 18” and “50+”, the sample population returned was inferior to 30.
Under 18 19-29 30-49 50+ r r2 Significance F r r2 Significance F
Blogs N/A 0.405 0.164 0.000 0.640 0.410 0.006 N/A Wiki N/A 0.619 0.383 0.000 0.267 0.071 0.792 N/A Social
Networks
N/A 0.342 0.118 0.207 0.723 0.522 0.000 N/A Table 6: Multiple Regression Model Significance
According to the table above (table 6), the information returned from 19-29 social networks, and 30-49 wiki’s are considered insignificant. Not enough of the variance in the dependent variable can be explained through the independent variables to be considered as a linear relationship, as seen by the F-test returning values above the significance level, α = 0.05. This information is thus not be mentioned in part b) of the analysis below, as it is already evident that there is no independent variable that influences willingness to adopt.
The models in bold, presented in table 6, represent statistically significant regression lines. The r and r2 values represent how linear the data is, and how much of the variance is explained through the regression line (Chandler-Gilbert). The main purpose of the research questions is not to explain the degree of correlation, however.
4.3 Findings 4.3.1 Introduction
This section is divided by each research question theme. Please keep in mind the information from the above section, which states that the exclusion of the part b) regression analysis for respondents age 19-29 for social networks and age 30-49 for wikis.
4.3.2 Research Question 1 – Relative Advantage
Research Question 1: Do employees a) perceive a relative advantage in the use of Web 2.0 tools, and b) is it correlated with their willingness to adopt it blogs/wikis/social networks in the workplace?
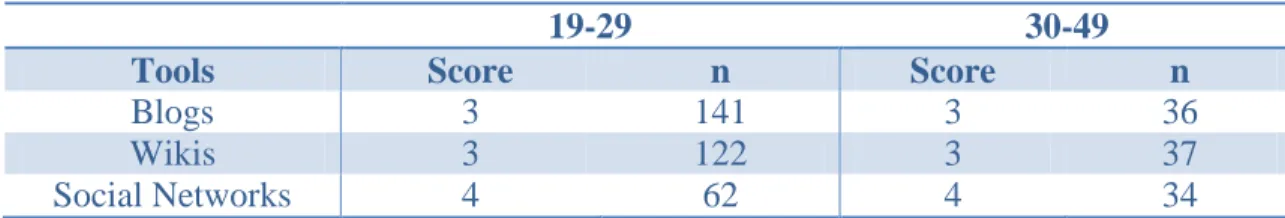
The following table, table 7, presents the median score for relative advantage in each age group and for each tool, in order to answer part a) of the research question.
19-29 30-49
Tools Score n Score n
Blogs 3 141 3 36
Wikis 3 122 3 37
Social Networks 4 62 4 34
Table 7: Relative Advantage Overall Perception Scores
The results returned from the users aged 19 -49 suggested that social networks have a relatively positive perceived relative advantage. The median returned, 4, corresponds to an “agree” on the Likert scale, suggesting that the sample population generally agrees that these tools are overall perceived as useful for communication and collaboration.
On the other hand, both blogs and wikis for those aged 19-49 returned medians of 3, which correspond to “neither agree nor disagree” on the Likert scale. This suggests that many users are unsure of whether there is a relative advantage or not in the use of these tools for
To see where the relative advantage is perceived, please refer to Appendix F. Overall, relative advantages in these Web 2.0 tools seem to be perceived the most in their ability to be cost-effective ways of communicating. Social networks aged 30-49, returned all five questions as 4s, suggesting that they agree that these tools bring all five of the relative advantages and none in particular is standout. With the rest of the respondents, the lowest values tend to appear in their ability to increase the speed and the ease of communication. Aside from the results displayed from 19-29 year olds in the social networking category, subjects neither agree nor disagree with blogs or wikis’ abilities to synchronize or exchange information.
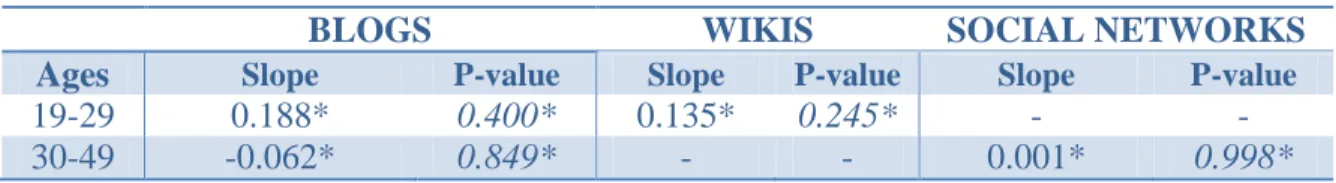
Part b) of the research question is answered in the next table, table 9. This investigates whether the willingness to adopt a certain tool is correlated with the perceived relative advantage. Below, the multiple regression results are presented, recall all insignificant models have not been included.
BLOGS WIKIS SOCIAL NETWORKS
Ages Slope P-value Slope P-value Slope P-value
19-29 0.296 0.005 0.51 3.780E-08 - -
30-49 0.052* 0.820* - - 0.138* 0.511*
Note: Those labelled with * contain 0 in their confidence interval. Table 9: Relative Advantage Regression Output
Due to a high probability that there is no linear relationship between the independent and dependent variables, data from the 30-49 age groups for blogs’ and social networks suggests that there is no linear relationship between willingness to adopt and relative advantage, and thus H0 is accepted.
In the 19-29 age category, both blogs and wikis’ reported a positive linear relationship
between relative advantage and willingness to adopt. For every increase in relative advantage for blogs, there is an estimated 29.6% increase in the willingness to adopt. Likewise, for every increase in relative advantage for wikis, there is an estimated 51% increase in the willingness to adopt.
In conclusion, for part a), users generally agree that there is a relative advantage in communication and collaboration with the use of social networks. For wikis and blogs, subjects debate whether there is or is not a relative advantage in the usage of these tools. The