A Work Project, presented as part of the requirements for the Award of a Master Degree in
Economics from the NOVA – School of Business and Economics
MEASURING AGEING BY A HANDSHAKE
THE IMPACT OF SARCOPENIA ON HEALTHY AGEING
INGRID KNUDSEN AAS, 3105
A Project carried out on the Masters in Economics Program, under the supervision of:
Professor Pedro Pita Barros
Lisbon, 23
rdof May, 2018
1Aknowledgements
I would like to express my sincere gratitude to my advisor Professor Pedro Pita Barros, for the continuous support, guidance and immense knowledge during the thesis work. I wish to thank Judite Gonçalves and Sara Almeida for helpful comments regarding the healthy ageing indices. Finally, I thank my family for their support and encouragement throughout my study.
This paper features a supplementary appendix, which contains more detailed data description and additional results. This paper uses data from SHARE Waves 1, 2, 4, 5 and 6
(DOIs: 10.6103/SHARE.w1.610, 10.6103/SHARE.w2.610, 10.6103/SHARE.w4.610, 10.6103/SHARE.w5.610, 10.6103/SHARE.w6.610), see Börsch-Supan et al.
(2013) for methodological details.
This paper uses data from the generated easySHARE data set, see Gruber et al. (2014) for methodological details. The easySHARE release 6.1.0 is based on SHARE Waves 1, 2, 3 (SHARELIFE), 4, 5 and 6
(DOIs: 10.6103/SHARE.w1.610, 10.6103/SHARE.w2.610, 10.6103/SHARE.w3.610, 10.6103/SHARE.w4.610, 10.6103/SHARE.w5.610, 10.6103/SHARE.w6.610)
The SHARE data collection has been primarily funded by the European Commission through FP5 (QLK6-CT-2001-00360), FP6 (SHARE-I3: RII-CT-2006-062193, COMPARE: CIT5-CT-2005-028857, SHARELIFE: CIT4-CT-2006-028812) and FP7 (SHARE-PREP: N°211909, SHARE-LEAP: N°227822, SHARE M4: N°261982). Additional funding from the German Ministry of Education and Research, the Max Planck Society for the Advancement of Science, the U.S. National Institute on Aging (U01_AG09740-13S2, P01_AG005842, P01_AG08291, P30_AG12815, R21_AG025169, Y1-AG-4553-01, IAG_BSR06-11, OGHA_04-064, HHSN271201300071C) and various national funding sources is gratefully acknowledged (see www.share-project.org).
Measuring Ageing by a Handshake
The Impact of Sarcopenia on Healthy Ageing
Ingrid Knudsen Aas
Abstract
Sarcopenia, an age-related condition characterized by low levels of muscle mass, carries personal
and financial costs. Understanding the condition and its consequences is essential to implement
successful interventions for people with and people at risk of developing sarcopenia. Using data
from SHARE of people aged 50 and older, the effect of sarcopenia on ageing is estimated. Results
suggest that sarcopenia has a significant negative impact on ageing. Quantitatively, the effect of
sarcopenia on the healthy ageing indices is equivalent to having aged approximately one decade.
Through the estimation of a production function of sarcopenia, the importance of physical activity
as prevention is confirmed.
Keywords: sarcopenia, healthy ageing, Selfie Aging Index, Active Ageing Index
1. Introduction
Ageing populations are among the greatest challenges of the 21
stcentury. The European
Commission (2017) projects the old-age dependency ratio to rise from 29.6% in 2016 to 51.2%
in 2070, inter alia, due to increased life expectancy.
2This transition poses new challenges for the
future. For instance, increased costs of health care and a diminishing work force are creating a
need for governments to address age-related health problems and to promote healthy ageing.
This work project is motivated by the hypothesis that sarcopenia has a negative impact on
healthy ageing. Reduced muscle mass is an expected consequence of ageing, and sarcopenia is an
age-related condition characterized by substantial loss in muscle mass. It is a fairly new concept,
and there is no consensus on the definition. The European Working Group on Sarcopenia in Older
People (EWGSOP) (Cruz-Jentoft et al. 2010) defines sarcopenia as: “a syndrome characterized
by progressive and generalized loss of skeletal muscle mass and strength with a risk of adverse
outcomes such as physical disability, poor quality of life and death”. According to EWGSOP,
sarcopenia leads to falls and fractures, admission to nursing homes, loss of independence and high
cost of health care. With the anticipated ageing population, the prevalence of sarcopenia is
expected to rise.
32 Old-age dependency ratio: people aged 65 or more relative to those aged 15 to 64.
3 EWGSOP estimates a prevalence of sarcopenia worldwide of more than 200 million in the next 30 years. According
Results from this work project point towards sarcopenia having a negative impact on
healthy ageing. The effect of sarcopenia on the healthy ageing indices is equivalent to
approximately one decade of age increase, signalizing the importance and widespread
consequences of the condition.
The work project is organized as follows: First, a literature review on the concept of
healthy ageing, the Selfie Aging Index, the Active Ageing Index and a production function of
sarcopenia is presented. Second, the methodologies used for the different approaches are
described. Third, the results of the models are presented. Finally, limitations and concluding
remarks with possible implications are discussed.
2. Literature Review
Healthy ageing is an extensively used term, although there is no complete consensus on the
definition. The World Health Organization (WHO, 2015) defines healthy ageing as “the process
of developing and maintaining the functional ability that enables wellbeing in older age”.
Functional ability captures an individual’s ability to “meet their basic needs, to learn, grow and
make decisions, to be mobile, to build and maintain relationships and to contribute to society”
(WHO 2015). The Healthy Ageing Project, carried out by the Swedish National Institute of Public
Health (2007), defines healthy ageing as “the process of optimizing opportunities for physical,
social and mental health to enable older people”.
4In practice, healthy ageing is about acquiring
a healthy life style, working longer and having an active life after retirement. Healthy ageing is
not a static concept, as functional abilities are expected to decline with age, life choices and other
interventions (WHO 2015).
5Older people with an active lifestyle seem to be more motivated to
participate socially, engage in healthy behaviors and have in general less problems dealing with
difficulties (Paúl, Ribeiro, and Teixeira 2012). Optimizing the healthy ageing potential could
potentially reduce health care costs.
4 The Healthy Ageing Project is a project under the EU Public Health Programme aiming at promoting healthy ageing.
The project was initiated by the Swedish National Institute of Public Health and is co-funded by the European Commission
.
5 In 2002 WHO replaced the term “active ageing” with “healthy aging”. Some organizations may only refer to one
The Active Ageing Index (AAI) and the Selfie Aging Index (SAI) are two approaches
used to measure healthy ageing. The effect of sarcopenia on healthy ageing can be measured using
the two indices. The appliance of both methods may provide a more comprehensive notion of
healthy ageing and add extra validity to the estimation results. Additionally, the usage of both
proxies overcome the shortages of each method.
6The SAI, developed by Gonçalves et al. (2017), is a multidimensional index based on
self-assessed health indicators allowing people to take a selfie of their ageing status. The index
contains indicators of three domains: biological, psychological and social, and is based on the
Biopsychosocial Assessment Model.
7The SAI uses self-assessed health as the dependent variable
to establish the sources of each element of the index. Numerous papers point to self-assessed
health as a good proxy for healthy ageing. For example, Pfarr, Schmid, and Schneider (2012) find
self-assessed health to be a suitable predictor of the old-age health status.
8The AAI is a tool created by United Nations Economic Commission for Europe (UNECE)
and the European Commission (EC, 2015) to “measure the untapped potential of older people for
active and healthy ageing across countries”. The index is a weighted average of four domains:
(1) employment, (2) participation in society, (3) independent, healthy and secure living and (4)
capacity and enabling for active ageing. Each domain, composed of different indicators, represent
discrete features of active ageing.
9Having presented the two indices that will be used to disclose if sarcopenia has an impact
on healthy ageing, the focus is turned to the production function of sarcopenia. A production
function may provide information on the relevant predictors of sarcopenia. Finding relevant
factors may also help identifying intervention strategies. The production function is based on the
well-known Grossman model (Grossman 1972), which establishes the relation between health
6 Critique of the individual level AAI points to some of the indicators not being appropriate on the individual level.
For example, being employed (1st domain: Employment) may not be relevant to analyse the respondent’s perception
of active ageing. Additionally, the individual level AAI do not exploit the full variation of the data because they are dichotomized (Gonçalves et al. 2017).
7 The Biopsychosocial Assessment Model was first proposed by Engel (1977) whose main aim was to develop a
model that captured the biological, psychological and social aspect of the individuals health.
8 Self-assessed health has also been found to be a good predictor of mortality (Mossey and Shapiro 1982).
9 The domains and corresponding weights are decided by a group of experts based on political relevance. The experts
consist of academics, statisticians and representatives from international organisations such as OECD, EC and UNECE.
and different health inputs. This paper applies a simple production function approach in which
sarcopenia is replacing health as the dependent variable. To obtain suitable explanatory variables,
existing, but limited literature on sarcopenia is reviewed. Among the inputs of the production
function of sarcopenia are physical activity, income and body mass index.
Physical activity could reduce the likelihood of developing sarcopenia. Sarcopenia is
found to be preventable by early intervention through nutrition and physical activity (Martone et
al. 2015; Yu et al. 2016). Ryu et al. (2013) also finds, after adjusting for covariates, that Koreans
older than 65 years doing physical activity are less likely to have sarcopenia.
Income is also included in the production function. People with higher income are found
to do more exercise (Downward 2007). Considering that existing literature points at physical
activity being preventive of sarcopenia, it is of interest to check if income plays a role on the
likelihood of developing sarcopenia.
The relation between body mass and sarcopenia is frequently mentioned in the literature,
in particular, sarcopenia co-occurring with either a high or low body mass index (BMI). High
BMI in older age, with increased risk of obesity and heart trouble, can increase the risk of
sarcopenia (Ryu et al. 2013). Low BMI can be a sign of poor nutrition and little food intake, which
in turn again can lead to loss of muscle mass and sarcopenia (Muscaritoli et al. 2010).
According to EWGSOP, sarcopenia is related to older age, poor life quality and
admissions to nursing homes. All the aforementioned factors will be included to test if the
relations found in existing literature hold for the SHARE sample.
3. Methodology
3.1 Data
To measure the impact of sarcopenia on healthy ageing, data from the Survey of Health, Ageing
and Retirement in Europe (SHARE) is used. The dataset consists of data from six waves on health
and socio-economic factors for Europeans aged 50 years and older.
10SHARE contains data on
handgrip strength which can be used to define sarcopenia. To measure the grip strength,
respondents were asked to push as hard as they possibly could on a dynamometer while standing
up. Respondents with sarcopenia are identified using EWGSOP´s definition of sarcopenia; grip
strength lower than 30 kg for men and 20 kg for women. Due to biological differences, men and
women have different cut-off values, hence each gender is analyzed separately.
The variable of
interest, sarcopenia, is a dummy variable taking value 1 if the individual has sarcopenia and 0
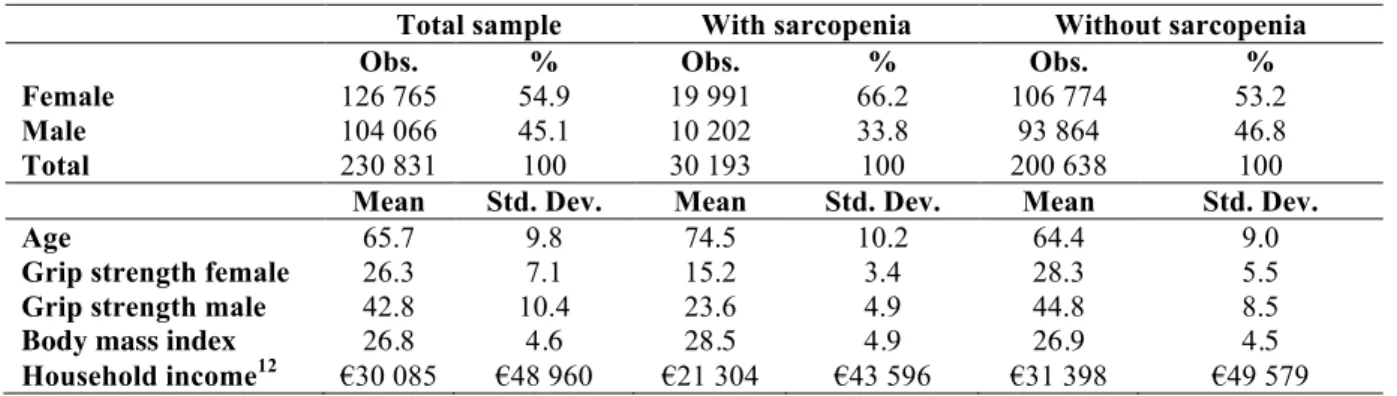
otherwise. A selection of descriptive statistics is presented in Table I. Approximately 13% of the
total sample have sarcopenia, 15.8% of all women and 9.8% of all men, respectively.
11Table I. Descriptive Statistics
Total sample With sarcopenia Without sarcopenia Obs. % Obs. % Obs. % Female 126 765 54.9 19 991 66.2 106 774 53.2 Male 104 066 45.1 10 202 33.8 93 864 46.8 Total 230 831 100 30 193 100 200 638 100 Mean Std. Dev. Mean Std. Dev. Mean Std. Dev.
Age 65.7 9.8 74.5 10.2 64.4 9.0
Grip strength female 26.3 7.1 15.2 3.4 28.3 5.5 Grip strength male 42.8 10.4 23.6 4.9 44.8 8.5 Body mass index 26.8 4.6 28.5 4.9 26.9 4.5 Household income12 €30 085 €48 960 €21 304 €43 596 €31 398 €49 579
SHARE is an unbalanced panel. Although the panel structure allows to follow the same
individuals over many waves, not all questions were asked in all waves and to all respondents.
Additionally, attrition reduces the size of the sample. Table II in the appendix lists the variables
that are crucial to build the econometric models and the documented loss of observations due to
the inclusion of these variables.
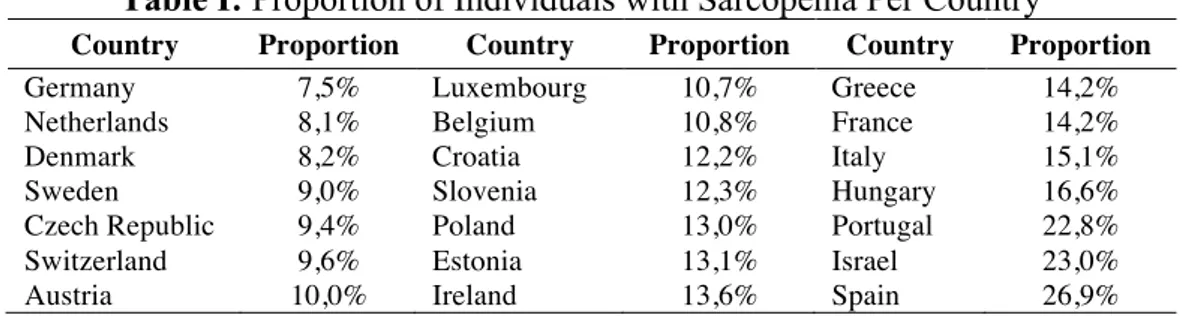
Note that the prevalence of sarcopenia is higher in the southern
parts of Europe, confirming previous findings of Andersen-Ranberg et al. (2009)
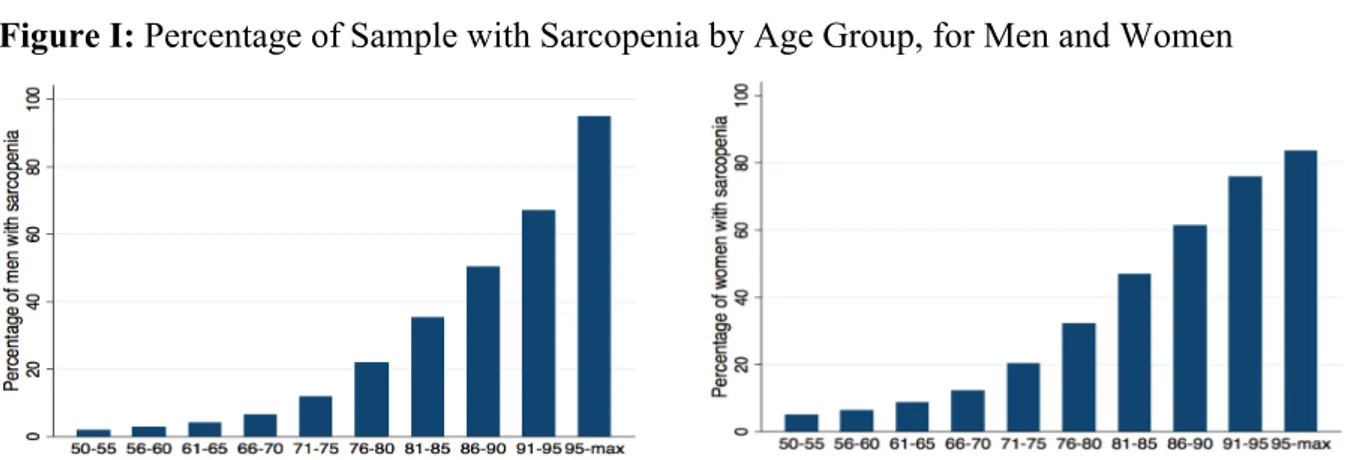
. 13Figure I displays the percentage of individuals with sarcopenia of the total sample by age
group and gender. As expected, people with sarcopenia are on average older. The charts
demonstrate that sarcopenia is highly correlated with age and that the prevalence of sarcopenia
11 The percentages are obtained from Table I and divided by the total sample.
13%: 30 193/ 230 831, 15.8%: 19 991/126 765, 9.8%: 10 202/104 066.
12 Household income is a SHARE imputed variable based on total monthly household income.
13 Table I in the appendix presents the proportion of individuals with sarcopenia by country. The prevalence of
sarcopenia is higher in the southern parts of Europe. In particular, Spain, Portugal and Israel have high proportions of individuals with sarcopenia. This confirms the findings of Andersen-Ranberg et al. (2009) that grip strength in northern and continental Europe is higher than in southern Europe.
increases progressively with age for men and women. The pattern in Figure I motivates for a more
detailed analysis of the relationship between ageing and sarcopenia.
14Figure I: Percentage of Sample with Sarcopenia by Age Group, for Men and Women
One of the hypotheses of this work project is that sarcopenia has a negative impact on healthy
ageing. Prior to any estimations, Figure II plots the variables self-assessed health and age for men
and women, with and without sarcopenia.
Figure II: Fitted Lines of Self-Assessed Health for Men and Women with and without
Sarcopenia
15Three clearly visible effects are present. First, men and women with sarcopenia (the two “flat”
lines) and men and women without sarcopenia (the two “steep” lines) do not have similar
self-assessed health. Second, there is a substantial but declining difference between the self-self-assessed
health for individuals with and without sarcopenia at the age of 50, pointing in favor of the
hypothesized effect. The difference is declining with age, reaching zero just before 100 years.
14 Figure II in the supplementary appendix with respective explanation illustrates the intensity of sarcopenia, hence
how far away from the cut-off value the handgrip strength is. The intensity can be viewed as a measure of the severity of sarcopenia. Most individuals with sarcopenia in the SHARE sample have a less “severe” version of sarcopenia.
15 The ordered variable self-assessed health has the following values: (1) poor, (2) fair, (3) good, (4) very good and
(5) excellent. Note that Figure II is created for exposition purposes. In the econometric specifications, self-assessed
Third, the evolution of self-assessed health with age of individuals with sarcopenia is close to
horizontal. A possible reason for this is that the self-assessed health status is, on average, so low
that there is little room for deterioration.
Understanding how grip strength evolves over time also provides valuable insight on
sarcopenia. A fixed effect model with grip strength as the dependent variable is estimated for men
and women (see Table III in the appendix for estimation results).
16The explanatory variables
include age, sarcopenia and an interaction term between sarcopenia and age (𝑠𝑎𝑟𝑐𝑜𝑎𝑔𝑒). The grip
strength for men and women with and without sarcopenia is constructed as follows:
𝐺𝑟𝑖𝑝 𝑠𝑡𝑟𝑒𝑛𝑔𝑡ℎ
/0= 𝛽
3(𝑎𝑔𝑒) ∗ 𝑎𝑔𝑒
/0+ 𝛽
8(𝑠𝑎𝑟𝑐𝑜𝑝𝑒𝑛𝑖𝑎
/0) ∗ 𝑠𝑎𝑟𝑐𝑜𝑝𝑒𝑛𝑖𝑎
/0+ 𝛽
9(𝑠𝑎𝑟𝑐𝑜𝑎𝑔𝑒
/0) ∗ 𝑠𝑎𝑟𝑐𝑜𝑎𝑔𝑒
/0+ 𝛽
:(𝑐𝑜𝑛𝑠𝑡𝑎𝑛𝑡)
(1)
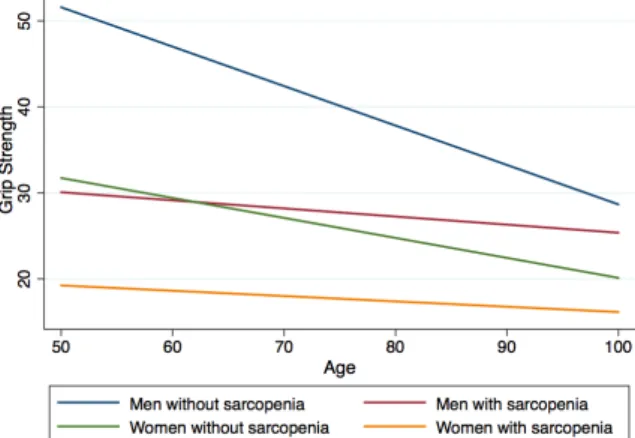
Using linear prediction, the grip strength is plotted in Figure III. Grip strength decreases with age.
There is a substantial difference in the slope of the grip strength, with a steeper slope for
individuals without sarcopenia for both men and women. The evolution of grip strength with age
follows the same pattern as displayed in Figure II of self-assessed health and age.
17Figure III: Grip Strength for Men and Women with and without Sarcopenia (in kg)
In sum, the trends revealed in the presented figures suggest that sarcopenia is related to poor health
outcomes. The following section explains the methodology of the models used to test if this is
16 A methodical detail worth mentioning is that none of the estimations in this paper include any kind of sampling
weights. The decision to not use weights is primarily based on Solon, Haider, and Wooldridges (2015) discussion of weights appliance. First, the objective of this paper is to capture the causal effect of sarcopenia, which is independent of weights, not to reflect the total population. Second, applying weights to the highly unbalanced panel is not desirable as that would lead to the sample being reduced significantly. Third, as some of the variables in the estimation are also used in the creation of the weights (gender, age etc.), this may disturb the weight structure and reduce the accuracy of the estimation coefficients.
true. First, the SAI and AAI are presented to establish if sarcopenia has an effect on healthy
ageing, followed by a production function of sarcopenia that may be useful to understand the
determinants and potential interventions of the condition.
3.2 Selfie Aging Index
Using the work of Gonçalves et al. (2017) as reference, the SAI is replicated. The dependent
variable, self-assessed health, reported as a five-level variable from poor to excellent, is recoded
to three levels (poor or fair – good – very good or excellent). The SAI is based on an ordered
probit model, predicting a selfie of each individual’s ageing status.
18The predicted latent variable
is then normalized to a 0 to 1 scale, 1 being the best self-assessed health and 0 being the worst
self-assessed health.
19The original SAI is constructed using SHARE. The variables used in the creation of the
SAI can be found in Table V in the appendix. The individual SAI score is obtained by inserting
personal characteristics into the model.
20An additional feature is the data added on grip strength
to analyze the effect of sarcopenia on the SAI. Another extension is the inclusion of all available
waves in the model.
21The SAI is originally developed for Portugal. To make it suitable for this
paper all SHARE countries are included, with time- and country dummies to control for time- and
place specific effect.
Robust standard errors were used in all models to control for
heteroscedasticity.
As previously mentioned, a limitation in using all waves is the large number of missing
values for some of the variables. Consequently, the sample size is heavily reduced. Given the
large number of missing variables, the SAI is predicted two times, one using the complete set of
covariates and one excluding variables with many missing values.
22The correlation between the
18 None of the models, except for the estimation of the grip strength (Table III in the appendix), uses fixed effect
specifications. Using fixed effect on a highly unbalanced panel will reduce the sample heavily. Even if fixed effect models capture the effect of unobserved heterogeneity, the number of unknown parameters will increase with the number of observations. Additionally, the specification do not allow for estimation of coefficients that have no within-subject variation (Hsiao 2007).
19 The rescaling of the SAI allows for a more intuitive interpretation and is obtained by plugging in theoretical
minimum and maximum values in the SAI, which is then normalized.
20 See Figure III in and Figure IV in the supplementary appendix the distribution of the SAI and an illustration on
the SAI in practice. For more details on the SAI, please refer to Gonçalves et al. (2017).
21 All waves (1 to 6), except for Wave 3 (SHARELIFE), are included in the model. Wave 3 diverges from the other
waves as it contains data on the respondents' life histories. The original SAI only uses the first four waves.
two predicted variables is high, suggesting a similar effect for both models.
23To capture the full
effect of the SAI, the model with the complete set of covariates is presented.
3.3 Active Ageing Index
The AAI is based on country-level average values of active ageing. Nonetheless, information on
micro-level can be useful to understand each individual’s ageing status and outliers, such as
people with sarcopenia. Therefore, following the method of Almeida and Barros (2015), the AAI
is transformed from aggregate to individual level. Nine indicators from SHARE were selected to
fit the four AAI domains. The number of missing values per variable was also considered in the
selection to avoid losing too many observations. The variables and the composition of the domains
can be found in Table V and Equation (4) in the appendix.
Two versions of the AAI are constructed, with different composition of the first domain.
One follows the Zaidi et al. (2017), where the first domain consists of a binary variable with value
1 if the respondent is employed and 0 otherwise. In the other version, proposed by Almeida and
Barros (2015), the first domain also includes an interaction term between the binary variables
Social participation and Retired. Almeida and Barros argues that this version is more suitable at
the individual level as respondents may be active after retirement.
All non-dummy variables are normalized to a 0-1 interval.
24Linear regression is used to
estimate the relation to socio-demographic characteristics, health care characteristics and social
activity
25. Additionally, a dummy variable for sarcopenia was included with the objective to find
the impact of sarcopenia on the AAI:
𝐴𝐴𝐼 = 𝑓( 𝑠𝑎𝑟𝑐𝑜𝑝𝑒𝑛𝑖𝑎
/, 𝑥
/)
(2)
𝑥
/denotes the other characteristics to estimate on the AAI (see Table VI in the appendix).
The transition from macro to micro-level poses challenges of finding appropriate variables
for each indicator. The AAI
's at the individual level are unique and depend on the variables
selected. Adding up the AAI
's do not produce an aggregate level AAI. Even if each domain
23 Correlation between yComplete set of covariates and yIncomplete set of covariates is 0.967. 24 Using 𝑓(𝑥
/)@= EHI A BA BCDEFG (A BC)
C DEFG (A BC ).
captures some of the dimensions of the AAI, some indicators are not reflected due to a lack of
appropriate variables in the SHARE database.
263.4 Production Function of Sarcopenia
The production function of sarcopenia is estimated using a binary probit model with sarcopenia
as the variable of interest. The model has the following function:
𝑃 𝑦
/= 1|𝑥
/= 𝑓(𝑥´
/𝛽)
(3)
where
𝑥´
/denotes the determinants of sarcopenia, presented in Table II and 𝑦
/equals 1 if the
individual has sarcopenia and 0 otherwise.
Table II: Variables for the Production Function of Sarcopenia
Variable Descriptions
Dependent variable
Sarcopeniai = 1 if grip strength <20 kg (female) or <30 kg (male), 0 otherwise,
𝑖 ∈ 𝑚𝑎𝑙𝑒, 𝑓𝑒𝑚𝑎𝑙𝑒 Independent variables
Age Age of respondent at the time of the interview
Moderate physical activity
Respondent´s engagement in moderate physical activity categorized as follows: more than once a week, once a week, 1-3 times a month, (almost) never
Vigorous physical
activity Respondent´s engagement in moderate physical activity categorized as follows: more than once a week, once a week, 1-3 times a month, (almost) never
BMI Body mass index categorized as follows: undernourished (<18.5), normal (18.5-25),
overweight (25-30), obese (>30)
Nursing home = 1 if the respondent has been in a nursing home the last 12 months, 0 otherwise
Chronic diseases Number of chronic diseases (self-reported)
Self-assessed health = 1 if the respondent has good, very good or excellent self-assessed health, 0 otherwise
Number of difficulties
in the ADLs Number of limitations with activities of daily living (in units)
Number of difficulties
in the IADLs Number of limitations with instrumental activities of daily living (in units)
Years of education Number of years of education
Income Monthly household income (in euros)
Married = 1 if the respondent is married or lives in a partnership, 0 otherwise
In sum, the SAI and AAI are constructed indices to measure healthy ageing. The SAI is
an ordered probit based on self-assessed indicators and the AAI a weighted average of four
domains capturing different aspects of healthy ageing. The explanatory variables included in the
production function are based on existing literature on sarcopenia. The next section presents
results of the SAI, the AAI and the production function of sarcopenia, respectively.
26 For instance, SHARE do not contain useful information on physical safety, which is a part of the third domain of
4. Results
4.1 Selfie Aging Index
Table III presents the marginal effect of sarcopenia and age for the ordered probit estimation of
the SAI.
27Consistent with the hypothesis, having sarcopenia is associated with a lower SAI score.
Men and women with sarcopenia have a higher probability of reporting poor or fair self-assessed
health and a lower probability of reporting good, very good or excellent self-assessed health
compared to men and women without sarcopenia. For instance, being a man with sarcopenia
increases the probability of reporting poor or fair self-assessed health by approximately 6
percentage points on average, ceteris paribus.
Table III: Marginal Effect of Sarcopenia on the Selfie Aging Index
Poor or fair Good Very good or excellent
Sarcopeniamale 0.059*** (0,012) -0.007*** (0,001) -0.052*** (0,011)
Sarcopeniafemale 0.061*** (0,010) -0.007*** (0,001) -0.053*** (0,009)
Age 0.022*** (0,012) -0.003*** (0,007) -0.019*** (0,011)
Age2 -0.0001*** (0,000) 0.00002***(0,000) 0.0001*** (0,000)
Robust standard errors in parentheses *** p<0.01, ** p<0.05, * p<0.1
To have a reference of the magnitude of the impact, the marginal effect of sarcopenia is compared
to the marginal effect of age. As previously illustrated (Figure I), age has a strong association with
sarcopenia, hence age may be useful for comparison. Table IV presents the computed equivalent
age effect.
28For each self-assessed health state, the marginal effect of sarcopenia on the SAI is
equivalent to having approximately seven to ten years of age increase.
29Table IV: Age Equivalent Effect of Sarcopenia on the Selfie Aging Index
Poor or fair Good Very good or excellent
Male 6 years and 9 months 10 years 10 years
Female 7 years 9 years 10 years
27 The estimation results for the SAI can be found in Table VII in the appendix.
28 For details of how the equivalent age effect of sarcopenia on the SAI is found, please refer to the appendix and
Equation (5) with respective explanation.
29 The effect of sarcopenia on the SAI may be perceived as small compared to the fitted lines of self-assessed health
for men and women in Figure II. To test this, an ordered probit model on self-assessed health with sarcopenia and age as explanatory variables is estimated. While the marginal effect of age is similar in both regressions, the marginal effect of sarcopenia increases substantially. This may imply that the other indicators in the SAI capture some of the effect and that Figure II overestimates the effect of sarcopenia. See Table IV and V in the supplementary appendix for estimation results and marginal effects.
4.2 Active Ageing Index
Table V presents the estimation results of the AAI following the approach of Almeida and
Barros.
30Model 2 excludes non-significant variables. Sarcopenia has a negative impact on the
AAI. The effect is greater for men than women. The marginal effect of sarcopenia is compared to
the marginal effect of age. Note that the outcome value needs to be converted from the normalized
values to the age to find the equivalent age effect.
31The impact of sarcopenia on the AAI is
equivalent to having aged nine additional years for women and thirteen additional years for men,
on average, ceteris paribus.
32Table V: Factors Associated with the Active Ageing Index
VARIABLES Model 1 Model 2 Sarcopeniamale -0.045*** (0.005) -0.045*** (0.005) Sarcopeniafemale -0.033*** (0.003) -0.034*** (0.003) Gender: female -0.025*** (0.002) -0.025*** (0.002) Age -0.185*** (0.016) -0.165*** (0.006) Age2 0.036 (0.032) BMI -0.116*** (0.017) -0.119*** (0.017) Low education -0.059*** (0.002) -0.060*** (0.002) Married 0.002 (0.002) Health limitations -0.022*** (0.002) -0.022*** (0.002) Mental health -0.008*** (0.002) -0.008*** (0.002) Receive help -0.008*** (0.002) -0.008*** (0.002) Give help 0.027*** (0.002) 0.027*** (0.002) Constant 0.517*** (0.009) 0.516*** (0.008) Observations 45 748 0.159 YES YES 45 768 0.159 YES YES R-squared Country dummies Year dummies
Robust standard errors in parentheses *** p<0.01, ** p<0.05, * p<0.1
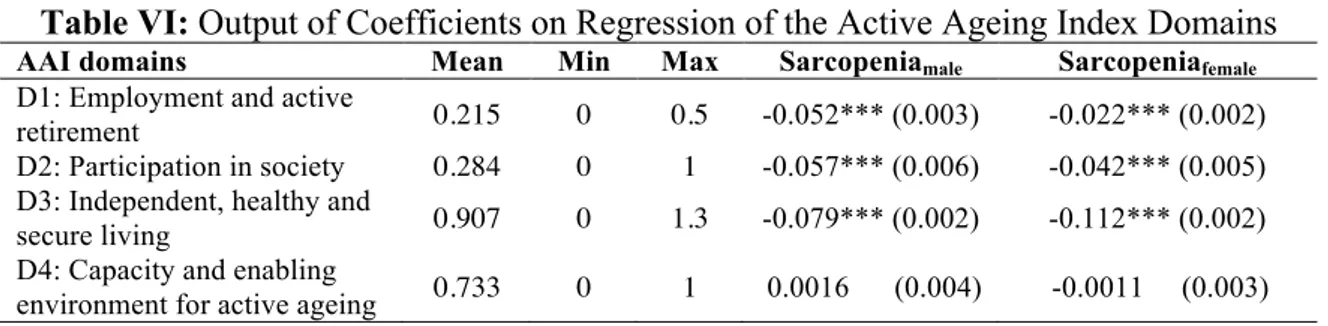
To understand what domains are more affected by sarcopenia, individual regressions for each
domain are estimated.
33Table VI shows the coefficients of sarcopenia for the four domains used
to construct the AAI. The mean, maximum and minimum value for the domains are included to
better assess the magnitude.
30 Table I and Figure V in the supplementary appendix present the estimation results and the distribution of the AAI
following the method of Zaidi et al. (2017). Both versions of the AAI give similar estimation results. The version inspired by Almeida and Barros is presented in the main text, as it is found to be more appropriate for the sample.
31 Table II in the supplementary appendix converts normalized values to age.
32 For details of how the equivalent age effect of sarcopenia on the AAI is found, please refer to the appendix and
Equation (6) with respective explanation.
Table VI: Output of Coefficients on Regression of the Active Ageing Index Domains
AAI domains Mean Min Max Sarcopeniamale Sarcopeniafemale D1: Employment and active
retirement 0.215 0 0.5 -0.052*** (0.003) -0.022*** (0.002) D2: Participation in society 0.284 0 1 -0.057*** (0.006) -0.042*** (0.005) D3: Independent, healthy and
secure living 0.907 0 1.3 -0.079*** (0.002) -0.112*** (0.002) D4: Capacity and enabling
environment for active ageing 0.733 0 1 0.0016 (0.004) -0.0011 (0.003)
Robust standard errors in parentheses *** p<0.01, ** p<0.05, * p<0.1
As in the previous section, the effect of sarcopenia is compared to the effect of age. Each domain
is subject to separate normalization. Table VII presents the approximate comparable effect of
ageing on the domains for both genders.
34The non-linear relation between age and the AAI
produces results where, at old ages, the effect of sarcopenia is equivalent to getting younger.
35A
possible rational for this is that the oldest individuals represent outliers or survivors of the
population. Their health may stand out from the average population causing the odd relationship.
When analyzing the effect of the AAI and the domains, it is important to remember that the indices
are constructed using variables that are suitable to replicate the original AAI. The validity of the
indices cannot be guaranteed and the results need to be interpreted with caution. For all significant
results, there is a positive age effect equivalent to having sarcopenia. There is, however, no clear
trend for gender or for the domains. Further research could study if the gender gap is random and
caused by the specific sample used or if there exists gender differences within the domains.
Table VII: Age Equivalent Effect of Sarcopenia on the Active Ageing Index Domains
36Domain Effect (male) Effect (female) D1. Employment and active retirement 5 years 2.5 years D2. Participation in society 2.5 years 4 years D3. Independent, healthy and secure living 3 years 1 year
D4. Capacity and enabling environment for active ageing No statistical significant effect
To sum up, both healthy ageing indices find consistent results suggesting that sarcopenia has a
significant negative impact on healthy ageing. The equivalent age effect of sarcopenia is similar
in both indices, signalizing robust results. Having established this relationship, the focus is moved
to the production function of sarcopenia for an analysis of the determinants of the condition.
34 See Equation (5) in the appendix for computation of the equivalent age effect of the domains.
35 The effect of sarcopenia is equivalent to getting younger at approximately 85 years in the second and third
domain.
4.3 Production Function of Sarcopenia
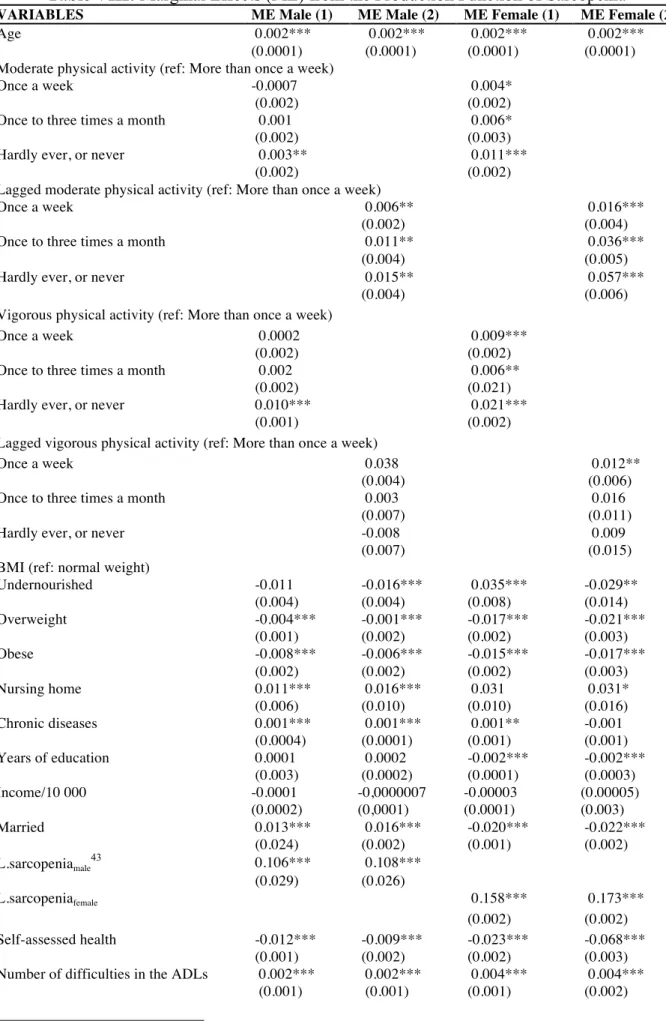
The marginal effect of the production function is presented in Model (1) of Table VIII.
37In line
with existing literature, the results suggests that doing less (compared to doing more) moderate
and vigorous activity increases the likelihood of sarcopenia. However, physical activity may be
related to reverse causality. It is difficult to determine if people who exercise have a lower
probability of developing sarcopenia, or if people who do not have sarcopenia are more likely to
exercise. Time spent on physical activity has a positive effect on health outcomes and can slow
down the effects of ageing by increasing the number of healthy days in the future. Similarly, being
physically inactive is likely to cause loss of muscle mass at the same time as low muscle mass
may cause physical inactiveness. To the extent of my knowledge, no existing literature addresses
this issue.
The risk of endogeneity is addressed by using the lag of the potential endogenous
explanatory variables in the model.
38Model (2) presents the marginal effects of the production
function in which the variables of physical activity are proxied by lagged variables. The marginal
effects from the model with lagged variables are overall in line with the original variables, hence
the potential source of endogeneity is not a serious problem.
39Never doing, or hardly ever doing vigorous physical activity (compared to doing vigorous
physical activities more than once a week) has the same effect on the likelihood of developing
sarcopenia as if the individual had 10 (men) and 21 (women) chronic conditions.
40This
comparison emphasizes the importance of physical activity as a preventive tool and a possible
intervention strategy. Moreover, the cost of implementing exercise plans are likely to be marginal
compared to the health care costs of chronic conditions.
37 Estimation results from the production function can be found in the supplementary appendix, Table VI.
38 In detail, an ordered probit model is estimated with moderate and vigorous activity as the dependent variables and
lagged explanatory variables. Variables from a previous period can be used as an instrument because it is less likely to be correlated with the future. The latent variables of physical activity are predicted and transformed into the same categories as the originals. The production function is estimated again, replacing the suspected endogenous variables with the predicted to compare. The sign and magnitude of the marginal effects for the two models have the same sign and magnitude, with some exceptions. For men, the lagged variable of vigorous physical activity, “Hardly ever, or never”, has a negative, but non-significant, sign (and differs from the original variable by <0.02), contradicting the existing literature. See estimation results in Table VII in the supplementary appendix.
39 Since the predicted variables are proxies, the estimation results may lose precision. 40 Equivalent effect is confirmed using a linear hypothesis test in Stata.
The results suggest that age increases the likelihood of developing sarcopenia, supporting
Figure I and the observations made in existing literature that the prevalence of sarcopenia
increases with age.
41Sarcopenia is also associated with living in nursing homes. Having at least
good self-assessed health is negatively related to sarcopenia. The number of difficulties in the
ADLs and IADLs are positively related to sarcopenia. However, one also need to interpret these
three latter factors with caution as they may be related to reverse causality.
42The marginal effect of BMI suggests that if a respondent´s BMI is different from normal
(undernutrition, overweight or obese), he or she is less likely to have sarcopenia (with the
exception of undernourished women). This association suggests that, using SHARE, low or high
BMI are not determinantants of sarcopenia.
Income has no significant effect on the onset of sarcopenia. Descriptive statistics (Table I)
illustrate that people with sarcopenia have lower mean values of income. As previously
mentioned, there is a substantial difference of sarcopenia between the south and north of Europe,
with a higher prevalence in the south, where income is, on average, lower. Therefore, it could be
that the difference in income is due to the higher proportion of people with sarcopenia in the south
of Europa, and that this is accounted for by country dummies in the estimation.
Summing up, the results from the production function point towards physical activity being
an important predictor of sarcopenia, and that doing less physical activity increases the liklihood
of developing the condition. While there is no clear relation between BMI and sarcopenia or
income and sarcopenia, the condition is found to be positively associated with limitations in daily
living activities and low self-assessed health, confiming existing literature.
41 The model is also estimated including the variables Retired (dummy variable) and Age,2 and with only Age2, see
Model (1), (2) and (3) Table VI and Table VII in the supplementary appendix. Age2 is only significant when combined
with Retired. This means Retired introduces a non-linearity on age. Being retired is age-related, hence Retired can be viewed as a proxy for age.
42There is a risk that Self-assessed health, Number of difficulties in the ADLs- and IADLs suffer from revered
causality. It is for instance difficult to establish if low self-assessed health causes sarcopenia, or if it is the other way around. Due to this suspicion, the production function was estimated without Self-assessed health, Number of
Table VIII: Marginal Effects (ME) from the Production Function of Sarcopenia
VARIABLES ME Male (1) ME Male (2) ME Female (1) ME Female (2) Age 0.002*** 0.002*** 0.002*** 0.002***
(0.0001) (0.0001) (0.0001) (0.0001) Moderate physical activity (ref: More than once a week)
Once a week -0.0007 0.004*
(0.002) (0.002)
Once to three times a month 0.001 0.006*
(0.002) (0.003)
Hardly ever, or never 0.003** 0.011***
(0.002) (0.002)
Lagged moderate physical activity (ref: More than once a week)
Once a week 0.006** 0.016***
(0.002) (0.004)
Once to three times a month 0.011** 0.036***
(0.004) (0.005)
Hardly ever, or never 0.015** 0.057***
(0.004) (0.006)
Vigorous physical activity (ref: More than once a week)
Once a week 0.0002 0.009***
(0.002) (0.002)
Once to three times a month 0.002 0.006**
(0.002) (0.021)
Hardly ever, or never 0.010*** 0.021***
(0.001) (0.002)
Lagged vigorous physical activity (ref: More than once a week)
Once a week 0.038 0.012**
(0.004) (0.006)
Once to three times a month 0.003 0.016
(0.007) (0.011)
Hardly ever, or never -0.008 0.009
(0.007) (0.015)
BMI (ref: normal weight)
Undernourished -0.011 -0.016*** 0.035*** -0.029** (0.004) (0.004) (0.008) (0.014) Overweight -0.004*** -0.001*** -0.017*** -0.021*** (0.001) (0.002) (0.002) (0.003) Obese -0.008*** -0.006*** -0.015*** -0.017*** (0.002) (0.002) (0.002) (0.003) Nursing home 0.011*** 0.016*** 0.031 0.031* (0.006) (0.010) (0.010) (0.016) Chronic diseases 0.001*** 0.001*** 0.001** -0.001 (0.0004) (0.0001) (0.001) (0.001) Years of education 0.0001 0.0002 -0.002*** -0.002*** (0.003) (0.0002) (0.0001) (0.0003) Income/10 000 -0.0001 -0,0000007 -0.00003 (0.00005) (0.0002) (0,0001) (0.0001) (0.003) Married 0.013*** 0.016*** -0.020*** -0.022*** (0.024) (0.002) (0.001) (0.002) L.sarcopeniamale 43 0.106*** 0.108*** (0.029) (0.026) L.sarcopeniafemale 0.158*** 0.173*** (0.002) (0.002) Self-assessed health -0.012*** -0.009*** -0.023*** -0.068*** (0.001) (0.002) (0.002) (0.003) Number of difficulties in the ADLs 0.002*** 0.002*** 0.004*** 0.004***
(0.001) (0.001) (0.001) (0.002)
43 L.sarcopenia
Number of difficulties in the IADLs 0.005*** 0.007*** 0.006*** 0.005*** (0.001) (0.001) (0.001) (0.002)
Observations 84 611 38 239 84 611 38 239
Country dummies YES YES YES YES
Year dummies YES YES YES YES
Robust standard errors in parentheses *** p<0.01, ** p<0.05, * p<0.1
5. Limitations
SHARE is a rich, but unbalanced dataset. The unbalanced structure poses challenges in
finding appropriate variables without losing too many observations. Moreover, the structure of
the data has implications for the econometric specifications, for instance the decision to not use
sample weights and fixed effect models.
Another challenge is related to how to measure healthy ageing. Because there is no explicit
way of measuring healthy ageing, both the SAI and the AAI are used. As both the indices produce
consistent results with regards to the effect of sarcopenia, it is taken as a promising sign that the
healthy ageing concept is captured.
44Additionally, literature on sarcopenia and its determinants is limited, as most of it is
focused on biological and medical sciences rather than health and socioeconomic aspects. This
posed challenges in determining which variables to include in the production function.
Due to the suspicion that physical activity, self-assessed health, living in a nursing home
and the number of difficulties in the ADLs and IADLs are endogenous, one needs to interpret the
estimates with caution. Further research should address the potential endogeneity bias and look
for suitable instrumental variables to test for endogeneity. Additionally, further research could
test and potentially confirm the established negative relationship between healthy ageing and
sarcopenia, for example using difference-in-difference or matching estimation approaches.
6. Concluding Remarks
This work project finds evidence suggesting that sarcopenia has a significant negative effect on
healthy ageing, measured using the Selfie Aging Index and the Active Ageing Index. Sarcopenia
has the same impact as having aged an additional of seven to ten years on the SAI and nine to
44 The Selfie Aging Index is based on self-assessed measures while the Active Ageing Index is based on UNECE and
thirteen years on the AAI.
45The equivalent age effect is similar for both indices, enhancing the
external validity of the estimation results. Considering the importance of healthy ageing and that
self-assessed health is a proxy for healthy ageing, the low self-assessed health of people with
sarcopenia may imply considerable loss of healthy ageing potential.
Results from the production function suggest that doing physical activity decreases the
likelihood of developing sarcopenia. Sarcopenia is also found to be associated with limitations of
daily living activities and living in nursing homes. The findings could indicate that people with
sarcopenia have a high dependency on others, which may imply extra costs for the society, for
example through additional caretaking. Interventions should target those at risk of developing
sarcopenia, for example by creating targeted exercise plans and encourage people to engage in
physical activities.
46This can for instance be implemented in nursing homes, especially for people
under recovery, where the activity level may be lower than usual and people are extra prone to
muscle loss.
With the demographic shift the world is facing today, the prevalence of sarcopenia is
expected to rise significantly. The established negative relationship between healthy ageing and
sarcopenia must be addressed. Focus should be on reaching a commonly agreed definition of the
condition to establish effective treatment. Moreover, research should look for possible
interventions to prevent the condition, minimize the negative consequences and increase the
number of healthy life years for people with sarcopenia.
7. References
Almeida, S., and P. P. Barros. 2015. “How Relevant Is Active Ageing? Evidence from Portugal.” In Building
Evidence for Active Ageing Policies, 313–41. https://doi.org/10.1007/978-981-10-6017-5_15.
Andersen-Ranberg, K, I. Petersen, H. Frederiksen, J. P. Mackenbach, and K. Christensen. 2009. “Cross-National Differences in Grip Strength among 50+ Year-Old Europeans: Results from the SHARE Study.” European
Journal of Ageing 6 (3): 227–36. https://doi.org/10.1007/s10433-009-0128-6.
Börsch-Supan, A., C. Brandt, T. Hunkler, J. Kneip, F. Korbmacher, B. Malter, S. Schaan, S. Stuck, and Zuber. 2013. “Data Resource Profile: The Survey of Health, Ageing and Retirement in Europe (SHARE).” International
Journal of Epidemiology. https://doi.org/10.1093/ije/dyt088.
45 Sarcopenia is equivalent to having aged an additional of thirteen years for men and nine years for women, using
the AAI estimations.
46 Resistance training interventions for older people have been shown to be highly effective, with particularly large
Cruz-Jentoft, A. J., J. P. Baeyens, J. M. Bauer, Y. Boirie, T. Cederholm, F. Landi, F. Martin, et al. 2010. “Sarcopenia: European Consensus on Definition and Diagnosis.” Age and Ageing 39 (4): 412–23. https://doi.org/10.1093/ageing/afq034.
Downward, Paul. 2007. “Exploring the Economic Choice to Participate in Sport: Results from the 2002 General Household Survey.” International Review of Applied Economics 21 (5): 633–53. https://doi.org/10.1080/02692170701474710.
Engel, G. L. 1977. “The Need for a New Medical Model: A Challenge for Biomedicine.” Psychodynamic Psychiatry 40 (3): 377–96. https://doi.org/10.1521/pdps.2012.40.3.377.
Gonçalves, J., M. I. Gomes, M. Fonseca, T. Teodoro, P. P. Barros, and M. Botelho. 2017. “Selfie Aging Index: An Index for the Self-Assessment of Healthy and Active Aging.” Frontiers in Medicine 4. https://doi.org/10.3389/fmed.2017.00236.
Grossman, M. 1972. “On the Concept of Health Capital and the Demand for Health.” Journal of Political Economy 80 (2): 223–55. http://www.jstor.org/stable/1830580.
Gruber, S., C. Hunkler, and S. Stuck. 2014. “Generating EasySHARE: Guidelines, Structure, Content and Programming. SHARE Working Paper Series.” 17-2014. Munich: MEA, Max Planck Institute for Social
Law and Social Policy. 17–2014. https://doi.org/10.6103/SHARE.easy.610.
Hsiao, C. 2007. “Panel Data Analysis—advantages and Challenges.” TEST 16 (1): 1–22. https://doi.org/10.1007/s11749-007-0046-x.
Liu, C., and N. Latham. 2009. “Progressive Resistance Strength Training for Improving Physical Function in Older Adults.” The Cochrane Database of Systematic Reviews, no. 3 (July): CD002759. https://doi.org/10.1002/14651858.CD002759.pub2.
Martone, A. M., F. Lattanzio, A. M. Abbatecola, D. L. Carpia, M. Tosato, E. Marzetti, R. Calvani, G. Onder, and F. Landi. 2015. “Treating Sarcopenia in Older and Oldest Old.” Current Pharmaceutical Design 21 (13): 1715–22. https://moh-it.pure.elsevier.com/en/publications/treating-sarcopenia-in-older-and-oldest-old. Mossey, J. M., and E. Shapiro. 1982. “Self-Rated Health: A Predictor of Mortality among the Elderly.” American
Journal of Public Health 72 (8): 800–808. https://doi.org/10.2105/AJPH.72.8.800.
Muscaritoli, M., S. D. Anker, J. Argilés, Z. Aversa, J. M. Bauer, G. Biolo, Y. Boirie, et al. 2010. “Consensus Definition of Sarcopenia, Cachexia and Pre-Cachexia: Joint Document Elaborated by Special Interest Groups (SIG) ‘Cachexia-Anorexia in Chronic Wasting Diseases’ and ‘Nutrition in Geriatrics.’” Clinical
Nutrition 29 (2): 154–59. https://doi.org/10.1016/j.clnu.2009.12.004.
Paúl, C., O. Ribeiro, and L. Teixeira. 2012. “Active Ageing: An Empirical Approach to the WHO Model.” Current
Gerontology and Geriatrics Research. https://doi.org/10.1155/2012/382972.
Pfarr, C., A. Schmid, and U. Schneider. 2012. “Reporting Heterogeneity in Self-Assessed Health among Elderly Europeans.” Health Economics Review 2 (October): 21. https://doi.org/10.1186/2191-1991-2-21.
Ryu, M., J. Jo, Y. Lee, Y. Chung, K. Kim, and W. Baek. 2013. “Association of Physical Activity with Sarcopenia and Sarcopenic Obesity in Community-Dwelling Older Adults: The Fourth Korea National Health and Nutrition Examination Survey.” Age and Ageing 42 (6): 734–40. https://doi.org/10.1093/ageing/aft063. Solon, Gary, Steven Haider, and Jeffrey M. Wooldridge. 2015. “What Are We Weighting For?” Journal of Human
Resources 50 (2): 301–16. http://jhr.uwpress.org/cgi/reprint/50/2/301.
The Swedish National Institute of Public Health. 2007. Healthy Ageing: A Challenge for Europe. Sweden, Stockholm: National Institute of Public Health. http://ec.europa.eu/health/ph_projects/2003/action1/docs/2003_1_26_frep_en.pdf.
UNECE/ European Commission. 2015. “Active Ageing Index 2014: Analytical Report.” Report Prepared by Zaidi.
A. of Centre for Research on Ageing, University of Southampton and David Stanton, under Contract with United Nations Economic Commission for Europe (Geneva), Co-Funded by European Commission’s
Directorate General for Employment, Social Affairs and Inclusion (Brussels).
https://ec.europa.eu/eip/ageing/library/2014-active-ageing-index-aai-analytical-report_en.
World Health Organization, ed. 2015. World Report on Ageing and Health. Geneva, Switzerland: World Health Organization. http://www.who.int/ageing/events/world-report-2015-launch/en/.
Yu, S., K. Khow, A. Jadczak, and R. Visvanathan. 2016. “Clinical Screening Tools for Sarcopenia and Its Management.” Current Gerontology and Geriatrics Research. https://doi.org/10.1155/2016/5978523. Zaidi, A., M. Barslund, and M. V. Werder. 2017. “Inequality in Active Ageing: Evidence from a New
Individual-Level Index for European Countries.” Cambridge University Press, October, 1–27. https://doi.org/10.1017/S0144686X17001052.
APPENDIX
Table I: Proportion of Individuals with Sarcopenia Per Country
47Country Proportion Country Proportion Country Proportion Germany 7,5% Luxembourg 10,7% Greece 14,2% Netherlands 8,1% Belgium 10,8% France 14,2% Denmark 8,2% Croatia 12,2% Italy 15,1% Sweden 9,0% Slovenia 12,3% Hungary 16,6% Czech Republic 9,4% Poland 13,0% Portugal 22,8% Switzerland 9,6% Estonia 13,1% Israel 23,0% Austria 10,0% Ireland 13,6% Spain 26,9%
Table II: Critical Variables Used in the Construction of the Indices
Variable included Sample size Index
Sleep 191 506 SAI
Lack of interest 170 435 SAI Social participation 169 950 AAI Cognitive difficulties 122 521 AAI Complaints: general 111 056 SAI Complaints: emotions 84 266 SAI Size of social network 51 734 SAI
Table III: Estimation Results from Regression of Grip Strength Used for Figure III
VARIABLES Grip strength (male) Grip strength (female) Sarcopeniamale -39.720*** (0.679) Sarcoagemale 48 0.364*** (0.009) Sarcopeniafemale -21.00*** (0.288) Sarcoagefemale 0.170*** (0.004) Age -0.458*** (0.003) -0.232*** (0.002) Observations 94,902 115,615 R2 0.2743 44 638 YES 0.269 53 806 YES Number of merge_id Controls
Robust standard errors in parentheses *** p<0.01, ** p<0.05, * p<0.1
Table IV: Indicator Variables of the Selfie Aging Index
Biological
subdomains Variable Variable description
Complaints about one´s health status
Complaints: general Number of complaints, (falling, fear of falling, fatigue, other symptoms) Complaints:
digestive system
= 1 if the respondent is bothered by stomach or intestine problems, including constipation, air, diarrhea, 0 otherwise
Complaints: eyesight = 1 if the respondent has fair or poor eyesight, 0 otherwise Complaint: hearing = 1 if the respondent has fair or poor hearing, 0 otherwise Complaints:
circulatory system = 1 if the respondent is bothered by heart trouble or swollen legs, 0 otherwise Complaints:
musculoskeletal system
= 1 if the respondent is bothered by pain in back, knees, hips or any other joints, 0 otherwise
Complaints: nervous
system = 1 if the respondent is bothered by dizziness, faints or blackouts, 0 otherwise
47 See Figure I in the supplementary appendix for the proportion of people with sarcopenia per wave. 48 Sarcoage
Complaints: respiratory system
= 1 if the respondent is bothered by breathlessness or persistent cough, 0 otherwise
Complaints: urinary
system = 1 if the respondent is incontinence, 0 otherwise
Nutrition status BMI Body mass index categorized into the following intervals: undernourished (<18.5), normal (18.5-25), overweight (25-30) and obese (>30)
Mobility
Difficulties moving
around = 1 if the respondent has difficulties walking across a room, 0 otherwise Number of
difficulties in the ADLs49
Number of difficulties the respondent has out of the following: difficulties bathing or showering, dressing, using the toilet, getting in and out of bed, eating,
Number of difficulties in the IADLs
Number of difficulties the respondent has out of the following: difficulties making telephone calls, shopping for groceries, preparing a hot meal, doing work around the house or garden, taking medication, managing money Psychological
domain
Emotional status
Complaints:
emotional status = 1 if the respondent has ever had affective or emotional disorders, 0 otherwise Depressed = 1 if the respondent was sad or depressed last month, 0 otherwise
Lack of interest = 1 if the respondent is less interested than usual in things the last month, 0 otherwise
Nervousness Level of nervousness categorized as follows: never, hardly ever, some of the time and most of the time
Trouble sleeping = 1 if the respondent has trouble with sleep, 0 otherwise
Lack of energy = 1 if the respondent has little energy to do the things he or she wanted to do last month (fatigue), 0 otherwise
Cognitive
status Time awareness
= 1 if the respondent is time aware (knowledge of year, month, day of the month, day of the week), 0 otherwise
Social domain
Social network
Marital status Marital status categorized as follows: widowed, married, single, divorced/separated
Lives with someone
else = 1 if the respondent lives with someone (household size>1), 0 otherwise Has someone to
confide with = 1 if the respondent´s social network>1, 0 otherwise
Social status
Years of education Number of years of education
Job type
Type of current or last job categorized as follows: manager or army official, professional, technician, clerk, service and sales, agriculture and fishing, crafts, blue collar, elementary, armed forces
Healthy behaviors
Vigorous physical activity
Respondent´s engagement in vigorous physical activity categorized as follows: more than once a week, once a week, 1-3 times a month, (almost) never
Moderate physical activities
Respondent´s engagement in moderate physical activity categorized as follows: more than once a week, once a week, 1-3 times a month, (almost) never
Smoking status Smoking status categorized as follows: non-smoker, former smoker, current smoker
Other
Sarcopeniai
= 1 if grip strength<20 kg (female) or <30 kg (male), 0 otherwise, 𝑖 ∈ 𝑚𝑎𝑙𝑒, 𝑓𝑒𝑚𝑎𝑙𝑒
Construction of the Active Ageing Index:
𝐴𝐴𝐼 = 0.35𝐷1 + 0.35𝐷2 + 0.1𝐷2 + 0.2𝐷4
(4)
Table V: Variables and Weights for Construction of the Active Ageing Index
Table VI. Variables for Regression of the Active Ageing Index
Variable name Description
SD:Socio-demographic
Female = 1 if the respondent is female, 0 otherwise
Age, Age2
Normalized age and age squared
BMI Normalized body mass index
Low education = 1 if the respondent has low education (primary or lower secondary
education), 0 otherwise52
50 Income was subject to normalization using 𝑓(𝑥
/)@= EHI A BA BCDEFG (A BC)
C DEFG (A BC).
51 Physically inactive refers to never (or almost never) being in vigorous or moderate activity. 52 Following Zaidi (2015). Domain Domain weight Indicators Indicator weight
Variable and variable description D1. (Ref: Almeida and Barros) Employment and active retirement 35%
Currently working 50% Employed = 1 if the respondent is employed, 0 otherwise
Retired 50% Retired*socialparticipation = 1 if the respondent is retired, 0 otherwise D1.(Ref: Zaidi
et al.)
Employment 35% Currently working 100%
Employed
= 1 if the respondent is employed, 0 otherwise D2. Participation in society 35% Participation in recreational or social activities 100% Socialparticipation
= 1 if the respondent did activities last year (sport, social or other kind of club), 0 otherwise D3. Independent, healthy and secure living 10% Income 25% hhincome50
Monthly household income divided into intervals (in euros): 1
1.Until 245, 246-489, 490-734, 735-1223, 1224-2445, above 2445
Autonomy in DLA 40%
50% no_daily_diff = 1 if the respondent has no limitations of activities of daily living (ADLs), 0 otherwise
50%
no_daily_instdiff
= 1 if the respondent has no limitations with instrumental activities of daily living (IADLs), 0 otherwise
Independent 25% Independent = 1 if the respondent lives alone or with only one other person, 0 otherwise
Not physically
inactive 10%
Not_phinactive
=1 if the respondent is not physically inactive, 0 otherwise51 D4. Capacity and enabling environment for active ageing 20% Cognitive difficulties 45% Cogn_diff
The completion score of cognitive difficulties test (remembering test, orientation to date, mathematical performance) divided into the following intervals:
until 25%, 26-50%, 51-75%, 76-100% Current health status 55%
Self_health
=1 if the respondent reports at least good self-assessed health, 0 otherwise