CATÓLICA LISBON SCHOOL OF BUSINESS AND ECONOMICS
Equity Valuation of Mota Engil
Pedro Miguel Ramos Bernardes
(152209004)
March 11th 2013
Advisor: Professor José Carlos Tudela Martins
Dissertation submitted in partial fulfillment of requirements for the degree of MSc in Economics, at the Universidade Católica Portuguesa
ABSTRACT
Author: Pedro Miguel Ramos Bernardes Title: Equity Valuation of Mota Engil
Equity valuation is used in several areas of corporate finance with a variety of different purposes. However, there is no single valuation methodology that fits all situations. We present the main valuation models used by practitioners, with a stronger emphasis on those that are more appropriate to value the Equity of Mota Engil. We proceed to find the value of Mota Engil using the Discounted Cash Flow method, and cross check its results with those obtained using relative valuation methods. We also compare our results to those of a leading Portuguese investment bank. We find that the market value of Mota Engil does not reflect the value of the company, there being a strong upside potential to the price of its shares.
ACKNOWLEDGEMENTS
I would like to thank my advisor, Prof. José Tudela Martins for the precious inputs and suggestions, as well as for the great availability always shown.
I would also like to thank João Vermelho, from Mota Engil’s investor relations department, for the helpful information provided.
Finally, I want to thank Pedro and Raul for all the help, and Maria and my parents for all the support.
TABLE OF CONTENTS
1. INTRODUCTION ... 1
2. LITERATURE REVIEW ... 3
2.1. Discounted Cash Flow Valuation ... 3
2.1.1. Firm Valuation Models ... 5
2.1.1.1. Free Cash Flow to the Firm (FCFF) ... 6
2.1.1.2. Adjusted Present Value (APV) ... 9
2.1.1.3. Capital Cash Flow (CCF) ... 11
2.1.2. Equity Valuation Models ... 11
2.1.2.1. Dividend Discounted Model ... 11
2.1.2.2. Equity Cash Flows (ECF’s) ... 13
2.1.3. Excess Returns Valuation ... 13
2.1.3.1. Economic Value Added (EVA) ... 14
2.1.3.2. Economic Profit ... 15
2.1.3.3. Cash Value Added ... 15
2.2. Liquidation and Accounting Valuation ... 15
2.2.1. Book Value ... 16
2.2.2. Liquidation Value ... 16
2.3. Relative Valuation ... 17
2.3.1. Establishing a Peer Group ... 18
2.3.2. Multiples... 18
2.3.2.1. Price to Earnings ratio (PER) ... 19
2.3.2.2. Enterprise Value to EBITDA (EV/EBITDA) ... 19
2.3.2.3. Enterprise Value to EBITDA growth (EV/EG) ... 20
2.3.2.4. Price to Book Value (P/BV) ... 20
2.3.3. Adjusting for differences across assets ... 20
2.4. Contingent Claim Valuation ... 21
3. COMPANY PRESENTATION ... 22
3.1. Engineering & Construction: ... 23
3.1.1. Portugal ... 24
3.1.2. Central Europe ... 24
3.1.3. Africa ... 25
3.2. Environment & Services ... 26 3.2.1. Waste management ... 27 3.2.2. Water ... 28 3.2.3. Logistics ... 28 3.2.4. Multi Services ... 29 3.3. Transport Concessions ... 29
4. DISCOUNTED CASH FLOW VALUATION ... 31
4.1. Turnover ... 31
4.1.1. Engineering & Construction Turnover ... 31
4.1.2. Environment & Services Turnover ... 33
4.2. EBITDA margin and EBITDA ... 35
4.3. Tangible and Intangible Assets ... 38
4.4. Depreciation ... 39
4.5. CAPEX ... 39
4.6. Net Working Capital ... 40
4.7. WACC ... 41
4.7.1. Risk Free Rate ... 41
4.7.2. Country Risk Premium ... 41
4.7.3. Market Premium ... 42
4.7.4. Beta ... 43
4.7.5. Cost of Debt ... 43
4.7.6. Tax Rate ... 43
4.7.7. Leverage ... 44
4.8. Free Cash Flows of Consolidated Businesses ... 46
4.9. Minority Interests ... 47
4.10. Martifer and Ascendi ... 47
4.11. Discounted Cash Flow Valuation Results ... 48
5. RELATIVE VALUATION ... 50
5.1. Mota Engil’s Peer Group ... 50
5.2. EV/EBITDA valuation ... 52
5.3. PER valuation ... 53
6. COMPARISION WITH INVESTMENT BANK RESULTS ... 55
7. SENSITIVITY ANALYSIS ... 57
REFERENCES ... 60
ANNEX I – INFLATION AND FX EVOLUTION ... 62
ANNEX II – ENGINEERING & CONSTRUCTION TURNOVER ... 65
1
1. INTRODUCTION
Valuation plays a central role in today’s finance. It is performed daily by a myriad of players in the finance industry for a wide variety of purposes. It is used by corporate finance practitioners in order to best judge their decisions regarding investment, financing and dividends with the ultimate goal of maximizing firm value. But its usefulness also ranges from identifying investment opportunities (stocks that are under or overpriced relative to their value), a key analysis in portfolio management, to studying the efficiency of markets by analyzing deviations from fair value and their persistence (or lack of) (Damodaran, 2006). Fernández (2007) further identifies several other uses for valuation, such as in buying and selling operations (where valuation can be used both for the buyer to assess its maximum willingness to pay and for the seller to determine the lowest price he should be willing to accept), Initial Public Offerings (to justify the price per share asked to the new investors), to compare the value of shares to that of other assets (useful for heritage related matters), to quantify premiums to be paid on value creation based payment schemes, as well as to identify value drivers and justify several strategic decisions in a company.
Given the importance of valuation, one would expect it to be a widely researched topic, and indeed it is. In fact, a multitude of models have been developed over the years, to the point that the industry is getting overloaded by the variety of approaches available to anyone interested in valuing a firm. Each of these approaches has its own merits and demerits, shedding light in some aspects of the valuation problem while withdrawing attention from others. This multitude of approaches to valuation can, unfortunately, be confusing, as different approaches often lead to different conclusions, leaving an investor with little guidance due to the mixed signals he receives (Young et al., 1999). While the authors of the aforementioned work offer a way to express each of the most popular valuation models in terms of the others, so as to improve the quality of the assumptions made by viewing the company from a wider variety of viewpoints, it is still of critical importance in making a good valuation that the most suitable methods are used. This is why we will start this paper by analyzing a broad spectrum of models studied in the literature, identifying the methodologies that are most suitable to the construction sector, and in particular, to Mota Engil.
We will then proceed by presenting Mota Engil, a Portuguese holding company that is market leader in Portugal in the construction and public works sector that will be the subject of our valuation, to be presented in the chapters that follow.
2 We will finalize our analysis by comparing our results to the ones obtained by Banco Espírito Santo Research in their valuation of Mota Engil made on November 22nd 2012, identifying and discussing the key differences encountered.
3
2. LITERATURE REVIEW
“(…) every popular valuation approach is simply a different way of expressing the same underlying model”, (Young et al., 1999)
It is important to start this literature review by recognizing that the choice of the model we use to value Mota Engil, despite having some impact, should not be the main determinant of the conclusions of this valuation. Due to the equivalence between models described by Young and his co-authors (1999), the choice of approach, they argue, should be governed by robustness to data imperfections. However, as different models highlight different aspects of the valuation process, there may be ones more suitable to the construction industry or even more appropriate to account for the specific characteristics of Mota Engil. Macroeconomic conditions may also play a role in the adequacy of certain models.
Given the multitude of approaches available, it is important to bring some systematization into them. Damodaran (2006) divides the valuation methodologies in four main categories:
Discounted Cash Flow Valuation, Liquidation and Accounting Valuation, Relative Valuation
and Contingent Claim Valuation. Fernández (2007) opens two more sections, Mixed
(Goodwill) and Value Creation. The first comprises methodologies that have characteristics
shared by asset based methods (Liquidation and Accounting Valuation) and Income Statement methods (Relative Valuation), while the second may be seen as a subset of Discounted Cash Flow methods as in fact, the methods included by Fernández in that section are based on discounted cash flows.
In the next sections, we will develop further into the main valuation models, organized according to Damodaran’s (2006) classification.
2.1. Discounted Cash Flow Valuation
Young (Young et al., 1999) claims that “There is no single theoretically ‘correct’ model”. However, Fernández (2007) justifies the increasing use of cash flow discounting for being the only conceptually correct methods. Damodaran (2006) also asserts that this kind of models have “the best theoretical credentials”.
4 The conceptual basis of discounted cash flow methods is that the value of an asset is the sum of the cash flows it can generate in the future, discounted to the present date at a rate that is consistent with the risk taken to generate those same cash flows (Damodaran, 2006).
Fernández (2007) argues that determining this rate is “one of the most important tasks” in valuation. In fact, we can see that simplifying the model to assume the Cash Flows grow perpetually at a rate of 2% (the long term growth rate of US economy), changing the discount rate from 6% to 5% leads to a 33% higher firm value.
A typical discounted Cash Flow valuation formula would look like this:
Where is firm value, and represent, respectively, the cash flow generated and the residual value of the firm at period , and stands for the cost of capital, used as the discount rate.
We can distinguish two different parts in this formula: the first, where the cash flows are explicitly estimated year by year during years, and the second, where a residual value is estimated, based on the assumption of perpetual growth of the flow estimated in year . Jennergren (2008) refers to these periods as the explicit forecast period and the
post-horizon period. This author states that the explicit forecast period should be large enough
to capture any transitory effects and should at least be as long as the economic life of property, plant and equipment. Nevertheless, he states the typical forecast period is between 10 and 15 years. In the post-horizon period, the residual value of the firm is computed as
, being the perpetual growth rate of the flow.
We are talking about Cash Flows generated in abstract. When we put this in practice, we notice that we can chose from several cash flow measures. In fact, there are several different Discounted Cash Flow models that use different Cash Flow measures, and each one has its own merits and demerits.
Before we enter into the details of the different Discounted Cash Flow models, it is important to recognize two main categories of models: Firm Valuation models and Equity Valuation models. While the latter values only the equity stake in the firm, the first values the firm as a whole. Damodaran (2006) states that the equity value should, provided the valuation is done correctly, be the same whether it is valued directly using Equity Valuation models or indirectly,
5 using Firm Valuation models and then subtracting the value of non-equity claims. Bellow we analyze the main Firm and Equity Valuation models in two separate sub-sections.
It is also relevant to note that while models of discounted absolute cash flows are the most common (Damodaran, 2006), there are some variants that use excess returns instead, that is, cash flows that are above or below the risk adjusted required returns. We will close our analysis on Discounted Cash Flow valuation in a small sub-section devoted to this kind of models.
2.1.1. Firm Valuation Models
Firm Valuation models look at the company as a whole. They take into account the Cash Flows owed to all parties involved in non-current financing of the company: equity and debt investors. For the purposes of this paper, however, as well as for most practical purposes, the relevant figure is the Equity value. Equity value can be derived from firm value by subtracting to the firm value estimated by any of the following models, the value of interest bearing debt. This, as Jennergren (2008) argues, does not include deferred income taxes (treated as Equity) nor trade credit (remunerated in the form of higher operating expenses, and therefore is on the operations scope, rather than financing).
Koller et al. (2010) argue in favor of Firm Valuation models, rather than models that value Equity directly as, according to them, the last ones are harder to apply due to the difficulty of matching flows with their cost of equity and can easier lead to mistakes. They suggest the readers to steer away from Equity and Cash flow valuation models and proceed as described above, valuing Equity subtracting financial debt claims from firm value, except when the firm being valued is a bank or financial institution.
We start by looking at the Free Cash Flow model. In this model, Free Cash flow is discounted at rate that represents the required returns on equity and debt, weighted by their corresponding weights in the capital structure. We then proceed analyzing the APV model, where the value of the firm is computed by summing the value of the leverage effects to the value of the unlevered firm. We finalize by taking a brief look at other less used approaches, like the Capital Cash flow.
6
2.1.1.1. Free Cash Flow to the Firm (FCFF)
Free Cash Flows are the flows of money that would remain in the company after all fixed assets investments and working capital requirements are paid for. (Fernández, 2007). These differ from any measure directly available in an income statement in that they represent cash actually paid or received, instead of revenues, costs and expenses that are allocated through somewhat arbitrary methods and using an accrual approach.
These can, however, be obtained from Income Statements as follows:
Earnings before Interest and Taxes (EBIT)
- Tax that would be paid on EBIT + Depreciation
- CAPEX
- Change in Working Capital Requirements
Free Cash Flow
It is important to stress that the Free Cash Flow includes only flows generated from operations. All flows coming from non-operating assets, as is the case for excess cash and marketable securities should be valued separately and then added to the FCF resulting firm (Koller et al., 2010).
Free Cash Flow forecasts in the explicit forecast period are not made directly. Instead, the Income Statement and Balance Sheet are forecasted, and FCF is then computed every year from those forecasts. This increases the consistency of the forecasted scenario, and is, as Jennergreen (2008) argues, one of the key strengths of this model.
The forecasted flows are then discounted using the general formulas for Discounted Cash Flow valuation models described above, with the Weighted Average Cost of Capital (WACC) as the discount rate. Although there are different specifications in the literature, both Fernández (2007) and Jennergren (2008) provide the following formula for WACC computation, the one we will use in the next sections of this paper:
7
and stand for Equity and Debt costs, and for Equity and Debt levels that should be valued mark-to-market (Fernández, 2007), and is the tax rate on corporate earnings.
Koller et al. (2010) argue that WACC based models work best with a debt to value ratio that is stable overtime. If that is not the case, APV models are the recommended alternative.
The estimation of and is a discussed topic in the literature, and given its importance in the final result of the valuation, it is worth to review their estimation in greater detail.
Cost of Equity (Ke)
The Cost of Equity can be obtained from the Capital Asset Pricing Model (CAPM), based on the work of Markowitz on diversification and portfolio theory, developed by Treynor, Sharpe, Lintner and Mossin. It allows us to estimate the expected return of an investment in a given firm. The expected rate of return given the firm’s risk is the opportunity cost of investing money in a given company, and as such, becomes the cost of equity (Mullins, 1982) as, under the hypothesis of the model, no investors would be willing to invest in a company which would be expected to yield them less than what is predicted by CAPM for a given level of risk. According to CAPM, the cost of Equity of a given firm is:
( )
In the formula bellow, stands for the expected return for a given security that, as explained bellow, we will take as the cost of equity; is the risk-free rate; measures the systematic risk of the security relative to that of the market; stands for the expected return of the market portfolio. Therefore, in order to compute the cost of equity or Mota-Engil through the CAPM model, three parameters must be estimated: the risk free rate, the of Mota-Engil and the expected return on the market portfolio.
According to Damodaran (2008), ideally, a risk-free rate should fulfill two conditions. The first is that the issuer must have no risk of default. This restricts the choice to government issued bonds, because as governments have the control of their own currency (they can print money), in theory and in nominal terms, they will always be able to fulfill their obligations. The second condition is that there cannot be uncertainty regarding the rate to which flows are reinvested.
8 This leads to the recommendation of using zero coupon bonds whenever they are available, as any bond that pays a coupon has reinvestment risk. The same author believes that it is a good practice in mature markets to use a 10 year bond to perform valuation. The risk free rate’s currency should match the one of the flows. Therefore, as Mota-Engil is a Portuguese company and consolidates results in euros, we will use a euro risk-free rate. Technically, as no European government can by himself print currency, default risk cannot be completely ruled out. However, for AAA rated Eurozone countries (Finland, Germany, Luxembourg, Netherlands), the default risk is negligible. We can, therefore, use the 10 year bond of the Eurozone with lower rates as a proxy for the risk free rate, that is, a German 10 year Bund. As a final remark, we notice that 10 year German Bunds are not zero coupon. However, zero coupon equivalent rates can be estimated from coupon yield rates.
Next, in order to calculate the Equity Risk Premium, one needs a market portfolio that is representative of the firms in an economy. Ideally, such portfolio would include every asset in the economy, in their respective proportions. However, as such portfolio does not exist, a broad stock index, like the S&P500 is typically used (Rosenberg and Rudd, 1982). These kind of indexes are well diversified, and likely nearly all unsystematic risk has been eliminated, making them an acceptable proxy. In order to compute the market expected return, one can use the historical average of returns (stock price variation plus dividends). That is not, however, the only option. Rosenberg and Rudd (1982) point out that required rates of return implied by the answers in investor opinion surveys have been used, as well as services that compute equity risk premiums.
The remaining parameter one has to estimate in order to implement the CAPM is the beta. The beta is measure of the systematic risk of a given security when compared to that of the market as a whole (Rosenberg and Rudd, 1982). Beta can be computed, for listed companies, regressing the returns of the security on the returns of the market. It can be defined as:
However, the aforementioned authors warn that this only measures the historical alignment from the stock returns to those of the market. This can be used as an estimate to predict future alignment, but one needs to keep in mind that the figure used is nothing more than an estimate, and prone to error: the beta of the company may have changed overtime or there may be estimation errors due to chance events that may have influenced the way the stock returns correlated with the market returns in the past.
9 Another method based on historical returns, but on those of peers was described by the same authors. Instead of using the historical betas of the company, one could use an average of historical betas of its peer group. The main difficulty here would be to find comparable companies. The criteria to do so will always have some degree of arbitrariness, but that could be reduced by identifying the fundamental factors that most significantly influence betas and selecting companies that are similar with respect to those fundamental factors.
Talking about fundamental factors influencing beta leads us to the last method proposed by Rosenberg and Rudd (1982), based on company fundamentals. Multi factor econometrics models that take into account balance sheet and income statement characteristics can be used to predict the responsiveness of firm performance to market movements. The authors argue that this kind of models provide the most reliable way of estimating future betas.
Cost of Debt (Kd)
The cost of debt, as Damodaran (2002) points out, is the marked-to-market interest rate that the firm would pay on its borrowed funds. If the company has outstanding bonds with liquidity in the market, the yield to maturity can be used to obtain the cost of debt. If that is not the case, and the firm of interest is a rated company, we can use the default spread together with the risk-free rate to get an estimation of the cost the company would incur today to get the amount of debt it currently owns. Finally, if the company is not rated, the recent borrowing history can be used to infer a rating based on the spreads paid. Analysts can also produce a synthetic rating that could be used to estimate the cost of debt.
2.1.1.2. Adjusted Present Value (APV)
The Adjusted Present Value (APV) approach, divides the total value of the firm in value of the operating assets and value that comes from the financing structure (Damodaran, 2006). Therefore, the value of the firm is calculated by adding the value of the firm as if it had no debt with the present value of tax shields (Fernández, 2007).
This idea comes from the early work of Modigliani and Miller, that the value of a leveraged company can be calculated as (Booth, 2007):
10 is the advantage of using debt, that arises from the lower tax rate paid in each period due to the interest paid being considered a cost. The present value of the tax shield can therefore be calculated by multiplying the tax rate on corporate earnings by the amount of interest paid in each period and then discounting the flows to the present day. The discount rate to be used is controversial, but many authors deem the cost of debt (marked-to-market) to be an appropriate discount rate (Fernández, 2007).
However, the advantage of using debt is not simply the value of tax shields. Debt increases bankruptcy risk, and therefore expected bankruptcy costs shall be subtracted in order to get the firm value (Damodaran, 2006). Only after netting those expected bankruptcy costs against the value of tax shields are we able to assess the true advantage of using debt. This requires estimating the probability of default and the costs of bankruptcy which poses, according to Damodaran (2006) the most difficult estimation issue. He suggests that the first may be estimated calculating bond ratings or through statistical methods relying on the firm’s characteristics. The bankruptcy cost estimation would, however, have to rely on historical data concerning actual bankruptcies, which might lead to significant error, despite typically these being low compared to the firm value. More significant, but equally hard to estimate, are indirect bankruptcy costs, or distress costs, that arise due to the perception of distress, in the form of lost customers or higher employee turnover, among others, and that can severely affect the firms operations even if no bankruptcy happens (Damadaran, 2006). The author quotes studies that put these distress costs in between 10 and 25% of firm value.
There is, therefore, a trade-off between the benefits and the costs of a leveraged financial structure. This trade-off was studied by Myers (1974) and dubbed the static trade-off model. Booth (2007) proposes a more general formula to calculate firm value that shows explicitly this trade-off:
( )
In the above formula, stands for the net tax advantage, and is the distress function. Due to the difficulties in estimating the distress function, which may produce significant error given the representativeness of distress costs in the firm value, together with the fact that the capital structure of the company of interest will not likely suffer significant changes, we will not use this model to evaluate Mota-Engil.
11
2.1.1.3. Capital Cash Flow (CCF)
Ruback (2002) proposed a Cash Flow discounting method based on Capital Cash Flows. These are, in essence, similar to the Free Cash Flow, with the difference that while the latter excludes the tax shields due to interest paid, the first includes them. The obvious consequence is that the flows have to be discounted at the pre-tax weighted average cost of capital. The author proposed this alternative arguing that it is often easier to apply and less prone to error. Booth (2007) agrees with the importance of valuing companies using the most direct route, but believes Ruback overstated the advantages of the model he proposed. He argues that the CCF’s method offers in general no advantage with respect to the more often used Free Cash Flow to the firm approach.
2.1.2. Equity Valuation Models
As previously mentioned, Equity Valuation Models value only the Equity stake in the firm. In order to do so, we restrict our attention to the Cash Flows owed to equity investors in the firm. These Cash flows are discounted at the Cost of Equity, in order to adjust for riskiness of the Cash Flows (the discussion regarding the calculation of the Cost of Equity for WACC computation purposes also applies to these models).
When thinking about Cash Flows owed to equity investors, the first that would come to mind would be dividends. We will therefore start our analysis of Equity Valuation models by their oldest variant (Damodaran, 2006), the Dividend Discounted Model, and then analyze a broader definition of Cash Flows to equity by looking at the Free Cash Flow to Equity valuation model.
2.1.2.1. Dividend Discounted Model
The conceptual basis for Dividend Discounted models is that equity holders pay a price for a stock expecting to receive a return through dividends plus the selling price, which is, theoretically, a function of future dividends (Damodaran, 2006). Therefore, firm value can be computed as:
∑
12 Apart from the Cost of Equity, whose estimation was already discussed, we need to predict future dividends in order to implement this methodology. To do so, we need to forecast future earnings growth rates and payout ratios (Damodaran, 2006). As predictions are never going to be made until infinite, the Gordon perpetual growth formula provides a useful framework to value companies based on dividends. It requires the firm to be in a steady state growth path, which implies dividends are growing at the same rate as earnings, and that growth rate cannot be higher than that of the economy where the firm operates (Damodaran, 2006). Using this approach, firm value can be computed as:
Many analysts consider the focus of the dividend discounted model too narrow, and have therefore abandoned its use (Damodaran, 2006). The referred author points out a reason why this may be so. Dividends are many times not intrinsically related with earnings. While in the case where they are, on average, equal, Dividend Discounted Models have an advantage (as dividends are often less volatile and, therefore, easier to predict, yielding realistic estimates of firm value in this case), there are some cases where firms pay consistently less in dividends than what they earn, building cash balances. Such balances should be taken into account while valuing an equity stake, as the investor effectively owns a share of them. On the other hand, firms that are paying more in dividends than what they earn will be overvalued, as such behavior is not sustainable in the long run. Dividend Discounted Models have in its favor that dividends are the only tangible cash flow that investors receive (which could appeal to conservative investors, or be useful in order to establish a baseline for companies which pay less in dividends than their earnings). Also, prediction of dividends is often easier and requires fewer assumptions than that of FCF, which is the reason why Dividend Discounted Models are still used in industries where prediction of Cash Flows is hard, like the financial services industry.
Foerster and Sapp (2005) analyzed the performance of the Dividend Discounted Model as a tool to predict prices, and found it performs well for mature companies with history of paying dividends. Nevertheless, we agree with the limitations pointed out by Damodaran, and we believe that this narrow focus is not appropriate for our valuation of Mota-Engil. Therefore, although many variations for the basic dividend discounted model exist in the literature, we will not develop further on this subject.
13
2.1.2.2. Equity Cash Flows (ECF’s)
Equity Cash flows valuation models are a tool to estimate directly the value of equity that does not suffer from the same narrow focus than Dividend Discounted models.
Equity Cash Flows can be obtained from Free Cash Flows by subtracting from that measure the after tax interest payments and principal repayments, adding the value of new debt. It is the cash flow remaining for equity investors after subtracting all debt related flows (Fernandéz, 2007).
Firm value is simply the present value of ECF’s discounted at the cost of Equity (Fernandéz, 2006).
This type of valuation implicitly assumes that the owner of a share is entitled to its equivalent share of corporate income, even if the administration chooses not to pay it in the form of dividends, which is only reasonable where there is a strong corporate governance system, in which owners can force administration to put the unpaid earnings at the service of their best interests (Damodaran, 2006).
2.1.3. Excess Returns Valuation
In Valuation Models based on excess returns, cash flows are only considered to the point where they are above or below the required return (that depends on the riskiness of the Cash Flows). These models have their theoretical roots on capital budgeting, where a project is only good when it has positive net present value, and consequently, a flow has value only when it is higher than the cost of the capital employed to generate it (Damodaran, 2006).
Firm value can thus be computed as the sum of the capital invested and the present value of the excess returns.
The equivalence of the Excess Returns models to their Absolute Returns counterparts has extensively been shown in the literature as long as valuation assumptions are consistent (Damodaran, 2006).
We proceed by briefly analyzing the most used Excess Returns model, the Economic Value Added (EVA) model, and then just briefly mention its main variants.
14
2.1.3.1. Economic Value Added (EVA)
According to Damodaran (2006), Economic Value Added can be computed as:
Firm value will be afterwards be computed as:
∑
Where EVA is the Economic Value Added both for assets in place and new projects and is the cost on capital employed.
Capital invested can be estimated, in most situations, and despite its limitations, using the book value as a proxy. In situations where the number and extent of accounting decisions that affect the book value of capital is very large for book value to be an acceptable proxy, building an estimate of the capital invested by summing the market values of the assets in place is advisable (Damodaran, 2006).
Fernández (2002a) provides a more estimation-friendly formula to compute EVA:
Here, represent the firm’s book value and NOPAT is as usually the after tax operating income.
EVA is increasingly used by many firms as a performance measure to drive executive compensation (Fernández, 2002a). However, its significance has often been stretched to the point where it is frequently interpreted as the value creation in each period, which Fernández (2001a) shows not to be the case.
Fernández (2002a) is one of the authors that argues that we can get the same firm value by discounting EVA’s than by discounting ECF’s or FCFF’s, having these last two cash flows a more intuitive financial meaning, which makes it hard to argue for the superiority of the EVA model as a firm valuation tool.
15
2.1.3.2. Economic Profit
Economic profit is conceptually similar to EVA, but seen from the perspective of Equity investors (Damodaran, 2006). Economic profit can be computed as (Fernández, 2002a):
PAT is Profit after Tax, ROE is the Return on Equity, is the cost of Equity and is, just like in the following formula, the Equity Book Value
Having the Economic Profit for each period, one can value Equity directly as:
∑
2.1.3.3. Cash Value Added
The Cash Value Added is an alternative to EVA proposed by the Boston Consulting Group, who considers that EVA encourages anti-growth behaviors, like milking the business. Furthermore, BCG also points out that EVA is artificially low when an investment is made and artificially high at maturity due to assets depreciation, and favors large, low return businesses (Fernández, 2002a).
CVA adjusts EVA to a cash measure, by adding period depreciation to the operating result and accumulated depreciation to the book value of capital, which according to BCG, removes the worst of antigrowth bias. Should the reader be interested, a formula to compute CVA can be found in Fernández (2002a).
2.2. Liquidation and Accounting Valuation
When analyzing the excess returns valuation models the reader may have noticed they all add a book value component to the excess returns, showing that book values can also play a part in valuation. Unfortunately, on its own, book information has severe limitations. Most companies have lucrative growth opportunities, which are not registered as accounting entries. These
16 may even account for the largest part of firm value in high growth companies (Damodaran, 2006). Accounting Valuation looks at a company from a static perspective, ignoring the future (Fernández, 2007). These limitations have caused Liquidation and Accounting Valuation models’ importance to fade in most valuation situations. Nevertheless, it is useful to review the main models on this category, albeit briefly, as they are only going to be used in this paper to value financial investments, as a last resort, when no other public information is available..
2.2.1. Book Value
The Book Value is the value of shareholder Equity, as stated in the Balance Sheet. It is the difference between a firm’s assets and liabilities. This figure is subject to the subjectivity of accounting criteria, which often does not match market criteria (Fernández, 2007). Although severally flawed as a valuation method, especially for companies with growth and excess returns opportunities, Book Value still plays a role in investing decisions, being a criteria for some investors to consider a stock undervalued, idea that is actually backed up by some studies that found that low price to book value equities earn on average higher returns (Damodaran, 2006).
Some Balance Sheet items can be adjusted so that they reflect their respective market values instead of purely book values. This approach (Adjusted Book Value) overcomes some limitations of the purely Book Value approach, but as Damodaran (2006) points out, these adjustments are at best a delayed reflection of the market, and can be unreliable in the case of imperfect information.
2.2.2. Liquidation Value
Liquidation value is the value that would remain to the shareholders after the firm is liquidated (assets sold and debts paid). The selling value of an asset is often lower than the value obtained from discounting the flows that that asset expects to generate, as selling assets with urgency often implies selling them at a discount to their market value (Damodaran, 2006). There are also liquidation expenses that have to be taken into account.
17 Fernández (2007) argues that this approach is useful as a firm valuation tool, only in the specific case that a firm is bought to be liquidated. Nevertheless, it provides in all cases a lower limit to the firm value.
Another similar approach is the Substantial Value model, which instead of calculating the liquidation value, calculates how much it would cost to create a firm with similar operating conditions (Fernández, 2007).
2.3. Relative Valuation
Another large category of models increasingly used in firm valuation are relative valuation models. These value a firm based on how much the market is paying for its peers (a group of firms that are comparable to the firm in analysis), which is a rather significant departure from Discounted Cash Flows models, where the intrinsic value of the asset is estimated (Damodaran, 2006). Despite these two different philosophies, in an efficient market, the Equity Value found using Relative Valuation should not depart significantly from the one found in Discounted Cash Flow models. We therefore believe it would be interesting to compare the value for Mota Engil using these two types of models, which we will do latter in this paper. Da and Schaumburg (2011) studied whether equity analysis provide investors information not already reflected in the price of an asset, and found out that intra-industry relative valuations provide substantial information for the short term horizon, further expanding our interest in such valuation.
Fernández (2001b) warns that due to the dispersion usually found in the multiples, valuations using this method are debatable. However, he recognizes the importance of relative valuation as a means of comparing the results of a previous evaluation using another method. Goedhart et all. (2005) also emphasize that valuation using multiples can be used to stress test the results of Discounted Cash Flow valuation.
Relative valuation starts by establishing a peer group, proceeds by standardizing the prices using multiples (in order to account for differences in size between the companies) and may include a last step adjusting for fundamental differences across assets (Damodaran, 2006). Below we will have a more detailed look into each of these steps.
18
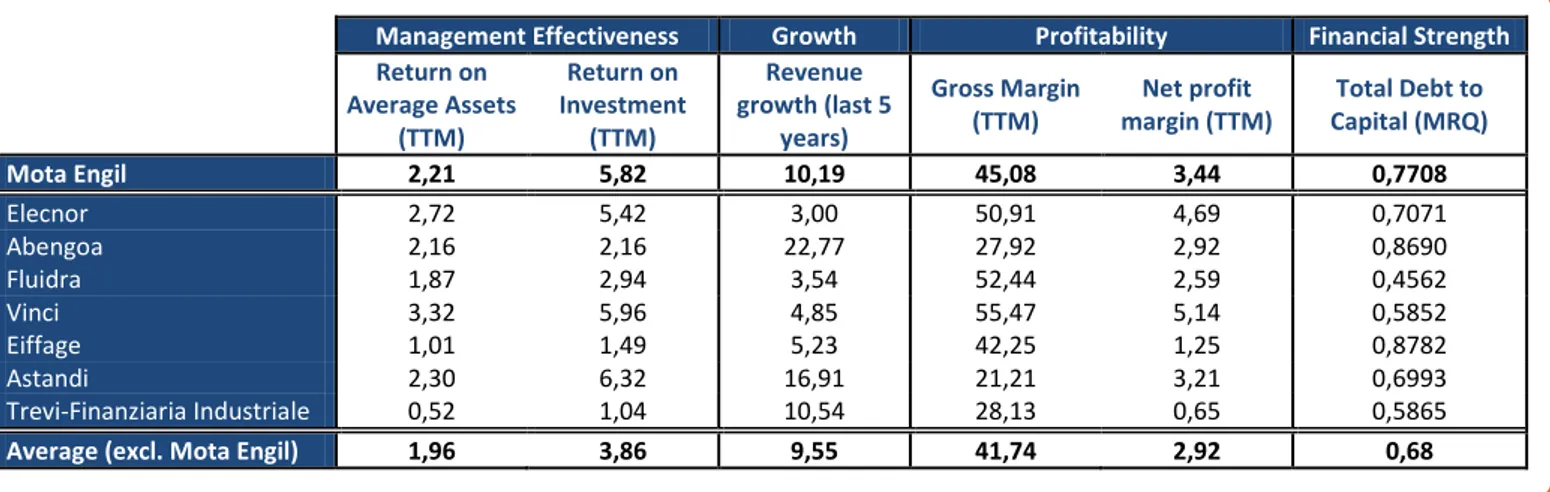
2.3.1. Establishing a Peer Group
In order to perform relative valuation a set of comparable firms must be found. According to Damodaran (2006): “A comparable firm is one with cash flows, growth potential, and risk
similar to the firm being valued”. Goedhart et all. (2005) warns that it is an error to use an
industry average multiple and multiply it by the corresponding firm’s figure in order to obtain a value estimate, as not all companies in an industry are comparable. He stresses one must match companies with similar growth expectations and ROIC.
Damodaran (2006) states that being in the same industry is not a necessary condition for being a comparable firm. There are other fundamental criteria that can be used when picking companies for a peer group. One could use firms that have similar earnings’ growth, risk (beta) and return on equity. These criteria do not outperform industry based categorization, according to Alford (1992), as quoted by Damodaran (2006). He also quotes other authors (Cheng and McNamara (2000), Bhojraj and Lee (2002)) that argue that combining industry categorization with some fundamental criteria can, however, increase the precision of relative valuation, a recommendation that we will follow in latter sections of this paper.
2.3.2. Multiples
As discussed above, in relative valuation multiples are used to standardize assets of different sizes.
Multiples can be divided in 3 main categories: Multiples based on Equity Value, Multiples based on Company Value and Growth Multiples. Multiples based on Equity Value have in the numerator the market capitalization or an equivalent measure. Company Value multiples on the other hand, have in the numerator the enterprise value (Equity+Debt). Growth multiples add a factor in order to standardize with respect to growth expectations and are most frequently used in high growth industries (Fernández, 2001b). Goedhart et al. (2005) recommends the use of enterprise value multiples, as they are not systematically affected by capital structure.
According to the aforementioned author, one must use forward looking multiples, based on forecasts for the coming years rather than based on data from past years. These are not only theoretically more correct, as they perform better empirically (see, for instance Liu et al.
19 (2002) for an empirical study attesting the superiority of forward looking multiples with respect to their historical counterparts).
Bellow we discuss the 4 most frequently used multiples, according to a study of Morgan Stanley quoted by Fernández (2001b), the ones that are used by more than 10% of the analysts.
2.3.2.1. Price to Earnings ratio (PER)
This is by far the most widely used multiple according to Morgan Stanley, being used by more than 50% of the analysts.
PER can be computed as (Fernández, 2001b):
Despite its popularity, Goedhart et al. (2005) argue that PER is misleading, as non-recurring, non-operating items are often embedded in the earnings figures. Furthermore, as an Equity value based multiple, it is dependent on capital structure, as already mentioned above.
2.3.2.2. Enterprise Value to EBITDA (EV/EBITDA)
Enterprise Value to EBITDA (calculated dividing these two concepts) is the second most used multiple by analysts. It benefits from the advantages pointed out by Goedhart et al. (2005) to enterprise value multiples. However, Fernández (2001b) points some drawbacks to this measure, namely for being non inclusive of variations in working capital requirements, nor considering capital investments. It is one of the multiples that are frequently used in the construction business, according to Fernández (2001b), being the only one in the mentioned set that is simultaneously used by a large share of valuations, and takes into account the recommendation of Goedhart et al. (2005) of using enterprise value multiples. As such, it is the main multiple we will choose further ahead in this paper to value Mota Engil.
Goedhart et al. (2005) stresses that in order to correctly compute this multiple, one should first make some adjustments: remove excess cash and other non-operating assets, adding to the market value of debt the value of leased items (and the corresponding interest expense to
20 EBITDA), take into account all employee grants outstanding as well as pension plans liabilities, adding its present value.
2.3.2.3. Enterprise Value to EBITDA growth (EV/EG)
Computed as follows, it is used in high growth industries, which is not our case, and as such, will not deserve further attention:
⁄ ⁄
2.3.2.4. Price to Book Value (P/BV)
Dividing the Market Capitalization by the Book Value of the Equity, one computes this ratio. It is used fundamentally to value banks and insurance companies, as well as companies in the paper and pulp, plus real estate business.
2.3.3. Adjusting for differences across assets
Damodaran (2006) adverts that no matter how careful we are in choosing comparable assets, differences are bound to remain. These differences, especially when they are deemed relevant, should be adjusted. Three types of adjustments are proposed by the author:
Subjective Adjustments, Modified Multiples and Statistical Techniques.
Subjective adjustments are done based on expert criteria. If a company has a different multiple than its peers, a judgment must be made by analysts with industry expertise to assess whether fundamental differences between the firms can explain the difference or whether the firm is actually under or overvalued. The author warns that these expert criteria may be in some cases little more than an informed guess, and may reflect personal biases.
Multiples can be modified in order to take into account the most important determinant of its value. For instance, dividing a P/E ratio by the expected growth rate of Earnings per Share provides a P/E ratio adjusted for differences in growth, which can be useful to value high growth companies, especially when finding a set of comparable firms with the same growth
21 prospects is not possible. Making this kind of adjustment implies the assumptions that the firms are similar in all other variables, and that there is a linear relationship between multiples and fundamentals (Damodaran, 2006).
Often there is complex relationship between multiples and fundamental factors, case in which statistical approaches for the adjustments are the most promising ones. In this approach, we explain the multiple that we are concerned about based on the fundamentals that affect it, through a sector or market regression. Through the output of these regressions, one can judge the differences found in the multiples to be either explained by fundamental factors or due to under/overvaluation (Damodaran, 2006).
2.4. Contingent Claim Valuation
The above described methods are not suitable to value a company that has flexibility to take (or not) an action in the future, when the result of a now uncertain variable will be known (Fernandéz, 2002b). These options – Real Options – need to be valued separately. A number of methods can be applied to valuing real options. Always taking into account whether an option is replicable or not (and applying the correspondent adjustments to the formulas in case it is not), Fernández (2002b) states a real option can be valued “using Black and Scholes’ formula,
the formulas developed for valuing exotic options, by simulation, the binominal formula, or by solving the differential equations characterizing the options”.
Mota Engil has no real options that would affect valuation in material terms, and therefore we will not get any further into the methods described above, as none of them will be used in the following sections of this paper.
22
3. COMPANY PRESENTATION
Motal Engil is the largest Portuguese construction group, and number 29 in the top European construction companies1. It is also the 5th Portuguese company in exports and the leader in service exports. It was founded in 1946 by Manuel António da Mota, and in that same year a subsidiary in Angola was also created. This historical bond with the African market would turn out to be in a key strength for the group in the latest years, as Europe is facing a tough recession.
Besides Engineering & Construction (E&C), Mota Engil operates in several areas of Environment and Services (E&S) and partners with Banco Espírito Santo for the business of Transport Concessions (Ascendi). It also has a stake in metallic construction and solar energy, through Martifer, with whom it maintains a strategic partnership, and in other activities such as tourism and mining.
On top of the historical presence in Angola, the group has been reinforcing its international presence in the last few years, covering other African countries as well as having now a strong position in central and Eastern Europe. South America has also a representative stake in the company’s turnover.
Main facts about Mota Engil:
2011 9M12
Turnover 2.176 M€ 1.687 M€
EBITDA 296 M€ 217 M€
Consolidated Net Income 71 M€ 58 M€
Backlog 3.797 M€ 3296 M€
1 All information in this section can be found at, and is the most recent disclosed through, the company’s website (www.mota-engil.pt), corporate presentation (
http://www.mota-engil.pt/images/content/2573_1_G.pdf) or the company’s management and financial reports (http://www.mota-engil.pt/InvestorBoard.aspx?contentId=131&Language=1).
23 Bellow we take a closer look at the main businesses Mota Engil is engaged into.
3.1. Engineering & Construction:
The Engineering & Construction area of Mota Engil has its focus on real estate, infrastructures and civil construction, as well as some other smaller business areas. The activity accounts for 80% of the group’s turnover and 67% of EBITDA. This activity is undertaken in four geographical segments: Portugal, Central Europe, Africa and Latin America
Some indicators of this segment in 20112:
Turnover 1.747 M€ EBITDA 200,7 M€ Net Income 64,8 M€ Backlog 3.400 M€ 2
Starting from 2012, the company ceased to report figures by business. Instead, it is reporting figures by geographic segment (Portugal, Africa, Central Europe and Latin America, sometimes reporting for Portugal the division between E&C and E&S). While we had to try our best in extracting information by business from the management report in order to perform our DCF valuation, we chose to include in this section only information that can be directly verified in the previously mentioned sources, and refrain from including specific figures that are only our best judgment with respect to 9M12 by business segments. Also, please bear in mind that quarterly information regarding activity is considerably more limited than full year info. 2012 forecasts based on 9M12 information can be found in the DCF valuation section. 27% 11% 43% 19%
Backlog by Geography (9M12)
Portugal Central Europe Africa Latin America24 Since 2010 this business has been growing in turnover, driven by the good performance of Central Europe and Latin America. The operational margin has also been improving.
Below are the main highlights of each of the geographical segments in this business area.
3.1.1. Portugal
This geographical segment includes, besides Portugal, residual activity in Spain and Ireland. The construction sector in Portugal has been greatly affected by the crisis the country is involved in. With reduced credit access and lack of public investment, the sector has seen its demand decrease 9,4%, which, together with an excess of capacity, is putting downwards pressure in the margins of the companies that operate in this segment.
Despite this, Mota Engil has been able to maintain its activity in 2011 and even improve operational margins, due to the quality of its backlog. For that, the following projects gave an important contribution: highway constructions (Douro Interior and Pinhal Interior), works in Porto’s “Bom Sucesso” marketplace, Fórum Sintra mall, Nissan battery factory, “Foz Tua” dam, hospitals of Loures and Terceira Island, hydroelectric central in Venda Nova, new coach museum, several hydraulic infrastructures and schools for “Parque Escolar”. In real-estate, a fully customized building in Parque das Nações was rented for 15 years. A tendency of increase in road construction as well as less and larger projects was observed.
In the first 9 months of 2012, however, Engineering & Construction turnover in Portugal was falling 20,8% with respect to the same period of the previous year, although the company still managed to improve the operating margin to 11,9%.
3.1.2. Central Europe
Despite being also present in Czech Republic, Slovakia and Hungary (operations in Romania were closed in 2012), the bulk of the activity in this geographical segment is undertaken in Poland.
This country has experienced accelerated construction growth in the last years, driven by the Euro-2012, infrastructure investment supported by European Union’s funds and real estate growth. Despite the growth tendency having slowed down in 2011 (due to a decrease in
25 highway and Euro-2012 related construction), strong investments are expected in the coming years in regional and county roads as well as some road works on a public-private partnership (PPP) model. It is also expected that the improvement of residential construction as well as energy and environmental infrastructures present interesting opportunities for Mota Engil. Mota Engil has in this region a strong (>350M€) and diversified backlog, and is experiencing strong growth (turnover of 362M€ in 2011 vs 191M€ in 2010, continuing to increase at a rate around 20% in 2012). To that growth contributed several highway projects as well as several residential projects, which are in the scope of the strategic plan. Operating margins in the segment, which were already very low (<4%), have been deteriorating due to the harsh conditions of the Polish market.
3.1.3. Africa
Business in Africa centers itself in Angola, Mozambique and Malawi, although the segment is also represented in São Tomé and Príncipe and Cape Verde, with projects in study in other growing countries. It accounts for one third of the group’s engineering and construction revenues. The group’s historical ties to the continent put it in a great position to benefit from the strong growth potential of these countries, to which the investment in infrastructures gives a major contribution.
In Malawi, the construction of a 145km rail line to support the mining activity of Vale, the giant Brazilian mining company was awarded to Mota Engil in a 700 million dollars contract, contributing to the private mining industry supported backlog of 662M€ (2011).
Infrastructure construction has been growing in Mozambique, benefiting from foreign investment and foreign aid programs, which resulted in an 86% turnover growth in the country in 2011. The year was marked by the conclusion of Olympic Games infrastructure in Maputo. In Angola, where Mota Engil is present through a partnership with Sonangol (controlled by the Mota Engil group), the backlog grew in 2011 291M€, contradicting the 14% contraction in turnover in the country, explained by delays on the side of the promoters of some major projects. Some important projects awarded to Mota Engil include the Calueque dam, the Sonangol expansion project, a large real estate project and the third phase of the Finicapital financial city.
26 In the first nine months of 2012, turnover has been growing at a rate close to 30%, supporting excellent growth perspectives in this continent which are reinforced by a very strong backlog.
3.1.4. Latin America
The business in Latin America is centered in Peru and Mexico, having the activity in Brazil started in 2012. The company is also currently studying several projects in Colombia.
Activity in Peru, once fundamentally based on earthmoving for the mining industry has now been diversified to road construction and infrastructure maintenance. The result of this diversification was immediate, with turnover more than doubling since 2010.
The profile of a highway in Mexico was increased in 2011. The works on this highroad contributed to the performance of this segment.
3.2. Environment & Services
Environment & Services is a diversified business area of Mota Engil, which accounts for 20% of the group’s turnover and 33% of the EBITDA (2011’s figures). Its activities range from the management of urban waste and cleaning systems to the management of logistic infrastructures like ports, passing through water systems, cargo rail transport, construction and maintenance of public facilities and green spaces, among others. Mota Engil is the market leader in the provision of port and waste management services in Portugal.
Below are some operational indicators from 2010 that illustrate the activity of Mota Engil in this area:
Waste gathering and treatment 3 million tons
Costumers served by water systems 203 thousand customers
Cargo moved in ports 8 million tons
Green space maintenance 2 million m2
27 The activity in translated into the following financial indicators in 2011:
Turnover 346 M€
EBITDA 97,1 M€
Net Income 13,3 M€
Backlog 400 M€3
Bellow we take a deeper look at each of the segments of this business area: waste management, water systems, logistics and multiservices.
3.2.1. Waste management
Mota Engil’s sub-group SUMA is the leading player in the national market for integrated waste management. Joining the capabilities of SUMA with Correia & Correia and Enviroil, other two companies of the group, Mota Engil is able to provide services related to gathering and treatment of solid urban waste, as well as industrial waste, urban cleaning, gathering and treatment of used oils and environmental education in the national territory. Although the majority of the activity is undertaken in Portugal, there is also some activity in Poland (through Ekosrodowisko) and in Angola (through Vista Waste), which already account for 25% of the turnover of this segment. This international expansion will grow in importance as opportunities for growth within the country exhaust, given the little effort of public entities to give incentives and opportunities for the expansion of the role of private companies in these businesses.
Still, this segment has managed to achieve a residual growth in turnover (to 120,5M€ in 2011), which coupled with a sound increase in the operational margin (from 26,6% in 2010 to 32,3% in 2011) resulted in a 22,5% EBITDA growth y.o.y. (to 38,9M€ in 2011).
3
Only waste management and multiservices contracts. The company does not consider backlog the foreseeable revenues of concession contracts for water systems and ports
28 With 3100 workers, 1130 vehicles, 2400 light equipments and 73000 containers, Mota Engil provides waste services to 3 million people in Portugal, half a million in Poland and 1 million in Angola.
3.2.2. Water
Indaqua is the sub-group of Mota Engil who owns the (25 to 50 years long) water and/or sanitation concessions in 6 Portuguese counties (Fafe, Santo Tirso, Trofa, Santa Maria da Feira, Matosinhos and Vila do Conde). It also has a public-private partnership (PPP) with the county of São João da Madeira for the management of the public water supply and wastewater collection systems, with an unlimited life. Together, these concessions and the PPP serve more than 200.000 clients with a supply network of 4400 km. Internationally, Indaqua controls Vista Water that operates in Angola and is currently responsible for the technical advisory for the “Water for all” government program. Indaqua is also present in Macau and in Peru.
In 2011, public tenders were scarce and consistently delayed, a tendency which was not inverted in 2012 so far, but is expected to be inverted in the coming years due to the state’s budget difficulties. Despite this, the number of customers in Portugal increased 3,9%, for a total of 23M m3 of water served. In sanitation, 15,2M m3 was invoiced on 142 thousand users, in 2011. The activity in 2012 did not depart significantly from these levels, despite an increase in turnover having been registered due to accounting matters.
Aside from participating in all national public tenders that prove financially sustainable, Indaqua will also seek to be present in tenders in Peru, as well as searching for new international opportunities.
3.2.3. Logistics
The logistics segment comprehends the group’s activity related to the operation of ports and road/rail terminals, transporting of goods over rail and integrated logistics services.
In Portugal, Tertir (the sub-group that owns the logistic companies) leads the operation of Lisboa, Leixões, Sines and Aveiro ports. It is the first private operator to enter the goods railway transport activity and is a co-promoter of Poceirão logistics platform, the largest in the country. At the international level, the group owns a 30 years concession in Paita port (Peru)
29 and a 35 years concession for the Ferrol containers terminal in Galicia (Spain). The company Transitex is also having a good international performance with door-to-door container movements in Spain, Mozambique, Mexico, Brazil, Colombia and Peru.
Due to the recession in Portugal, the exports sector has boosted its activity, benefiting the ports, which moved almost 800 thousand containers in 2011, an 11% increase vs 2010. Logistics activity in Portugal has continued to grow in 2012, registering a 20% increase y.o.y. in the first nine months of the year, and it is expected that this effect continues in the coming years while internal demand does not recover significantly. Reflecting this, logistics further consolidates its position as the largest contributor to the Environment & Services performance.
3.2.4. Multi Services
This area of Mota-Engil provides a vast array of services in which sub-contracting can be an interesting alternative to its clients. Among other activities, Monta Engil is present in the industrial and building maintenance business through Manvia and Almaque; it works in landscaping, building and maintenance of green spaces and golf courses through Vibeiras, Áreagolfe and VBT; direct mailing (through Lokemark), electronic market operation (Vortal) and parking lot management (EMSA and Parquegil) are also businesses under the Multiservices segment of Mota Engil.
In 2011, the activities in this segment generated a turnover of 59M€, yielding an EBITDA of 4,3M€, a 7% increase year over year. Contributing to those figures, we highlight the role of Manvia, with a turnover of 19M€ associated with an operational margin increase (figures which are strengthened by a 74M€ backlog), and Vibeiras, with a turnover of 23M€. This last company has an international presence in Angola, Mozambique and Morocco.
3.3. Transport Concessions
The Ascendi Group is Mota Engil’s strategic partnership with Banco Espírito Santo for the transport concessions. It explores more than 1600 km of highroads in Portugal, joined by 1400 km in Spain, Mexico, Brazil and Mozambique. This figure is likely to grow in the coming years as the company explores new opportunities in its current geographies, but also in India, where in 2011 the company participated in the pre-qualification for the Six Laning of Agra-Etawah
30 Bypass Section, Six Laning of Chandikhole-Paradeep Section and Six Laning of Gundugolanu to Rajahmundry Section projects, in partnership with Essar Projects Limited, having been pre-qualified for the first of them and expecting to be pre-pre-qualified for the remaining two.
Ascendi invested in 2009 in the new Multi-Lane Free-Flow electronic toll system, in order to toll the former “SCUT’s” (highroads without cost for the user). This project has already earned the company several technological awards. Through this system, Ascendi currently manages more than 100 billing points and processes 1 million transactions each day.
31
4. DISCOUNTED CASH FLOW VALUATION
As discussed in the literature review, we will use the Discount Cash Flow method as our primary valuation method. Below we describe our assumptions and valuation results.
The valuation will be done as of 31st of December of 2012, and all market parameters refer to that date, unless otherwise stated.
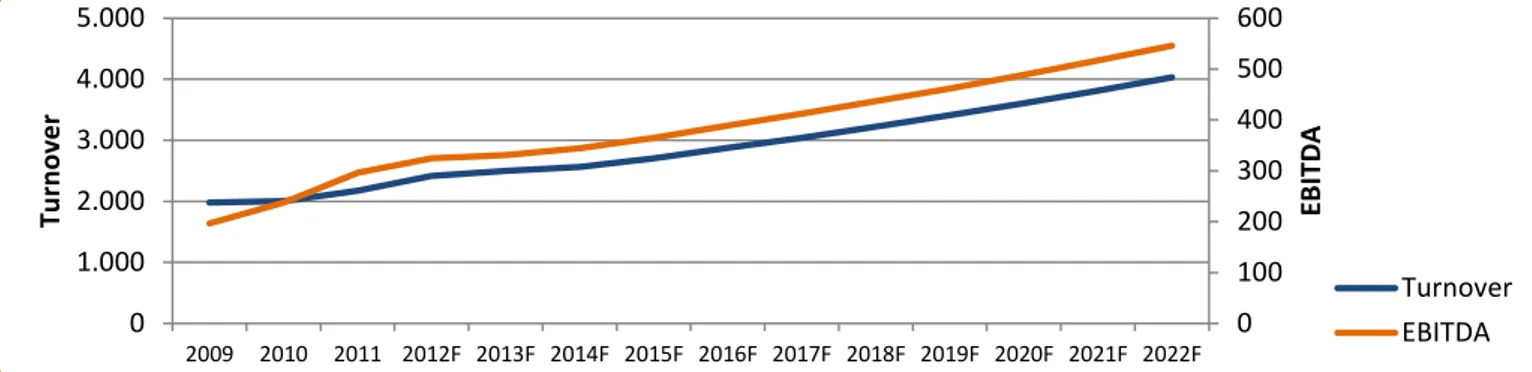
4.1. Turnover
Motal Engil’s revenue in the coming years is a critical variable that will impact our valuation. As such, a strong emphasis will be put in forecasting them as accurately as possible taking into account the information freely available.
As full year data for 2012 is not yet available to the public, and since a starting point was necessary to estimate the revenues from 2013 to 2022, turnover for 2012 was assumed to grow with respect to 2011 at the same rate that turnover for the first three quarters of 2012 grew with respect to the same period of 2011. Although the year of 2012 is outside the scope of the valuation, forecasts for that year indirectly impact our forecasts for the explicit forecast period.
4.1.1. Engineering & Construction Turnover
Given the lack of company specific forecasts (being the year of 2012 the exception, as discussed above), as a general rule, industry growth forecasts were used as a proxy for the revenue growth of Mota Engil, and when no such forecasts were available, the rougher proxy of GDP growth (nominal, euro) was used until 2017, the last year the IMF provides growth forecasts for countries. In the remaining years of the explicit forecast period, we took in consideration the 2020 Outlook from Global Construction 2020 presentation4, before growth
4
Global Construction 2020 presentation – FICEM general assembly: http://www.ficem-apcac.org/boletines/asamblea2011/presentaciones/global_construction_ficem_2011.PDF