Equity Valuation Research:
Corticeira Amorim SGPS S.A.
Francisco Emanuel Saraiva Ramos Moreira Gomes 152415025
Advisor: Professor José Carlos Tudela Martins
Dissertation submitted in partial fulfillment of requirements for the degree of MSc in Finance, at Católica Lisbon School of Business and Economics, 21st of December 2016
ABSTRACT:
Equity Valuation Research: Corticeira Amorim SGPS S.A.
By Francisco Emanuel Saraiva Ramos Moreira Gomes
Every single existing asset has value, including companies. The main purpose of Equity Valuation is to determine, at a given time, the value of a specific company, taking into account its past, present and future expected performance, as well as its market position and assets. Thus, Equity Valuation turns out to be very useful namely because it allows investors to take better informed investment decisions. To perform a true valuation, the implied assumptions must hold and be consistent to obtain a trustworthy and reliable scenario of the company’s reality. A good valuation needs to consider both internal and external factors that influence, positively or negatively, the company’s performance during its professional activity. It is also important to state that there are a large variety of possible valuation methods, which will result in different results and with different accuracy.
The present dissertation is an Equity Valuation of Corticeira Amorim GSPS S.A., the world’s biggest cork-transforming company and the most international Portuguese company. While many companies have failed to survive to the financial crisis, Corticeira Amorim managed to succumb it due to its sustainable growth over time. Moreover, after analyzing the company’s financial statements, its consistently positive results are noticeable. Having said so, it appears to be a good company to invest in, as its recent and future expected performance seems to be aligned with investors’ expectations. This dissertation aims to suggest investors as to whether they should invest, or not, in Corticeira Amorim, taking into account its estimated market value.
ABSTRACT:
Equity Valuation Research: Corticeira Amorim SGPS S.A.
By Francisco Emanuel Saraiva Ramos Moreira Gomes
Todo e qualquer ativo tem um determinado valor, nomeadamente as empresas. O principal objetivo de uma Equity Valuation é determinar o valor de uma empresa, num dado período, tendo em consideração a sua performance passada, presente e futura, além da sua posição de mercado e dos seus ativos. Assim, uma Equity Valuation é extremamente útil, nomeadamente porque permite aos investidores tomarem decisões melhor informados. Numa boa avaliação, os pressupostos têm de ser realistas e consistentes de forma a representar um cenário realista da realidade da empresa. Uma boa avaliação tem também de considerar fatores internos e externos à empresa que influenciam, positiva ou negativamente, o seu desempenho durante a sua atividade profissional. É importante referir que há uma grande variedade de métodos de avaliação, levando a diferentes resultados e com diferentes graus de precisão.
Esta dissertação incide sobre a Equity Valuation da Corticeira Amorim SGPS S.A., a maior empresa transformadora de cortiça do mundo e a empresa Portuguesa mais internacional. Enquanto muitas empresas faliram durante a crise financeira mundial, a Corticeira Amorim conseguiu ultrapassar este período devido ao seu crescimento sustentável ao longo dos anos. Analisando os seus relatórios financeiros, são evidentes os resultados positivos consistentes. Assim, parece ser uma boa empresa para investir devido ao seu bom desempenho recente e ao desempenho esperado no futuro. A dissertação sugere aos investidores se estes devem, ou não, investir na Corticeira Amorim, tendo em conta o seu valor de mercado.
ACKNOWLEDGEMENTS:
A dissertation is, in the majority of cases, the final step of a student’s academic path. After many years of persistent effort and much stress, I am able to affirm that many people helped me get over the many obstacles and difficulties I faced throughout my entire personal and academic life.
Firstly, I would like to thank my family for all the support, motivation and important advice transmitted throughout my life that has led to who I am today and what I have achieved so far. Without them, especially my parents Maria João and Francisco, I would not be able to have written the present dissertation. They know everything I have gone through my entire life and they were always by my side.
Secondly, I thank all my friends, that have played a major role in my life. Most of who I am today is because of them. Fortunately, I am surrounded by good and loyal friends, that helped me not only in my academic path but also in my personal life, especially João M., João P., Luis, Gonçalo and Leonardo. We spent a lot of time together, not only at college and those long hours working all night, but also outside the college where we had lots of enjoyable moments.
I would also want to thank professor José Carlos Tudela Martins for all his support, patience, availability and advice he so generously gave me during the whole semester.
Finally, I would also like to thank my girlfriend, Diana, for her friendship, patience and for being such a good person. She knows just as well as my parents do what I have been through and her support has been vital for both my personal and academic development.
TABLE OF CONTENTS:
0. Introduction ... 1
1. Literature Review ... 2
1.1. Valuation Approaches ... 2
1.2. Discounted Cash-Flow (DCF) Valuation ... 3
1.2.1. Free Cash Flow to the Firm and Free Cash Flow to Equity ... 5
1.2.2. Terminal Value ... 6
1.2.3. Weighted Average Cost of Capital (WACC) ... 8
1.2.3.1. Cost of Equity (Ke) ... 8
1.2.3.2. Risk-Free Rate ... 9
1.2.3.3. Beta ... 10
1.2.3.4. Equity Risk Premium ... 10
1.2.3.5. Cost of Debt (Kd) ... 11
1.2.3.6. Debt and Equity Weights ... 11
1.3. Dividend Discount Model ... 12
1.4. Relative Valuation through Multiples ... 13
1.4.1. Price Earnings Ratio (PER) ... 14
1.4.2. Enterprise Value to EBITDA (EV/EBITDA) ... 14
2. Overviews ... 14 2.1. Macroeconomic Overview ... 14 2.1.1. Global Overview ... 14 2.1.1.1. Euro Zone ... 15 2.1.1.2. United States ... 16 2.1.1.3. Japan ... 16 2.1.1.4. United Kingdom ... 16 2.1.1.5. Australia ... 16 2.1.1.6. Emerging Markets ... 16 2.1.2. Portugal Overview ... 17 2.2. Company Overview ... 18
2.2.1. About Corticeira Amorim ... 18
2.2.2. Business Activity ... 19
2.2.3. Business Units and Individual Performance ... 21
2.2.4. Global Performance ... 24
2.3. Industry Overview ... 26
2.3.1. International Market ... 26
2.3.2. Portuguese Cork Market ... 29
2.3.3. Wine Industry ... 36 2.3.4. Construction Industry ... 40 2.3.5. Legislation ... 41 3. Methodology ... 41 3.1. Discounted Cash-Flow ... 41 3.1.1. Forecast Assumptions ... 41 3.1.1.1. Sales ... 42 3.1.1.2. Cost of Sales ... 43
3.1.1.3. Operational items and EBITDA ... 43
3.1.1.4. Depreciation ... 44
3.1.1.5. Taxes ... 45
3.1.1.6. Capex ... 45
3.1.1.7. Working Capital ... 47
3.1.2.1. Cost of Equity ... 48
3.1.2.1.1. Risk-Free Rate ... 48
3.1.2.1.2. Market Risk Premium ... 49
3.1.2.1.3. Beta ... 49
3.1.2.2. Cost of Debt ... 49
3.1.2.3. Weights of both Debt and Equity ... 50
3.1.3. Free Cash-Flows to the Firm ... 51
3.1.4. Terminal Value ... 52
3.1.5. Enterprise Value and Equity Valuation ... 52
3.1.6. Suggestion ... 53
3.1.7. Sensitivity Analysis ... 53
3.2. Dividend Discount Model ... 54
3.3. Relative Valuation ... 55
3.3.1. EV/EBITDA ... 56
3.3.2. Price/Earnings Ratio ... 56
4. Dissertation vs BPI Equity Research ... 57
4.1. Operational Components ... 57 4.2. Capex ... 58 4.3. Working Capital ... 59 4.4. Cash-flow ... 59 4.5. Wacc ... 60 4.6. Results ... 60 5. Conclusion ... 61 6. Appendixes ... 63
6.1. Appendix 1: Adjusted Present Value vs Discounted Cash-Flow ... 63
6.1.1. Adjusted Present Value (APV) ... 63
6.1.2. APV vs DCF approach ... 63
6.2. Appendix 2: Income Statement of Corticeira Amorim ... 65
... 65
6.3. Appendix 3: Balance Sheet of Corticeira Amorim ... 66
6.4. Appendix 4: Cash-Flow Map of Corticeira Amorim ... 67
6.5. Appendix 5: BPI’s Valuation Profit & Losses - Corticeira Amorim ... 68
6.6. Appendix 6: BPI’s Valuation Balance Sheet - Corticeira Amorim ... 69
6.7. Appendix 7: BPI’s Valuation Cash-Flow Map - Corticeira Amorim ... 70
7. References ... 71
7.1. Websites ... 71
7.2. Books ... 71
7.3. Articles ... 71
Table of Figures
Fig. 1 - Business Structure of Corticeira Amorim ... 18
Fig. 2 - Corticeira Amorim's shareholder structure ... 19
Fig. 3 - Business Units specifications ... 20
Fig. 4 - Corticeira Amorim's strategy and objectives ... 20
Fig. 5 - Raw Materials business unit performance ... 21
Fig. 6 - Cork Stoppers business unit performance ... 21
Fig. 7 - Floor & Wall business unit performance ... 22
Fig. 8 - Composite Cork business unit performance ... 22
Fig. 9 - Insulation Cork business unit performance ... 22
Fig. 10 - Consolidated business unit contribution ... 23
Fig. 11 - Consolidated sales by business unit ... 23
Fig. 12 - Consolidated sales by region ... 24
Fig. 13 - Corticeira Amorim performance summary ... 24
Fig. 14 - Net profit composition of Corticeira Amorim ... 25
Fig. 15 - Corticeira Amorim stock performance ... 26
Fig. 16 - Work annual cork production ... 27
Fig. 17 - Number of companies operating on the cork industry ... 27
Fig. 18 - World cork exports ... 28
Fig. 19 - World cork imports ... 28
Fig. 20 - Sales structure per product ... 29
Fig. 21 - Portuguese cork exports ... 30
Fig. 22 - Portuguese international balance regarding the cork industry ... 30
Fig. 23 - Cork export weights compared to total Portuguese exports ... 31
Fig. 24 - Portuguese cork exports per destiny ... 31
Fig. 25 - Main products exported (million €) ... 32
Fig. 26 - Main products exported (thousand tons) ... 32
Fig. 27 - Evolution of cork stopper exports ... 33
Fig. 28 - Cork stopper exports to the 6 main countries (million €) ... 33
Fig. 29 - Exports of construction/decoration materials by main countries of destination .. 34
Fig. 30 - Evolution of Portuguese cork imports ... 35
Fig. 31 - Main countries of origin of Portuguese cork imports ... 35
Fig. 32 -Total surfaces area of vineyards in EU 28 (thousand ha) ... 36
Fig. 33 - Total surfaces area of vineyards outside EU 28 (thousand ha) ... 36
Fig. 34 - World wine production (thousand hl) ... 37
Fig. 35 - Wine production against wine consumption... 37
Fig. 36 - Main world wine exporters (million €) ... 38
Fig. 37 - Main world wine exporters (million hl) ... 38
Fig. 38 - Wine consumption evolution ... 39
Fig. 39 - Main world wine importers (million €) ... 39
Fig. 40 - Main world wine importers (million hl) ... 40
Fig. 41 - Trends in the issuing of building permits in the EU28, in square meters ... 40
Fig. 42 - Sales historical behavior, ignoring Euro-Dollar ratio gains ... 42
Fig. 43 - Sales historical growth... 42
Fig. 44 - Sales behavior in the forecasted period ... 43
Fig. 46 - Margin increase and cost of sales during the forecasted period ... 43
Fig. 47 - Operational items historical data ... 44
Fig. 48 - Operational items in the forecasted period ... 44
Fig. 49 - Historical depreciation and amortization ... 44
Fig. 50 - Forecasted depreciations and amortizations ... 45
Fig. 51 - Historical earnings ... 45
Fig. 52 - Forecasted Earnings ... 45
Fig. 53 - Historical Capex ... 46
Fig. 54 - Forecasted Capex ... 46
Fig. 55 - Forecasted current items ... 47
Fig. 56 - Working capital calculation ... 47
Fig. 57 - Company's historical financing mix ... 48
Fig. 58 - Wacc calculation ... 48
Fig. 59 - Cost of equity calculation ... 48
Fig. 60 - Market risk premium calculation ... 49
Fig. 61 - Beta ... 49
Fig. 62 - Interest coverage ratio ... 49
Fig. 63 - Rating and spread according to the interest coverage ratio ... 50
Fig. 64 - Cost of debt calculation ... 50
Fig. 65 - Historical capital structure ... 51
Fig. 66 - Forecasted capital structure ... 51
Fig. 67 - Present value of the cash flows... 51
Fig. 68 - Terminal Value calculation ... 52
Fig. 69 - Pondered growth ... 52
Fig. 70 - Value of the operating assets of the firm ... 52
Fig. 71 - Price per share calculation ... 53
Fig. 72 - Current vs fair price and suggestion ... 53
Fig. 73 - Sensitivity Analysis regarding sales, margin and capex ... 53
Fig. 74 - Sensitivity analysis regarding wacc and growth ... 54
Fig. 75 - Present value of future dividends ... 54
Fig. 76 - Dividend perpetuity and share price ... 54
Fig. 77 - Peer group used in the relative valuation ... 55
Fig. 78 - Relative valuation vs DCF results ... 56
Fig. 79 - EV/EBITDA results ... 56
Fig. 80 - Price/Earnings Ratio results ... 56
Fig. 81 - Operational items comparison ... 58
Fig. 82 – Capex comparison ... 58
Fig. 83 - Current items comparison ... 59
Fig. 84 - Changes in net working capital comparison ... 59
Fig. 85 - Cash flow comparison ... 59
Fig. 86 - Wacc and related items comparison ... 60
0. Introduction
This dissertation will focus on Corticeira Amorim SGPS, S.A. by valuing the company’s business, in order to determine which is the value per stock unit, in 2016. By getting the value and comparing it to the market, it will be possible to conclude whether investors should invest, disinvest or keep their position when it comes to investment decisions. Corticeira Amorim SGPS, S.A. is the world’s leader operating in the cork industry and the most international Portuguese company due to its exportation level. It belongs to the Amorim Group, representing its core business, majorly held by the Amorim family. It is traded in the Portuguese PSI 20 index on the Lisbon Stock Exchange.
Due to the 2009’s global financial crisis, many companies are facing difficulties all over the world and Portugal is not an exception. Many companies have closed doors and many others are fighting for survival. However, there are a few companies that managed to, in a certain way, get over it. Corticeira Amorim GSPS, S.A. is one of those companies that managed to register positive results. Due to its global and international position, the market variety – namely construction and wine -, and sustainable growth over time, it managed to reinforce its’ market share, not only in Portugal but also worldwide, strengthening their leading position in the cork-industry.
Corticeira Amorim has five different business units: Raw materials, Cork Stoppers, Floor & Wall Coverings, Insulation Cork and Cork Composites. It is important to mention that Corticeira Amorim is leader in every single cork segment it operates in. Because the company does not provide data concerning each business unit, the valuation with take into account the consolidated data.
In order to get an easier understanding and more pleasant reading, the dissertation’s structure will be divided into four parts. Firstly, the Literature Review, where all Equity Valuation related topics will be presented and discussed as well as the used models. Secondly, both company and industry overview so that a closer insight is provided and to contextualize Corticeira Amorim within the cork industry reality. The third part has to do with the Equity Valuation of Corticeira Amorim, measuring the value of the company following the Discounted Cash-Flow approach, using consolidated data, as well as the Relative Evaluation and the Dividend Discount Model.
The fourth and last part consists on a comparison between the dissertation’s results and the BPI Bank Equity Research, explaining the main differences.
1. Literature Review
1.1. Valuation Approaches
According to Damodaran (2002) “valuation plays a key role in many areas of finance – in corporate finance, mergers and acquisitions and portfolio management”. When it comes to portfolio management, the referred role depends on the type and philosophy of the investor, whether it is active or passive, as it will have higher impact on active investors. Even among active investors, the impact may be different due to investors’ investment preferences, as some prefer to invest in the market while others prefer to invest in specific firms. Therefore, it is vital for active and firm-specific investors, as they trade more and riskier assets. Regarding mergers and acquisition analysis, valuation plays an important role as the bidding firm/investor has to decide which is the fair value to offer before making the bid. On the other hand, the target firm also needs to know which is the fair value in order to accept or reject the offer. In this particular fields, valuation must include synergies on the combined value of both companies, which are gains driven by the merger. Finally, corporate finance’s goal is the firm’s value maximization. Having said so, a set of financial and strategic decisions have to be delineated to reach that objective. Some management consulting firms started to provide services in order to help companies with the internal process, as “the value of the firm can be directly related to decisions that it makes”.
The focus of this dissertation is to value Corticeira Amorim SGPS, S.A. and its price per share in order to, comparing it to the market, give some piece of advice whether investors should buy, keep or sell the company’s stocks. As expected, such decisions will depend on the fact that shares and overvalued, undervalued or correctly valued.
There is a wide range of methods used by analysts to value a company, some are simpler and others more sophisticated. Despite the fact that different methods use different assumptions, they share some common characteristics. From the wide range of possible methods, the DCF
This referred model consists on “valuing the business according to its expected future cash-flows discounted to present value at the weighted-average cost of capital of the firm” (Luehrman, 1997). Some different existing models are based on the DCF model. Because there may be valuation problems during the process, different approaches may be needed.
Generally speaking, according to Damodaran (2002), an alternative method is the Relative Valuation, which values an asset taking into account the price of comparable assets in the market. By comparable it is considered variables as sales, earnings, cash-flows, company’s size and markets. This method will be used to test DCF’s consistency.
Regarding Corticeira Amorim SGPS, S.A. and taking into account its characteristics and financial reports, the Discounted Cash-Flow is the most suitable approach to be used in the valuation process during the dissertation. For being the most common approach and because the company has a stable capital structure, the DFC approach was the chosen method. The Adjusted Present Value (APV) was an alternative method but it is most suitable for companies with fluctuations on the capital structure in time, which is not the case of Corticeira Amorim SGPS, S.A. Appendix 1 provides a comparison between DCF and APV methods. Due to the company’s healthy financial situation, it has been paying dividends over the last years and, therefore, a DDM (Dividend Discount Model) will also be presented in this dissertation.
1.2. Discounted Cash-Flow (DCF) Valuation
Over the last decades, the Discounted Cash-Flow approach to perform a valuation has revealed to be the best and the most common method. This approach “values the company on the basis of the net present value (NPV) of its future free cash flows which are discounted by an appropriate discount rate” (Florian Steiger, 2008). In other words, it is focused on determining the present value of future forecasted cash flows, which are discounted to the present at a specific discount rate, the weighted average cost of capital (WACC), which is the “opportunity cost of the company, representing the return its owners expect to earn on an alternative investment implying the same risk” (Luehrman, 1997). The formula for the NPV calculation is presented below.
Some different Discount Cash Flow models follow the same methodology, taking into account the relation between future and forecasted cash flows and its present value. However, they also have some differences, namely cash flow components, tax effects and discount rates. Among the Discount Cash Flow models, the most commonly used are the Free Cash Flow to the Firm (FCFF), Free Cash Flow to Equity (FCFE) and the Adjusted Present Value (APV). The Dividend Discount Model, which will be used in this dissertation as previously mentioned, is a variant of the Free Cash Flow to Equity model.
It is also important to mention that both forecasts and discount rate calculations are based on certain assumptions according to the specific company under the valuation process, which are according to Janiszewski (2011), the macroeconomic, industry and business information. These assumptions must be accurate and clear in order to obtain an understandable and trustworthy valuation. At this stage, managers face a difficult time as forecasting growth rates and cash flows is a difficult task, not only because there is uncertainty about the company’s future performance but also because the macroeconomic environment may face changes that will affect the company and its professional activity’s performance. Bad forecasts and mismeasurement of macroeconomic variables may lead to high fluctuations on the company’s value, making the valuation less realistic.
The first step of valuating a company using the DCF model is to predict the future free cash flows for the next 5 or 10 years, until it reaches a steady state. Free Cash Flow is simply the amount of cash that the company does not need for reinvestment nor operational purposes. The second step is to determine the discount rate (WACC) in order to obtain the present value of the future cash flows. At this stage, all variables are estimated and ready to calculate the Net Present Value (NPV). The third step is to compute the terminal value, which is “the net present value of all future cash flows that occur after the time period that is covered by the scenario analysis” (Florian Steiger, 2008). The fourth and final step is to sum up the net present values of the cash flows and the terminal value, according to the following formula.
1.2.1. Free Cash Flow to the Firm and Free Cash Flow to Equity
Both Free Cash Flow to the Firm (FCFF) and to Equity (FCFE) can be used to perform a Discounted Cash Flow Valuation. Free Cash Flow to the Firm is the cash flow that is available to debt and equity holders while the Free Cash Flow to Equity is the cash flow available to the company’s equity holders only. The FCFF approach has the enterprise value of the company as outcome while the FCFE outcomes equity value. Because the acquirers buy the whole company with its debt, equity and liabilities, the FCFF approach is the best approach to use. Formula presented below according to Damodaran (1996).
Once the company’s earnings before interests and taxes (EBIT) is computed, the Free Cash Flow to the Firm can be calculated by deducting taxes to EBIT. At this stage, the outcome is the Net Operating Profit After Taxes (NOPAT).
EBIT is, basically, the financial result of the period – generally a semester or a year. It is computed by getting the company’s operating revenues and deducting its’ operating expenses, interest payments and income taxes. The expected and forecasted growth will have impact not only on revenues, but also on expenses, which will influence EBIT directly. The Tax Rate to be used is the effective tax rate, which is the actual tax rate companies have to pay.
Depreciation is the cost associated with the item’s useful lifetime. According to Koller et al. (2005), a way to forecast is in relative terms, as a percentage of other items. This way splits in two, as it can be measured as a percentage of revenues or as a percentage of property, plant and equipment (PP&E).
The Capex (Capital Expenditures) is money spent by the company to buy or upgrade physical assets, namely property, industrial buildings or equipment. Typically, it is associated to the company’s growth, as higher growth levels are associated to higher Capex. It can be forecasted in relative terms, as a percentage of financial items like revenues or earnings, or using the Capex/Depreciation ratio, as these two items are deeply correlated.
The Working Capital measures short-term financial health. It can be calculated through the difference between current assets and liabilities, which was the used method in the dissertation. If the differential turns to be negative, the company may face difficulties to repay to its debt holders (creditors) in the short run due to liquidity issues. Because the Working Capital depends on many different financial items, forecasting it gets more complex as it is necessary to forecast every single item. According to Koller et al. (2005), the items should be forecasted in relative terms. Therefore, accounts receivables, accrued expenses, property, plants & equipment and goodwill should be forecasted as a percentage of revenues. On the other hand, inventories and accounts payable should be a percentage of costs of goods sold (COGS).
1.2.2. Terminal Value
The company’s value is, again, given by summing up the present value of the forecasted cash flows – NPV, discounted using WACC – plus the terminal value. The Terminal Value (TV) represents the present value of all future cash flows that are expected to happen after the forecasted period. Therefore, it is plausible to affirm that it includes earnings that will occur in the distant future that are nearly impossible to forecast (perpetuity). Damodaran (2012) argues that the stable growth model is one of the best approaches to use in this chapter. Under the free cash flow to the firm methodology, the formula to estimate the Terminal Value is given by
which can also be used in Free Cash Flow to Equity and Dividend Discount Model. FFCF n+1 represents the expected free cash flow to the firm one year after the terminal year; WACC stands for the weighted average cost of capital; g is the constant growth rate the company will take for perpetuity. In order to compute the terminal value, the company must be growing at a steady state and with expectations to sustain in perpetuity.
Damodaran (2006) argues that there are two essential conditions when making assumptions regarding the growth rate. The first states that the growth rate cannot be higher that the economy’s growth rate. The second states that reinvestment must be perfectly coordinated with the growth rate assumption, and vice versa. Moreover, Kaplan and Ruback (1995) argue that
these two subjects. The reason behind this statement is that the company will only reinvest in depreciated items, keeping its assets value constant in the long run.
The growth rate assumption, constant and related to perpetuity, will have an enormous impact on the company’s value. Moreover, it seems to be the majority of the company’s value. When determining the company’s growth rate, some variables must be taken into account so that a trustworthy and realistic firm value is obtained as outcome, namely the business growth strategy and the industry in which the company operates.
The forecast period assumed in a valuation (n), according to Koller et al. (2005), has no direct impact on the company’s value but will instead change the “distribution of the company’s value between the explicit forecast period and the years that follow”. The longer the forecast period, higher the weight of the present value of the forecasted cash flows on the company’s value and lower the weight of the terminal value. The author argues that the appropriate length of the forecast period should be correlated with the period in which the company reaches the steady state. If not correlated, the terminal value will not be a useful tool in the valuation process. Reaching the steady state means that variables as growth rate, capital turnover, wacc and margins get to a certain point in which its behavior does not change. Ohlson and Xiao-Hun Zhang (1999) believe that a forecast period should never be longer than 15 years and Lee (1996) believes that, typically, forecast period should be between 5 and 15 years.
After calculating the Terminal Value, all variables are set to determine the Value of Operating Assets of the Firm, given by
The first half of the equation represents the present value of the forecasted cash flows and the second half represents the present value of the cash flows that will occur after the forecasted period (perpetuity). In order to obtain the final equity value of the company all non-equity items must be subtracted so that the outcome is the company’s equity value.
1.2.3. Weighted Average Cost of Capital (WACC)
The most common DCF valuation method is the WACC-based DCF approach. The WACC – weighted average cost of capital – is the rate that allows discounting the Free Cash Flows to the Firm and is one of the most important variables of the Discounted Cash Flow model, as small changes in the WACC calculation will lead to big variations on the company’s value. According to Koller et al. (2005), “WACC represents the opportunity cost that investors face for investing their funds in one particular business instead of others with similar risk”. To compute the proper discount rate not only a deep analysis to the company’s financial structure is needed but also to the market environment. Typically, companies have two different ways to finance themselves, by using Debt or/and Equity. Therefore, the WACC rate must include the required return rates demanded by both debt and equity holders, as stated by the formula presented below.
Kd(1-Tc) stands for the market after-tax cost of debt, Ke represents the market cost of equity and both D/V and E/V the weights of debt and equity related to the company’s value, respectively.
Regarding leveraged companies, the WACC calculation must be done after taxes in order to incorporate the benefits from using Debt as financing because interest expenses do not pay taxes. Having said so, because these benefits are not included in the Free Cash Flow to the Firm calculation, they must be included in the cost of capital. These benefits are known as interest tax shields. Therefore, the company’s chosen capital structure also impacts the firm’s value, which will be explored in more detail in the equity and debt weights chapter.
1.2.3.1. Cost of Equity (Ke)
The Ke is the expected return on a company’s stock. According to Steiger (2008), investors require a certain return for bearing the risk of holding a company’s share. Because it is very difficult, or impossible, to predict expected returns, estimations have to be made. The most used estimation tool is the Capital Asset Pricing Model (CAPM), computed following the presented
According to Mullins (1982), the model takes some assumptions, namely that investors are well-informed and risk-averse and that there is a perfect market (no taxes, transaction costs or restrictions on borrowing/lending). Therefore, by diversifying the investment portfolio, the unsystematic (company or industry specific) risk can be eliminated, being the systematic (market) risk the only one investors have to deal with. Having said so, the CAPM model estimates expected return rates taking into account the market behavior and the risk/expected return trade-off.
Analyzing the formula previously presented, Rf stands for the risk-free rate, Rm is the market return and the beta is the degree of correlation between the market and the company. (Rm –Rf) represents the market risk premium (MRP), which is the excess return obtained by bearing the market risk, compared to the Risk-Free rate. In order to compute the cost of equity, all these parameters need to be estimated.
Many authors do not agree with this approach. However, according to Mullins (1982), “CAPM’s deficiencies appear no worse than those of other approaches”, which brings the idea that there is no perfect or better estimation model. On the same hand, it takes into account the inherent risk and measures it so that the outcome is the expected rate of return for investors.
1.2.3.2. Risk-Free Rate
The risk-free rate should be estimated taking into account long-term government default-free bonds, according to Koller et al. (2005). The idea behind this statement is that developed countries situated in the United States or in the Western Europe are likely to have low betas and, therefore, government bonds are believed to be a good proxy to determine risk-free rates. Because Corticeira Amorim SGPS, S.A. is situated in Portugal, this case is applicable to the company, being the 10-year German Eurobond the commonly used proxy for estimating the risk-free rate due to its low risk and high liquidity.
1.2.3.3. Beta
As suggested by Koller et al. (2005), Beta (degree of autocorrelation) is “the stock’s incremental risk to a diversified investor, where risk is defined by how much the stock covaries with the aggregate stock market”, measuring the systematic/market risk. In order words, for higher beta values (higher than 1), the market will have a higher impact on the company’s stock performance. On the other hand, for lower beta values (lower than 1), the market will have lower impact on the company’s stock performance. Furthermore, it is plausible to affirm that investors with higher beta investments will be facing a higher degree of risk, which will be reflected in their higher expected rate of return.
Damodaran (1999) states that the Betas can be computed by using linear regressions with both corporate stock’s return and a chosen market index’s return (used as a proxy for the real market portfolio) data. The outcome of the linear regression is the slope of the regression, also known as beta. When performing these computations, the three variables used for beta estimation have to be very carefully chosen as they influence the estimation accuracy. These variables are the time frame, the intervals (namely monthly or yearly data) and the market index. Damodaran (1999) reinforces the importance of the chosen index and the possible consequences of choosing a bad one. It may happen to choose a market index which is “heavily weighted by a few dominant companies in the market portfolio leading to biased beta estimations”. This scenario is more likely to happen in emerging markets due to the fact that those markets are very dependent on few powerful industries. Because Corticeira Amorim SGPS, S.A. is Portuguese, the chosen index was the PSI 20 index. The author affirms that, to get more accurate betas, monthly data should be used instead of yearly data. Because the company may be levered, a small adjustment has to be made in order to obtain the levered beta, by using the leverage factor.
In order to get accurate estimates, consistent assumptions have to be made and they must hold in time. Real betas are difficult to obtain but good estimates can be made.
1.2.3.4. Equity Risk Premium
As previously described, the Equity Risk Premium is the excess return (Rm – Rf) demanded by investors for bearing additional risk (Damodaran, 2008) compared to risk-free assets, as
long-this variable, it is of critical importance. According to Damodaran (2008) one possible way to compute it is to use historical data regarding stock performances over the risk-free rate, which is the most commonly used. However, this method also has limitations, namely because emerging markets are relatively recent and have few amounts of available data. Therefore, the standard deviation of the observations would be high.
1.2.3.5. Cost of Debt (Kd)
Most likely, companies finance themselves using more than just one resource, namely through both equity and debt. In order to compute the cost of debt (Kd), variables as risk-free rate, debt’s tax advantages and default risk must be considered (Damodaran, 2012). The same author presents two ways to calculate the company’s cost of debt, depending whether the company has, or not, long-term bonds outstanding and traded on the market. If the company does have, the inherent yield can be used as a proxy to determine the cost of debt. If the company does not, the company’s cost of debt is determined according to its investment rating and, consequently, default spreads. The cost of debt is computed following the presented formula.
The first step is to compute the interest coverage ratio. Each interest coverage ratio value is associated to a specific rating, which can be checked with rating agencies as Standard & Poor’s,
Fitch or Moody’s. The interest coverage ratio is a profit/debt ratio that reflects the ability of the
company to pay, or not, its debt interests. After having the interest coverage ratio and the corresponding rating, the default spread is taken and summed to the risk-free rate. At this point, the pretax cost of debt is computed. Interests have tax advantages (interest tax shield) and, therefore, those same advantages have to be taken into account in the calculations. That is why the after-tax cost of debt is computed.
1.2.3.6. Debt and Equity Weights
The chosen capital structure also impacts the firm’s value. Companies choose its capital structure trying to maximize the “financial mix” advantages. Debt has the ability to increase the value of a company until certain point due to the interest tax shield it provides. However, there is a point in which debt becomes too high and, consequently, the interest tax shield value
becomes smaller than the bankruptcy and agency costs associated to the over-debt level. For this reason, this trade-off between interest tax shields and Bankruptcy/Agency costs regarding the capital structure is so important and managers must focus on this subject. According to Kraus and Litzenberger (1973), and Miller (1977) every single company has an “optimal capital structure” that maximizes financing mix advantages and minimizes the cost of capital. The current capital structure was used in the wacc calculations as it reflects the recent pattern.
1.3. Dividend Discount Model
The dividend discount model (DDM) is, according to Damodaran (2002), “the simplest model for valuing equity”. It consists on determining the stock’s value by forecasting dividends and discounting them to the present.
The author states that “when investors buy stocks, they generally expect to get two types of cash-flow – dividends during the period she holds the stock and an expected price at the end of the holding period. Since this expected price is itself determined by future dividends, the value of a stock is the present value of dividends through infinity”. Having said so, the DDM consists on computing the presented formula.
The DPS stands for the expected dividends per share and Ke is the previously explained cost of equity, the two basic inputs of the model. The model relies on the fact that “the value of any asset is the present value of expected future cash-flows discounted at a rate appropriate to the riskiness of the cash-flows” (Damodaran, 2002). In order to get the expected dividends, assumptions have to be made regarding both earnings growth rate and payout ratios.
Because the Gordon Growth Model is the simplest and the most commonly used, it will be the one used in this dissertation. Furthermore, and according to Damodaran (2002), it “is best suited for firms growing at a rate comparable to or lower than the nominal growth rate in the economy and which have well established dividend payout policies that they intend to continue into the future”, which seems to be the case of Corticeira Amorim GSPS, S.A.
The Gordon Growth Model, according to Damodaran (2002), can be used in a valuation process regarding a company which is in a “steady-state” and with sustainable growing dividend rate in time. It outcomes the value of the stock in the next period by using expected dividends per share (DPS), cost of equity (Ke) and dividends expected growth rate (g) as inputs, according to the formula presented below.
The author presents a limitation to the model. The growth rate plays a major role in the calculations and the model is highly sensitive to it. If a proper perpetuate growth rate is not computed, the outcome will be misleading. Therefore, it is plausible to affirm that computing the perpetuate dividend growth rate is vital to a trustworthy outcome concerning the company’s valuation.
1.4. Relative Valuation through Multiples
Damodaran (2006) defines relative valuation as “the valuation of corporate assets based on similar assets in the market”. Relative valuation is a simple valuation method. However, to perform a good multiple analysis, it is needed to determine not only which multiples to use and why, but also the guidelines to correctly use them.
There are some items to consider in order to perform a good multiple analysis. First, defining the peer group may be a hard task. The market, the industry, sales, investments, the ROIC (return on invested capital), growth or earnings are just some examples of variables that may be used to determine the comparable companies. Second, there are, among others, equity and enterprise-value multiples, which will be the ones used in this dissertation. The most common multiple regarding equity-based is price-earnings ratio (PER). Regarding the enterprise-value-based, the most common used are the enterprise value-to-EBITDA (EV/EBITDA) or the enterprise value-to-sales (EV/Sales).
Both Morgan Stanley (1999) and Damodaran (2002) stated that, for European companies, the most common multiples are EV/EBITDA and PER. Therefore, concerning Corticeira Amorim GSPS, S.A., these will be the multiples used in the relative valuation.
1.4.1. Price Earnings Ratio (PER)
The price earnings ratio is one of the most common multiples used among corporate finance. Goedhart et al (2005) states that this multiple should only be used in companies where a scenario of consistent capital structure is verified, without heavy fluctuations, as changes on the capital structure will have direct impact on both price and earnings per share.
The price earnings ratio value has an inherent conclusion attached. If this value is high, the company is believed to be capable of keep growing in time and that its earnings are solid. Therefore, the cost of capital in this scenario should be low. On the other hand, if the value is low, the opposite scenario is verified. This way, by using multiples, it is also possible to conclude the existing level of risk.
1.4.2. Enterprise Value to EBITDA (EV/EBITDA)
Goedhart (2005) affirms that this multiple is not so exposed to the company’s capital structure as the PER is because the enterprise value (EV) includes both debt and equity, while the PER is equity-focused. Therefore, this multiple has one big advantage comparing to the previous one as it allows investors to compare companies with different capital structures.
2. Overviews
2.1. Macroeconomic Overview
2.1.1. Global Overview
The year of 2015 showed, surprisingly, a lower growth compared to 2014, which was estimated to be around 3,1%. The growth level of emerging markets was, for the fifth consecutive year,
lower. In fact, it was the lower level since the 2008-2009 global financial crisis, around 4%. The developed markets have grown at a higher rate.
Despite the fact that the US Federal Reserve had normalized the Dollar interests rate, the monetary policy was, globally speaking, of accommodation, while the budget policies reflected lower growth restrictions. Divergences between both the US and United Kingdom, and the rest of developed markets regarding monetary policies, affected the economic performance of several emerging markets. The dominant perspective of gradual increasing interest rates in the US, as well as volatility episodes due to uncertainty related to the impact on emerging market growth, determined even more restrictive conditions worldwide and the acceleration of the capital exit from those emerging markets.
The unfavorable behavior of commodity prices, the slower industrial activity and the decreasing international market indicators characterize the economic context of 2015, especially the final quarter of the year.
Besides, and also related to these events, the conjuncture was influenced by changes in China’s growth pattern. The local entities are seeking to balance growth towards services and internal demand, guaranteeing a more sustainable expansion.
The US Dollar registered a general trend of gains.
2.1.1.1. Euro Zone
The Euro zone registered an expansion around 1,5%, higher compared to 2014. However, a higher growth was expected on 2015. The domestic demand improved and, in a certain way, compensated the lower performance of liquid exportations, due to good financing conditions, lower oil prices and global neutral policies. The Chinese and other emerging countries economic deceleration, as well as the high debt level on the private sector, made difficult the economic recovery. Unemployment level decreased around 1%, but big disparities are still observable between the countries. Despite the monetary stimulus implemented, inflation registered marginal positive oscillations.
2.1.1.2. United States
The US, the world’s biggest economy, registered a 2,5% growth, higher compared to 2014. It was the sixth consecutive year growing for this economy, making evidences of real estate industry improvement, increasing sales and better conditions regarding labor market. Unemployment level reached a historical minimum, a record 5%. The oil price decrease, on the other hand, must have had an impact on gas and crude extraction investments, penalizing the aggregated domestic demand, especially on the last quarter of the year. The industrial sector showed deceleration, affected by the worldwide deceleration and the USD appreciation.
2.1.1.3. Japan
Japan’s growth was higher than in 2014, estimated to be around 0,6%. Confronted with China and rest of Asia softening economy, which are its main exports destinies, entities seek to support economy through monetary policies.
2.1.1.4. United Kingdom
The UK has shown a 2,2% growth, comparing to 2,9% in 2014. The perspective of a referendum regarding to stay, or not, in the European Union and the uncertainty about the result must be one of the factors that penalized the country’s economy growth.
2.1.1.5. Australia
Australia managed to grow its economy around 2,4%. However, this increase is lower than the one verified in 2014.
2.1.1.6. Emerging Markets
Regarding the emerging markets, it was observable a growth rate around 4%, which translates on a shrinking growth over the recent years.
India is believed to have had a similar growth than in 2014, around 7,3%.
Brazil and Russia registered severe economic contraction, around 4%.
South Africa’s economic growth was lower than in 2014 and was estimated to be around 1,3%.
2.1.2. Portugal Overview
Portugal managed to achieve, in 2015, the second consecutive year growing after the long recession. The country’s economy is estimated to have grown 1,7%, marginally above the Euro zone average. However, despite these two consecutive positive years, Portugal could only recover one third of the value destroyed during the global crisis. The increasing activity is linked to a higher internal demand, especially investment, and to gains from external liquid demand, due to good exports performance. The public consumption contributed to growth after four years of contraction. The economic growth was more evident in the first half of the year, decreasing its level on the subsequent semester, probably due to political uncertainty.
Both US and China’s developments, as well as Angola and Brazil, affected the external liquid demand. On the other hand, from the positive side, the favorable energetic input prices and the monetary policy followed by ECB (European Central Bank) were favorable variables.
Portugal kept under European Commission’s analysis due to excessive debt and, therefore, there was a big effort towards public accounts consolidation. The political uncertainty paused this referred process. Budget deficit decreased 3% of the GDP (gross domestic product) and there was a 5% increase on tax revenues. However, the structural deficit raised.
Portugal achieved higher liquidity levels, concerning current items. Regarding exportations, the country proceeded with market diversification. Unemployment revealed surprising results, as it reached levels around 12,2%. It is still very high but there are observable results as it reached 16% not many years ago. The verified inflation was 0,6%, which is higher than the European average.
2.2. Company Overview
2.2.1. About Corticeira Amorim
Corticeira Amorim GSPS, S.A. started in 1870 in Aveiro, Portugal, created by the Amorim family, and was focused on producing Port wine cork stoppers. The company managed to grow in that segment and expanded its activity to other cork areas and applications. Nowadays it is the world leader in the cork-industry regarding all product segments: wall and floor coverings, corks stoppers, composite cork and insulation cork. It is the most international Portuguese company, not only because of its high exportation level but also because it has different steps of the value chain spread all over the world, including more than 100 countries. Internally, the company is divided into 3 major divisions, which subdivide into 5 business units, as suggested by the figure presented below.
Regarding the shareholder structure, figure 2 illustrates the shareholder’s ownership. Corticeira Amorim integrates the Euronext Lisbon Index and is traded on the PSI 20 index, which includes the best Portuguese companies.
Fig. 1 - Business Structure of Corticeira Amorim Source: Corticeira Amorim Website
2.2.2. Business Activity
Corticeira Amorim provides high-quality products and operates in several industries, namely civil construction, wine, automotive and even aeronautic, as cork turned to be a useful resource in multiple areas. It includes not only cork production but also transformation and R&D. A high degree of integration is observable regarding management as Corticeira Amorim controls every step of the value chain, from supplying to after-sales services.
The company also has social and environmental behavior besides its professional activity. As an example, in order to preserve the environment, it helps to plant trees in areas that were devastated by fires.
Purchasing, storage and preparation of raw material - cork
Presence in raw material producing countries: Portugal, Spain, Marocco, Algeria, and Tunisia (without owning the forests)
Control of the raw material flow across other business units
World’s largest supplier of cork stoppers
Presence in all the big wine-producing countries: France, Spain, Portugal, Italy, South Africa, Chile, Argentina, Germany, Australia and USA
Wide cork stopper portfolio, adapted to specific types of wine/champagne
World market leader in producing and distributing insulation cork
Development and supply of thermal and acoustic insulation solutions used in pipelines, airports, buildings, wine cellars and refrigeration industry
Raw Materials Cork Stoppers Insulation Cork Composite Cork Composite Cork Composite Cork
Corticeira Amorim SGPS, S.A. shareholder structure %
Amorim Capital, SGPS, S.A. 51%
Investment Holdings, B.V. 19%
Amorim International Participations, B.V. 15%
Other 15%
Fig. 2 - Corticeira Amorim's shareholder structure Source: Corticeira Amorim, annual report, 2015
World market leader in composite cork segment
Solution to several applications: sealing, thermal and noise insulation, decoration, electric transformers, natural gas applications, thermal protections and footwear components
World market leader in producing and distributing wall coverings
Supplier of innovative flooring solutions using cork coverings for interior decoration
The Research and Development department also plays a key role inside the company. It is incorporated in each business unit in order to develop new products, with new characteristics. Furthermore, and for a higher degree of innovation, new market requirements and needs are tailored by “MOR for cork” which is the Market Orientated Research.
Composite Cork
Floor & Wall Coverings
Fig. 4 - Corticeira Amorim's strategy and objectives Source: Corticeira Amorim
Fig. 3 - Business Units specifications Source: Corticeira Amorim
Strategic Objectives Reinforce leadership in procurement/ acquisition of raw materials Reduce and optimise costs Profitable growth Focus on end clients and improve customer value Improve product
mix and increase weight of value added products Strengthen leadership in R&D Improve distribution network efficiency Improve efficiency in every activity of value chain
2.2.3. Business Units and Individual Performance
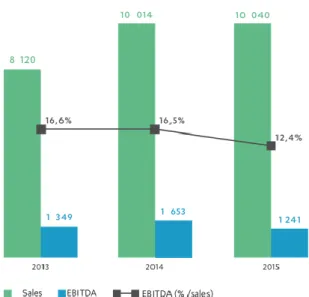
Considering the recent performance (fig.13), Corticeira Amorim managed to have its best year ever in 2015 regarding sales and results. Sales reached the 604,8M€, a 7,9% increase compared to 2014, namely due to the Euro-Dollar exchange effect. All business units registered increasing sales in 2015, except floor & wall coverings. The good operating performance led EBITDA to reach 100,72M€ (16,1% increase compared to 2014), being over 100M€ for the first time.
The company also managed to decrease both its debt level and interest rates due to the recently observed good performance. Earnings were also a record, around 55,012M€ (attributable to shareholders), a 53,9% increase compared to 2014, which is a huge improvement, especially considering that the world crisis still has impact worldwide namely due to financial markets’ lack of confidence and political instability. Own shares were sold in September 2015 resulting on a 15% freefloat and an incremental liquidity. As outcome of a good year, the dividends paid were high (37,72 cents per share). The performance of each business unit is shown on figures 5, 6, 7, 8 and 9, which will be reflected on the overall performance (fig.10).
Fig. 5 - Raw Materials business unit performance Source: Corticeira Amorim, Annual Report 2015
Fig. 6 - Cork Stoppers business unit performance Source: Corticeira Amorim, Annual Report 2015
Fig. 7 - Floor & Wall business unit performance Source: Corticeira Amorim, Annual Report 2015
Fig. 8 - Composite Cork business unit performance Source: Corticeira Amorim, Annual Report 2015
Fig. 9 - Insulation Cork business unit performance Source: Corticeira Amorim, Annual Report 2015
Fig. 10 - Consolidated business unit contribution
Source: Corticeira Amorim, Annual Report 2015
Fig. 11 - Consolidated sales by business unit Source: Corticeira Amorim, Annual Report 2015
Analyzing figure 11, it is observable that cork stoppers have a high weight on sales, representing 64,2% of total sales. On the same hand, by analyzing figure 12, it is observable that a higher percentage of sales (54,4%) is related to Europe. These facts are correlated and happen because there are many and excellent wine producers in Europe, namely in Portugal, Spain, France, Germany and Italy.
2.2.4. Global Performance
Fig. 12 - Consolidated sales by region
Source: Corticeira Amorim, Annual Report 2015
2014 2015 Variation Sales 560 340 604 800 7,9% Gross Margin 283 583 315 613 11,3% EBITDA 86 722 100 720 16,1% EBITDA/sales 15,5% 16,7% 1,2% Net Income 35 756 55 012 53,9%
Net Bank Debt 87 558 83 896 -4,2%
Corticeira Amorim performance summary 2015
Fig. 13 - Corticeira Amorim performance summary
The company’s assets, in 2015, increased to values around 667M€ due to operational items, namely euro-dollar exchange gains and increasing sales (items as inventory, customers and both tangible and intangible fixed assets increased). The debt decreased around 4M€ to 83,9M€, which was disappointing as the company was expecting a bigger debt shrinkage. Equity increased around 40M€, namely because of own share selling, which allowed a good income.
The company has also been performing well on the stock market. By analyzing figure 15, it is observable that the share price has been increasing in all presented statistics. At the year-end, a gain of 96,95% is verified compared to 2014. Furthermore, the trading frequency increased over the homologous period. It performed better than the PSI 20 Index during the year of 2015.
Fig. 14 - Net profit composition of Corticeira Amorim Source: Corticeira Amorim, Annual Report 2015
2.3. Industry Overview
2.3.1. International Market
It is undeniable that Portugal is the leader player in the cork industry, mainly due to Corticeira Amorim’s performance in all business units. Regarding the international market for cork, APCOR, the Portuguese National Association of Cork, states that the world cork production is around 201.000 tons and highlights Portugal as production leader with 49,6% or 100.000 tons. The country has natural resources that are favorable, being the cork oak area the largest in the world.
Because Corticeira Amorim SGPS, S.A. operates in five different business units, there are no similar companies competing in all business units simultaneously. Therefore, the main competitors had to be found considering each of the business units, individually. Because the cork stoppers unit represents a high percentage of the company’s revenues, the most threatening competitors belong to this area. In Portugal, Cork Link competes in both cork stoppers and floor and wall covering areas, whereas Cork Supply competes on the cork stopper business unit only.
Internationally, the substitute products are the biggest threat. Plastic made stoppers have been successfully developed, with high quality and low production costs. Essentra, Alsad or Sheng Zou are some companies that produce this substitute product.
2013 2014 2015 Nº of shares traded 2 184 858 3 481 685 12 693 424 Share Prices (€) Maximum 2,40 3,65 6,29 Average 2,04 2,85 4,34 Minimum 1,56 2,20 2,99 Year-End 2,21 3,02 5,948 Trading frequency 89,30% 96,10% 98,80%
Stock market capitalization at year-end (€) 293 930 000 401 660 000 791 084 000
Corticeira Amorim's stock market performance in recent years
Fig. 15 - Corticeira Amorim stock performance Source: Corticeira Amorim, Annual Report 2015
Fig. 16 - Work annual cork production Source: APCOR, yearbook 2015
Fig. 17 - Number of companies operating on the cork industry Source: APCOR, yearbook 2015
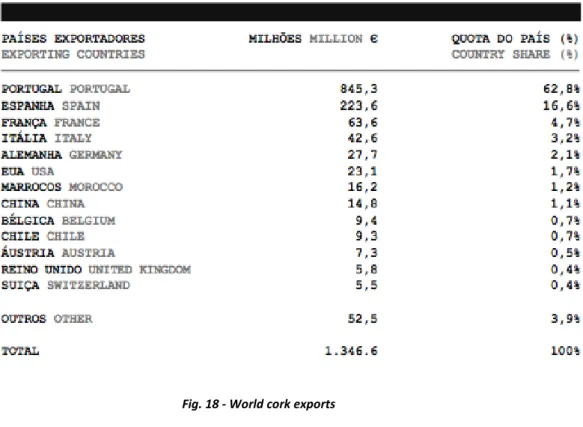
Fig. 18 - World cork exports Source: APCOR, yearbook 2015
Fig. 19 - World cork imports Source: APCOR, yearbook 2015
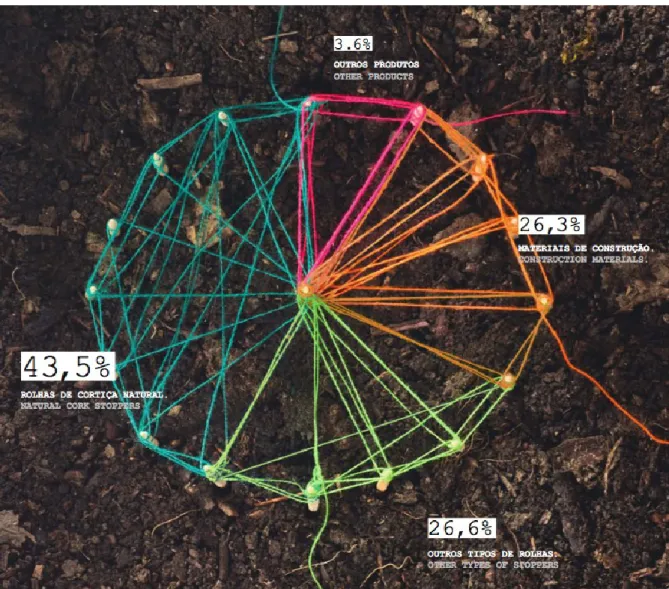
Figures 18 and 19 consider the Portuguese international position in the cork industry, being the country with higher exports and the forth with higher imports. Figure 20 shows that around 43,5% of global cork usage is related to stoppers.
2.3.2. Portuguese Cork Market
Regarding the Portuguese market for cork, figure 21 suggests that Portugal manages to keep high exportation levels, which has been increasing since the 2009 financial crisis, and figure 22 illustrates the international balance in the cork industry.
Fig. 20 - Sales structure per product Source: APCOR, yearbook 2015
Fig. 21 - Portuguese cork exports Source: APCOR, yearbook 2015
Fig. 22 - Portuguese international balance regarding the cork industry Source: APCOR, yearbook 2015
Fig. 23 - Cork export weights compared to total Portuguese exports APCOR, yearbook 2015
Fig. 24 - Portuguese cork exports per destiny Source: APCOR, yearbook 2015
Fig. 25 - Main products exported (million €) Source: APCOR, yearbook 2015
Fig. 26 - Main products exported (thousand tons) Source: APCOR, yearbook 2015
Fig. 27 - Evolution of cork stopper exports Source: APCOR, yearbook 2015
Fig. 28 - Cork stopper exports to the 6 main countries (million €) Source: APCOR, yearbook 2015
According to INE (Portuguese National Institute of Statistics) the cork-stoppers are the most exported product (in terms of value), with a high percentage of total sales. These exports are mostly related to wine producer countries, namely France, Italy, Germany and Spain, European countries. Regarding construction and decoration materials, they are the second most exported product, namely to Germany, the USA and Spain. France is considered to be the main market for Portuguese cork exports.
Regarding imports, Portugal imported 127,7M€ in 2014, around 71,3 tons, a decrease comparing to 2013.
Spain is the Portuguese main cork supplier. On the same hand as Portugal, Spain also has favorable natural conditions for cork production.
Fig. 29 - Exports of construction/decoration materials by main countries of destination Source: APCOR, yearbook 2015
Fig. 30 - Evolution of Portuguese cork imports Source: APCOR, yearbook 2015
Fig. 31 - Main countries of origin of Portuguese cork imports Source: APCOR, yearbook 2015
2.3.3. Wine Industry
Both wine and construction industries, between others, are related to cork industry. The wine market has been performing poorly since 2010 in Europe 28, with decreasing production level. According to OIV (International Organization of Vine and Wine), in the EU 28, Spain, France and Italy compete for market leadership. Outside EU 28, production level has increased, showing an opposite scenario, with the USA leading, followed by Argentina.
Fig. 32 -Total surfaces area of vineyards in EU 28 (thousand ha) Source: APCOR, yearbook 2015
Fig. 34 - World wine production (thousand hl) Source: APCOR, yearbook 2015
Fig. 35 - Wine production against wine consumption Source: APCOR, yearbook 2015
France is the country that most exports in value, but Spain is the one that most exports in quantity.
Fig. 36 - Main world wine exporters (million €) Source: APCOR, yearbook 2015
Fig. 37 - Main world wine exporters (million hl) Source: APCOR, yearbook 2015)
The wine consumption is expected to slightly increase worldwide over the years, following the recent trend, which is expected to have a positive impact in the cork industry.
Fig. 38 - Wine consumption evolution Source: APCOR, yearbook 2015
Fig. 39 - Main world wine importers (million €) Source: APCOR, yearbook 2015
2.3.4. Construction Industry
The construction industry, both Portuguese and worldwide, has been deeply affected by the 2008-2009 world crisis. Ever since, according to Eurostat, the number of licenses for construction has been decreasing.
Fig. 40 - Main world wine importers (million hl) Source: APCOR, yearbook 2015
Fig. 41 - Trends in the issuing of building permits in the EU28, in square meters
If the number of licenses for construction is decreasing, it will have a negative impact in the cork industry, as sales for this industry will shrink.
2.3.5. Legislation
The cork industry does not suffer from heavy legislation in Portugal. The only item important to mention is related to environmental legislation. The Portuguese government only allows to strip the trees once every nine years so that the specie and environment are preserved. Cork oaks cannot be cut, only if dead or sick and, even then, always requires authorities’ agreement. Considering the operational processes, residual waters must follow strict conditions.
3. Methodology
By taking a look at the company’s balance sheet, it is observable that its capitals structure is slightly constant in time, being the discounted cash-flow method the most suitable to evaluate the company. Furthermore, Corticeira Amorim SGPS, S.A. states that the financing mix is expected to remain stable in the future so that is can keep its operational and professional activity and satisfy both stakeholders and shareholders expectations. The discounted cash-flow results will be compared to two other methods, the dividend discount model and the relative valuation in order to test the trustworthiness of the valuation results.
3.1. Discounted Cash-Flow
3.1.1. Forecast Assumptions
Because the company does not provide the financial reports for each business unit, the valuation had to be done considering the whole company, despite the fact that it should be more accurate to evaluate each business unit separately and compute the company’s value as the sum of the parts. To do so, the initial step was to get all the financial data from the annual reports of Corticeira Amorim SGPS, S.A., namely income statement, balance sheet and cash-flow map. The historical data included the period between 2010 and 2015. Data before 2010 was not considered as it is believed to be too old to reflect the actual market and reality, which could