The Impact of Data Security on Firm
Value: How do Stock Markets react to
Data Breach Announcements?
Juliane Landmann
Dissertation written under the supervision of Jörg Stahl
Dissertation submitted in partial fulfilment of requirements for the MSc in
Finance, at the Universidade Católica Portuguesa, 1/7/2019.
Abstract
i
The Impact of Data Security on Firm Value: How do Stock Markets react
to Data Breach Announcements?
Juliane Landmann Abstract
Far too often, data security concerns are not taken as seriously as they should be. This negligent behavior does not seldom result in data breaches with far reaching economic consequences. This paper demonstrates that there is an observable decline in firm value following a data breach announcement, applying an event study methodology to a sample of 366 firms being subject to data breaches between January 2013 to July 2018. Using a one-factor and a three-one-factor model to estimate abnormal returns, firms experiencing a data breach lost on average about 1.33 percent of equity over a three-day window around the event. For different industries, deviations in the magnitude of negative market reactions are detected. Various company and incident related variables, such as company size and number of customer records exposed are deployed in regression analyses to account for cross-sectional variations in abnormal returns. Profitability has a positive influence on the abnormal returns obtained. Multiple breaches have a negative impact on the abnormal equity returns, however, there is no significant difference in the severity when compared to single breaches. Other factors, namely company size, leverage, magnitude of the breach and type of breach do not have any statistically significant influence on the market reactions observed.
Key words: Data breach, data security, information technology security, event study Resumo
Frequentemente, as preocupações em torno da segurança dos dados não são levadas tão a sério quanto deveriam. Este comportamento negligente resulta, não raramente, em violações de dados com consequências económicas profundas. Este artigo demonstra um declínio observável no valor das empresas após o anúncio de uma violação de dados, aplicando uma metodologia de estudo de eventos a uma amostra de 366 empresas sujeitas a violações de dados entre janeiro de 2013 e julho de 2018. Utilizando um modelo de um fator e de três fatores para estimar retornos anormais, as empresas que sofreram violações de dados perderam, em média, aproximadamente 1,33 por centro do património líquido num período de três dias a contar do evento. Para diferentes indústrias, são detetados desvios na magnitude das reações negativas ao mercado. Várias variáveis relacionadas com a empresa e com incidentes, tais como o tamanho da empresa e o número de registos de clientes expostos são incorporadas em análises de regressão para contabilizar as variações transversais nos retornos anormais. A rentabilidade tem uma influência positiva nos retornos anormais obtidos. Múltiplas violações têm um impacto negativo nos retornos anormais do património líquido, no entanto, não há diferenças significativas na gravidade quando comparadas com violações individuais. Outros fatores, nomeadamente o tamanho da empresa, alavancagem, a magnitude e o tipo de violação não possuem qualquer influência estatisticamente significativa nas reações de mercado observadas.
Palavras-chave: Violação de dados, segurança de dados, segurança de tecnologia da informação, estudo de eventos
ii Contents
Abstract ... i
List of tables ... iii
List of figures ... iii
1 Introduction ... 1
2 Institutional setting, data and methodology ... 6
2.1 Data breaches and confidential customer data ... 6
2.2 Data and variable construction ... 7
2.2.1 Variables on company characteristics ... 10
2.2.2 Data breach related variables ... 12
2.3 Methodology ... 13
3 Hypothesis development ... 18
4 Empirical results and discussion of findings... 23
5 Limitations ... 34
6 Concluding comments and managerial implications ... 36
7 Bibliography ... 37
List of abbreviations ... 40
List of tables
iii List of tables
Table 1: Event distribution of data breaches from 2013 to July 2018... 9
Table 2: Industry distribution of data breaches from 2013 to July 2018... 10
Table 3: Descriptive statistics on company variables size, profitability and leverage ... 11
Table 4: Frequency of breach types from 2013 to July 2018 ... 12
Table 5: Clustering of number of customer records exposed from 2013 to July 2018 ... 13
Table 6: Cumulative abnormal returns and test statistic results for three-day event window . 23 Table 7: Regression results for company specific variables size, profitability and leverage .. 27
Table 8: Regression results for company size and impact ... 28
Table 9: Regression results for dummy variable subsidiary ... 29
Table 10: Significance tests of CARs for sub-sample on firms with affected subsidiaries .... 29
Table 11: Results of single-factor ANOVA for different breach types... 30
Table 12: Regression results for multiple data breaches ... 31
Table 13: Significance tests of CARs for sub-sample on firms with multiple breaches ... 32
List of figures Figure 1: Development of cumulative abnormal returns until 10 days after event ... 25
Introduction
1 1 Introduction
Recent years saw several major data breaches of confidential customer data involving US firms. These breaches did not only experience extensive media coverage but often led to severe financial consequences for the firms involved as a result of customer dissatisfaction and customer’s loss of trust, substantial IT investments and customer reimbursement as well as considerable legal expenses and penalty fees imposed by the Federal Trade Commission (FTC)1. The most recent data breaches involve the huge technology companies Facebook and
Google. Facebook has already been troubled with two of such instances this year. The first incident concerned the revelation of unauthorized access to 30 million Facebook member profiles by the third-party vendor Cambridge Analytica. With the user information the vendor built psychographic profiles of potential voters throughout the 2016 Presidential election campaign in the US (Rosenberg, Confessore and Cadwalladr, 2018). Additionally, in September 2018, Facebook had to inform law enforcement officials that anonymous hackers were able to access at least 50 million user accounts as well as applications connected to the respective Facebook profiles, such as Instagram and Spotify (Isaac and Frenkel, 2018). Google experienced a scenario similar to the Cambridge Analytica malpractice, when an Application-Programming-Interface (API) bug in its social network Google+ allowed third-party app developers to access not only public but also private user data such as occupation, gender and age (O’Flaherty, 2018). The lack of privacy protection affected 500,000 members and ultimately led to Google’s decision to shut down the network. This decision was made to avoid any future data misusage and potential fines of four percent annual global turnover under the new European General Data Protection Regulation (GDPR) which Google would have to oblige to due to its activities within Europe (O’Flaherty, 2018).
The events described, however, are not limited to technology companies but can affect any industry, for instance retail companies, manufacturers or financial institutions. One of the most impactful data breaches in the financial industry occurred at Equifax in 2017, a credit reporting agency. The breach affected 143 million customers, exposing credit card accounts, social security numbers and drivers’ licenses (Zaidi, 2018). The customer data was subsequently used for “fraudulent charges on credit cards and unauthorized mortgage loans on
1 Confidential customer data according to national US legislation (Consumer Privacy Protection Act) from 2017
include customer information that ultimately make the identification of an individual person possible. Under this legislation, examples of confidential customer data include, but are not limited to, a persons’ full name, social security number, financial account information and, since recently, biometric data. Henceforth, the term data breach will be used to describe events in which companies exposed (intentionally or unintentionally) confidential customer data which were not permissioned for disclosure by customers.
Introduction
2
associated accounts” (Zaidi, 2018), resulting in breach-related costs of 439 million USD of which only 125 million USD were covered by insurance (McCrank and Finkle, 2018). As a result of the public announcement regarding the detection of the data breach, Equifax’ market capitalization decreased by about 25 percent over the course of several days (McCrank and Finkle, 2018).
Even though considerable data breaches occurred in recent years, this is not a new phenomenon but rather a problem companies and their customers have been experiencing since the rise of the internet in the 2000’s. The most comprehensive data breach of confidential customer data to date occurred at Yahoo in 2013, in which data of all its three billion customers, including names, account passwords and phone numbers, were accessed by malicious outsiders (Perlroth, 2017). However, the full impact of the incident was only made public when the company was acquired by Verizon in 2017. As a result of the revelation, Verizon lowered its offer price by 350 million USD to 4.48 billion USD (Perlroth, 2017). Even though this is a rather extreme example due to the size of the incident as well as the size of the companies involved in the transaction in terms of market capitalization, it still implicates that data breaches of confidential customer data can have a significant economic impact on firm value.
Besides the prominent examples presented above and an increasing number of data breaches in the US each year – reaching the highest number in 2017 with a total of 1,579 reported breaches and 179 million records exposed (Identity Theft Resource Center, 2017) – the extent to which data breaches of confidential customer data impact firm value is still being discussed in literature.
The first extensive review of the impact of publicly announced information security breaches on firm value by Campbell et al. (2003) showed a rather mixed outcome, as there was “limited evidence of an overall negative stock market reaction […] [to] security breaches.” (p. 1). However, when limiting their analyses to breaches in which only confidential customer data were affected, the results were significant negative market reactions, showing that the market reacts more severe to data breaches when confidential data is involved. This negative reaction might be evoked as the market anticipates that the exposure and potential misuse of this data leads to the loss of customers as a result of decreasing trust and dissatisfaction. This ultimately results in the loss of revenue and market share, directly affecting firm value. Following up on these findings, Garg, Curtis and Halper (2003) and Hovav and D’Arcy (2003) showed similar negative impacts on firm value as the result of a data breach and
Introduction
3
started quantifying the costs associated with such breaches. Over the past years, more and more studies have focused on the impact of different kinds of data breaches. Cavusoglu, Mishra and Raghunathan (2004) studied the impact of internet security breaches on firm value, Ettredge and Richardson (2003) investigated the stock market reactions following a denial-of-service (DOS) attack on firms that mainly operate on the internet while Chen et al. (2010) looked at the financial impact of phishing attacks on both company and customer side. All of these studies suggest that there is either a negative impact on firm value or severe financial costs associated with the data breach as a result of extended customer support and compensation and further expenses for IT security, or a combination of both. Ishiguro et al. (2006) report these negative results on firm value following a data breach incident for Japanese firms listed on the Tokyo Stock Exchange. They present evidence that negative stock market reactions are common reactions to data breach incidents, regardless of the country the affected companies operate in.
All of these previously presented studies date back to the commercial beginnings of the internet and digitalization, when customer perception of data security was quite low. Also, a substantial number of data breach incidents were either not reported or remained undiscovered, with the outcome that only a limited number of firms could be analyzed as part of the studies mentioned above. More recent studies in this field are quite scarce. Hinz et al. (2015) examined the effects of data theft on the share prices of consumer electronics companies while Arcuri, Brogi and Gandolfi (2017) undertook a similar analysis for companies operating in the financial sector. Both studies confirmed the findings of previous studies, as they show that the companies in scope experience significant decreases in share prices following a data breach.
The aim of this study is to add to the more recent literature since the topic covered is still gaining importance. As stated before, the number of data breach incidents is continuously increasing, however, since the majority of studies is outdated, it is unclear whether the effects that were discovered in the past are still similar for companies today. The paper is analyzing the changes in firm value following data breach announcements by applying an event study methodology. The study at hand provides a far more comprehensive dataset of a total of 366 firms with 615 events that occurred between January 2013 to July 2018. Earlier research commonly examined datasets with a total of up to 60 events. Due to the further expansion of the internet after the 2000s and an increased significance of the technological sector, governments became far more concerned with data security. The US reacted by imposing
Introduction
4
more and more national laws that require companies to report data breach incidents. In 2017, each one of the 50 states had its own data breach notification law. This significant change in legislation led to the outcome that data breaches are, in comparison, far better reported compared to previous studies. This allows for more comprehensive analyses, adding further findings to the existing literature. One of these new areas of research is to examine whether there are any differences in effects following a data breach announcement among different industries. In addition to examining these industry specific differences on firm value, the paper tries to shed light on the possible impacts that company specific characteristics such as firm size or incident specific characteristics such as the severity of the breach in terms of records exposed might have on firm value following a data breach incident. Furthermore, it is explored if companies that are exposed to data breaches more than once between January 2013 to July 2018 are penalized more severely by the market and whether there is a measurable impact on firm value if subsidiaries of publicly listed firms experience a data breach.
The research topic of this paper is also interesting in the aftermath of the Facebook scandal concerning Cambridge Analytica, in which the third-party contractor collected customer data from Facebook users and used the data for its own purposes. Neither did customers agree to the data collection nor did they know that their data was being used by Cambridge Analytica. The scandal created a worldwide public outcry for improved data security and once again made data security a main topic for companies and customers. Since the data breach by Cambridge Analytica was revealed in March 2018, the study already incorporates first market reactions to data breaches following this decisive event. It will be interesting to see whether there are already any recognizable changes in the market reaction following a data breach, in terms of a higher decline in firm value following a data breach incident compared to incidents that occurred before March 2018, regardless of the company concerned.
The remaining part of this study is structured as follows: First, the paper is providing an overview about the institutional setting, in terms of a definition of the kind of data breaches that are in focus throughout this study as well as the kind of confidential customer data; second, there will be an introduction to the data used, the sampling procedure and the event study methodology that is commonly applied in studies assessing the impact on firm value following a data breach (see for example Acquisti, Friedman and Telang (2006); Kannan, Rees and Sridhar (2007); Gatzlaff and McCullough (2013)) (2); third, the study presents the main hypothesis and subordinated company specific and incident specific hypotheses that are
Introduction
5
examined throughout the following parts (3) and provides answers to these hypotheses under empirical results (4).
Institutional setting, data and methodology
6 2 Institutional setting, data and methodology
This section will explain the current institutional setting regarding data breaches in the US, clarifying the current legislation regarding data breaches as well as a definition of what can be considered confidential customer data. Subsequently, the data used and the variables that are constructed to further examine the impact of a data breach with regards to company and incident specifics will be introduced and the empirical method that is applied is described in detail.
2.1 Data breaches and confidential customer data
As mentioned earlier, within the US, each of the 50 states has its own national data breach notification law. In general, these laws require companies to notify customers that are affected by a data breach immediately, usually in writing, as well as regional governing bodies, for instance the attorney general or state agencies such as the FTC. According to the Privacy Rights Clearing House, a non-profit organization engaging in the protection of customer data in the US, a data breach can be defined as “when a company inadvertently leaks your personal information as a result of a hack attack, lost or stolen computers, fraud, insider theft, and more” (Privacy Rights Clearing House, 2011).
Even though data breaches are covered under national law, to date there exists no federal law in the US that is governing data breach notification. For this reason, the settings under which customers need to be notified differ widely among states. There is no general agreement upon which types of data should trigger a notification once they are leaked. Usually data breach notification laws are triggered if an individual’s full name as well as an additional distinguishing feature, such as a person’s social security number or account password are accessed under any of the following scenarios: (1) internal abuse through the intentional theft by employees or the unintentional exposure through employee error or improper disposal or (2) external access through malicious outsiders via hacking and phishing or third-party abuse. Under some of the national laws, howbeit, companies are only obliged to inform customers and authorities about data breaches when passwords or financial information have been accessed.
In order to make data breaches that have occurred in different states comparable, this study uses data on data breaches that has been collected by the Identity Theft Resource Center (ITRC). This organization collects data breach incidents of the following nature:
Data and variable construction
7
“an individual name plus a Social Security number, driver’s license number, medical record or financial record (credit/ debit cards included) is potentially put at risk because of exposure. […] The ITRC will also capture breaches that do not, by the nature of the incident, trigger data breach notification laws. Generally, these breaches consist of the exposure of user names, emails and passwords.” (Identity Theft Resource Center, 2017, p. 19).
The universal definition of the ITRC, in connection with the fact that breaches that would not trigger data breach notification laws are reported by the ITRC as well, provides a good basis for the following analyses. How important a general definition and hence a federal law is, is reflected by the different treatment of financial institutions, insurance and health care companies when it comes to data breaches. The beforementioned company types are governed under federal laws. For the first two company types the Gramm Leach Bliley Act (GLBA) applies. This statute requires financial institutions to protect any customer information that is collected in connection to the services offered by the corporations. The act also requires them to disclose any exposure of customer data to both affected customers and authorities promptly after its occurrence. The latter of the listed company types, health care companies, are, in addition to national data breach notification laws, governed under the federal Health Information Portability and Accountability Act (HIPAA). In addition to special requirements regarding the protection of data that is collected by any entity that deals with either an individual’s health status, payment for health care services or the provision of health care services, these companies are required to inform customers of any data exposure immediately after the exposure occurs.
This difference in treatment makes is hard to compare different data breaches with each other. Naturally, it would appear reasonable that financial institutions and health care companies are far more often subject to data breaches. However, this perception mainly stems from the fact that companies within other sectors might not be required to report data breaches, depending on the state in which the data breach occurred. As already mentioned, by using the dataset of the ITRC, the differences in publicly released information that stems from different reporting standards can mostly be avoided.
2.2 Data and variable construction
As mentioned in the previous section, the data used for this study is retrieved from the annual data breach reports that are published by the ITRC from the year 2013 to the year 2017 and additionally from monthly publications until July 2018 to include as recent data as possible. The aforementioned period is chosen due to several reasons. When incorporating data from 2018 and only including data for a period of five years, it is ensured that the results obtained
Data and variable construction
8
are updated due to the use of recent data. If a longer time range is used, there would be a possibility that the results do not reflect the most recent developments and are therefore not conclusive for firms that suffer from a data breach in the near future. In addition, and as already mentioned earlier, the chosen timeframe allows for an inclusion of data breach incidents that occurred after the Facebook scandal in March 2018. Also, the frequency of data breach incidents increased from 2013 to 2018. This is observable in the event distribution which is displayed in table 1 below. In the year 2013, the number of incidents that are included in this study is, with only 28 events, rather insignificant in terms of contributions to the results. It is expected that the yearly number of events prior to 2013 will be even lower than the number reported in 2013. Therefore, it was decided to only include data from 2013 onwards.
Data breach incidents are reported by the ITRC if companies triggered data breach notification laws in their respective state and, as consequence, were listed on the pertinent notification lists of state governmental agencies. Data breaches are also listed by the ITRC if various media sources confirm a data breach, even if the type of data that is exposed through the breach does not trigger any data breach notification laws (see previous section for a definition of these incidents and the kind of data considered). The ITRC considers five different types of loss methods for their reports: (1) Insider theft, (2) Hacking/ phishing, (3) Subcontractor/ third party abuse, (4) Employee error/ improper disposal/ lost and (5) Accidental web exposure.
The data reported include the names of the affected companies, the dates of the data breach incidents, the breach types as well as the number of records exposed. However, the latter information is only reported for incidents that are reported to state governmental agencies. Around 30 percent of each data breach report lacks information about the number of records exposed. In cases were several firms were involved in one incident, each firm was treated as an individual company. From January 2013 to July 2018, a total of 4,847 firms were affected by data breaches as per definition of the ITRC, with a total of 1,115,562,716 records exposed. Out of these companies, only those that were publicly listed in the US or those which were a subsidiary of a publicly listed company on the NYSE, AMEX or NASDAQ between January 2013 and July 2018, were considered for the event study. In total, 522 companies remained. Companies that were not listed 180 days prior to the data breach incident were excluded from the sample, as this time period defines the estimation window of the event study. In addition, companies were excluded if confounding events, such as merger and acquisition or earning
Data and variable construction
9
announcements, were made public within ten days prior to the event date, as this could potentially influence the estimated returns because it would be highly likely that these stock returns would be distorted. Companies were also excluded if they had any type of analyst call ten days prior to the event date. The remaining sample was winsorized at the 1st and the 99th
percentile. The final data set that is used for the analysis consists of a total of 366 companies with 615 events. 104 companies of the 366 companies experienced more than one data breach incident within the time range of January 2013 to July 2018, with a maximum of 13 data breaches for one company. For the event study approach, only one event per firm is considered and in the case of multiple events in the considered time period, only the most recent data breach is included in the final sample. For example, if a company experienced a data breach in 2014 and a second one in 2018, only the effect of the data breach in 2018 will be considered for the event study. This separation is undertaken as the effects of multiple data breaches on firm value will be investigated in a separate regression analysis and sub-sample. Furthermore, the decision to only consider the most recent data breach incident rather than the first data breach occurring over the time frame in scope is based on the expectation that the more recent data breaches provide a higher explanatory power for market reactions. This is hypothesized due to, not only, but predominantly, the scandal that arose out of the data breach at Facebook, concerning the third-party abuse by Cambridge Analytica. The public outcry and above-average media coverage concerning this particular data breach leads me to believe that the reaction to data breaches ex-post to the Facebook data breach release are far more significant as both, investors and customers, have become much more concerned with customer data safety. These concerns regarding data safety were additionally strengthened by an increasing number of breach incidents until 2018. The following table shows the frequency of data breaches from January 2013 to July 2018, excluding multiple breach incidents.
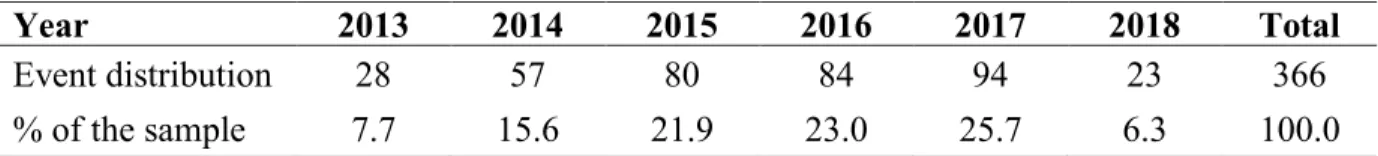
Table 1: Event distribution of data breaches from 2013 to July 2018
Year 2013 2014 2015 2016 2017 2018 Total
Event distribution 28 57 80 84 94 23 366
% of the sample 7.7 15.6 21.9 23.0 25.7 6.3 100.0
The table above shows that the sample reflects the general development of increasing data breaches over time, with 2017 being the year with the highest number of data breaches yet. As 2018 merely displays data until July, it is reasonable that the cumulative number is lower than in 2017.
Variables on company characteristics
10
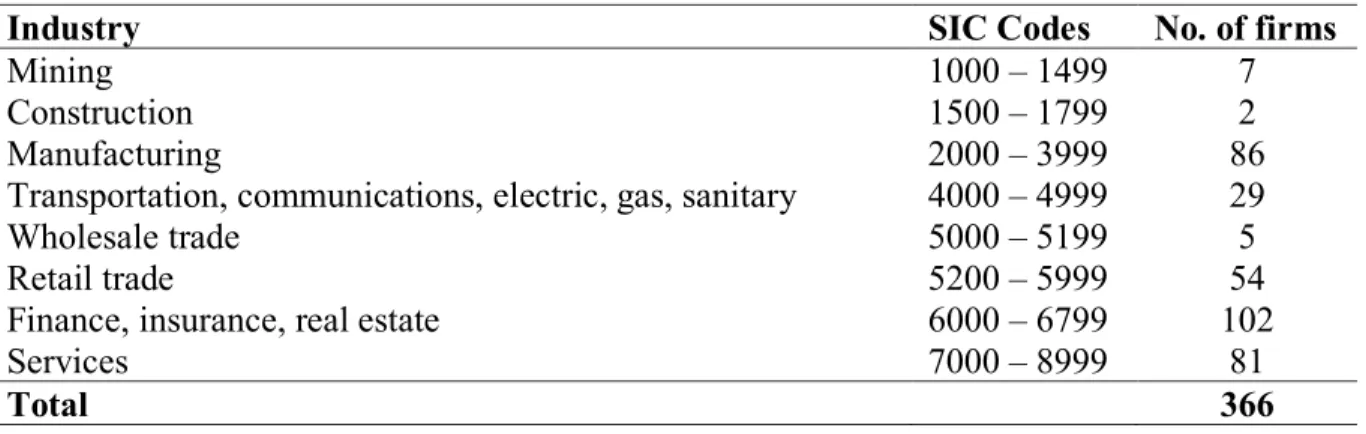
As mentioned before, the 366 companies in scope of the analysis are operating in eight different industries. The segmentation is undertaken on the basis of the corresponding Standard Industrial Classification (SIC) codes. The distribution of firms per industry is shown in the table below.
Table 2: Industry distribution of data breaches from 2013 to July 2018
Industry SIC Codes No. of firms
Mining 1000 – 1499 7
Construction 1500 – 1799 2
Manufacturing 2000 – 3999 86
Transportation, communications, electric, gas, sanitary 4000 – 4999 29
Wholesale trade 5000 – 5199 5
Retail trade 5200 – 5999 54
Finance, insurance, real estate 6000 – 6799 102
Services 7000 – 8999 81
Total 366
In table 2 above it can be seen that firms within the financial service industry are experiencing the highest number of data breaches within the analyzed time frame. This can be partly explained by the high online presence these companies have (Arcuri, Brogi and Gandolfi, 2017) through online banking and similar applications. Also, when illegally accessing confidential customer data from these types of companies, outsiders or even internal employees often have the opportunity to directly extract financial value by using customer accounts or credit card information, similar to the Equifax breach. Furthermore, the fact that these companies are additionally governed under the GLBA might lead to more frequent reporting of data breaches since these companies are under any circumstances obliged to inform customers about any data breach that occurred. Financial service companies are followed by manufacturing and service companies. This might be the case as these types of company classifications include a high number of technology companies, for instance Microsoft or Adobe Systems, starting with the SIC 73XX, which are more often subject to data breaches due to their technological exposure. Besides retail trade, other industries experience a rather low number of data breach incidents from January 2013 to July 2018. Hence, the effects in these industries are not assumed to be highly negative.
2.2.1 Variables on company characteristics
Variables on company characteristics are such variables that could potentially have an influence on the magnitude of the increase or decrease in firm value as a result of a data breach. For this paper, the company characteristics that will be analyzed are size, profitability
Variables on company characteristics
11
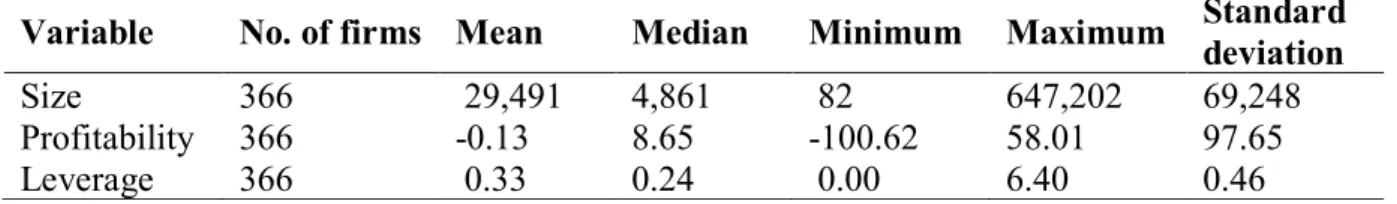
and leverage. It is expected that size will have similar effects on the market reaction as in the paper of Malhotra and Malhotra (2011). In their paper, they show that the market tends to penalize larger firms more severely than smaller ones following a data breach announcement. In contrast, profitability is expected to have a positive influence on the abnormal returns (AR) realized. This is hypothesized, because companies that are more profitable are likely to have more monetary resources available to react to a data breach and its internal as well as external consequences, such as customer compensation and reputational damage. Similar to size, leverage is also assumed to have a negative impact on the market reaction, meaning that the higher the leverage ratio of a company, the more negative the ARs following a breach announcement. This outcome is expected as data breaches are usually an unplanned cost factor. For data breaches it is especially hard to estimate the total cost beforehand, since the expenses are dependent on the magnitude of the breach, such as the total number of systems infiltrated as well as the number of customers affected. A company that has more leverage might have troubles to service their debt holders following a data breach as a large portion of cash on hand might have to be used to deal with the consequences of the data breach, such as the compensation of customers or investments into IT security. Thus, the market is believed to react negatively to a data breach announcement in relation to the company’s leverage ratio. The variable size is the market capitalization of the firm. Market capitalization is calculated by multiplying the adjusted closing price with the number of shares outstanding. The proxy that is used for profitability is Return on Assets (ROA). ROA is the relation of net earnings to total assets. Leverage is represented by the leverage ratio, which is calculated as total debt (short-term plus long-term debt) divided by the total assets of a company. In order to gain a better understanding about which companies in terms of the variables presented above are represented within the data set used, the following table shows descriptive statistics for the different variables.
Table 3: Descriptive statistics on company variables size, profitability and leverage
The table provides summary statistics on the company specific variables size, profitability and leverage. The market capitalization reported is the market capitalization twenty days prior to the data breach incident. Profitability and the leverage ratio are as of the year in which the data breach incident occurred. The results for size are reported in million USD. The results for profitability are reported in percent. The results for leverage are reported as ratio.
Variable No. of firms Mean Median Minimum Maximum Standard deviation
Size 366 29,491 4,861 82 647,202 69,248
Profitability 366 -0.13 8.65 -100.62 58.01 97.65
Data breach related variables
12
The size of the companies within the sample varies widely. However, on average, the companies within the sample are medium sized in terms of market capitalization. With regards to profitability, it is striking that the firms are exhibiting a predominantly negative profitability. This could be due to two reasons. Firstly, profitability in terms of ROA is calculated for the year in which the data breach has occurred. It could be the case that profitability is negatively affected by the data breach incident. Secondly, as already explained for table 2 regarding the industry classification, a significant number of firms is operating within the manufacturing and service sector. These are predominantly firms offering technological products and services. It could be that a majority of these companies are still in a starting phase, hence exhibiting negative profitability. The results obtained for the leverage ratio do not show any unusual outcomes. On average, the leverage ratio is quite low. However, the maximum shows an extraordinarily high leverage ratio.
2.2.2 Data breach related variables
Similar to the company related variables, there are characteristics concerning the data breach itself which can influence the ultimate market reaction. Characteristics that can be considered in this regard are the type of breach and the total number of customer records exposed.
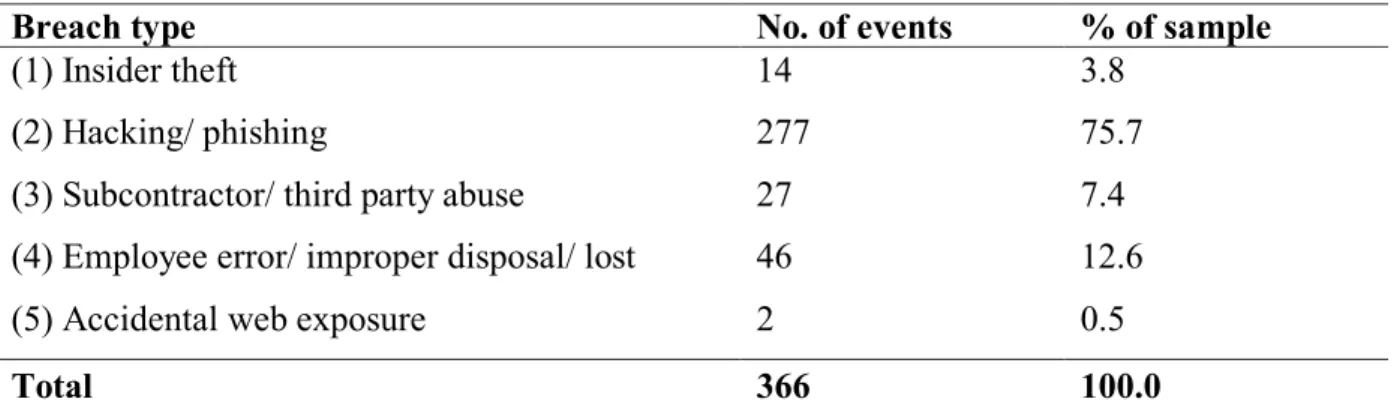
Breach type consists of a total of five different dummy variables that all represent one breach type. These breach types were chosen according to the reported breach types in the annual identity theft reports published by the ITRC. As already presented under section 2.2, these breach types are (1) Insider theft, (2) Hacking/ phishing, (3) Subcontractor/ third party abuse, (4) Employee error/ improper disposal/ lost and (5) Accidental web exposure. Each of these variables can take either a value of zero or one, which indicates whether (1) or whether not (0) the breach that occurred is any of the beforementioned breach types. The table below shows the different breach types and their respective frequency.
Table 4: Frequency of breach types from 2013 to July 2018
Breach type No. of events % of sample
(1) Insider theft 14 3.8
(2) Hacking/ phishing 277 75.7
(3) Subcontractor/ third party abuse 27 7.4
(4) Employee error/ improper disposal/ lost 46 12.6
(5) Accidental web exposure 2 0.5
Methodology
13
Table 4 shows that the majority of data breaches occurs as a result of hacking and/or phishing attacks. Only a limited number of incidents occurs due to internal company failures such as insider theft or improper disposal of customer data.
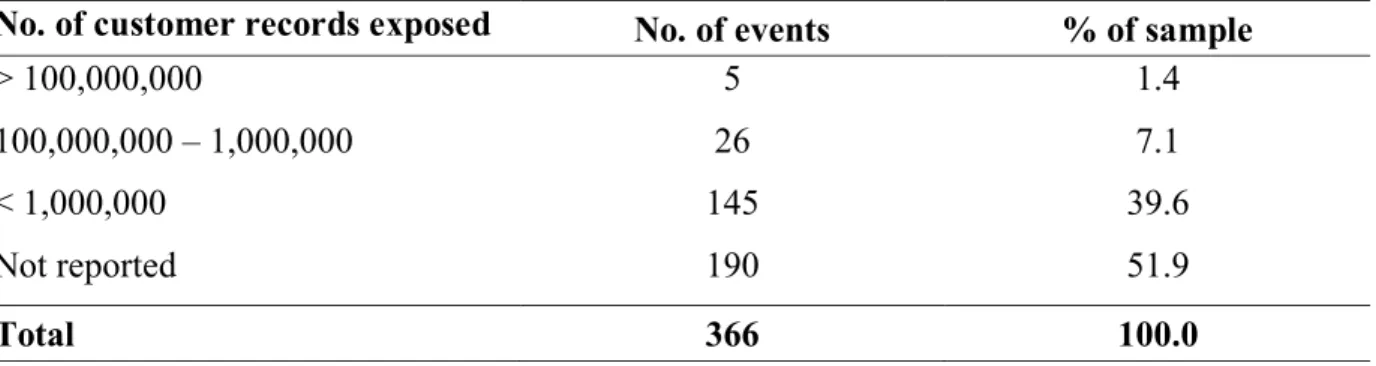
The constructed variable for number of customer records exposed will subsequently be called impact and takes into consideration the number of customers whose data was exposed throughout the data breach. This means, if there is more than one data point of a single customer exposed, for example telephone number, password and full address, this exposure will be considered as one single exposure as only the aggregated number of customers affected counts, not the individual number of data points exposed. Unfortunately, the number of records exposed is not reported for every data breach within the sample. Either this is because the company that reported the incident is not aware of the magnitude of data affected or because the data breach did not trigger a data breach notification law. In this case, companies are not obliged to report the number of customer records that were exposed. The following table shows different size clusters for the number of customer records exposed. Table 5: Clustering of number of customer records exposed from 2013 to July 2018 No. of customer records exposed No. of events % of sample
> 100,000,000 5 1.4 100,000,000 – 1,000,000 26 7.1 < 1,000,000 145 39.6 Not reported 190 51.9 Total 366 100.0
As it can be seen in table 5 above, in case the number of records is reported, there is only a very limited number of incidents in which a considerable number of customer records of more than 1,000,000 is exposed. Roughly 40 percent experience more moderate data breaches, in which less than 1,000,000 of customer records are exposed. However, for more than 50 percent of the data breaches within the sample, the number of records that are exposed is not reported.
2.3 Methodology
This study uses an event study approach to determine the impact of data breaches on firm value. Event studies are used extensively to assess the impact of a predefined event on a firm’s stock performance and hence its market value (see for instance Fama et al., 1969;
Methodology
14
Asquith and Mullins, 1983; McQueen and Roley, 1993; Cooper, Dimitrov and Rau, 2001; O’Donovan, Wagner and Zeume, 2017). Previous studies attempting to analyze the effect of data breaches on firm value also made use of event study approaches (Dos Santos, Peffers and Mauer, 1993; Gordon, Loeb and Zhou, 2011). The underlying assumption of this methodology is that the effects of a specific event will be reflected immediately in a firm’s stock price (MacKinlay, 1997). Thus, observing the stock price of a firm following a specific event for a short period of time will allow to draw conclusions on the impact the event has had on the firm value. This is based on the assumption of an efficient market (Fama, 1970) which will consider all information available on the market to price a security. Hence, the market will take into consideration implicit and explicit costs following a data breach event. Following the event study approach, first the ARs are calculated. This is done by identifying the difference between the actual return at time t, i.e. the day of the event and the days following the data breach and the predicted stock return that would have been expected if the data breach had not occurred. The predicted stock return is estimated in two ways. First, through a one-factor market model (consistent with the capital asset pricing model (CAPM) as proposed by Sharpe (1964) and Lintner (1965)), which is specified as:
𝑅𝑖,𝑡 = 𝑎𝑖+ ß𝑖𝑚𝑅𝑚,𝑡+ 𝜀𝑖,𝑡 (1)
where Ri,t is the risk-adjusted return of a firm i’s stock experiencing a data breach on the date
t, Rm,t the risk-adjusted market return on day t, αi the idiosyncratic risk component and ßim the
slope parameter respectively for firm i and εi,t the error term. The coefficients are estimated by
using an ordinary least square (OLS) regression. The proxy used for Rm,t are the
equally-weighted market index returns of the NYSE, NASDAQ and AMEX. This index is chosen as companies within the sample are listed on either of these exchanges and thus represents the firms within the sample.
The second model used is the three-factor model developed by Fama and French (1992), which uses the factors market, size and value. The model is specified as follows:
𝑅𝑖,𝑡 = 𝑎𝑖+ ß𝑖𝑚𝑅𝑚,𝑡+ ß𝑖𝑠𝑆𝑀𝐵𝑡+ß𝑖𝑣𝐻𝑀𝐿𝑡+ 𝜀𝑖,𝑡 (2)
where SMB is small minus big, i.e. the difference in returns on diversified portfolios of small and big shares in terms of market capitalization and HML is high minus low, i.e. the difference in returns on diversified portfolios of high and low shares in terms of book-to-market ratios. Both models presented under (1) and (2) use an estimation window of 180 trading days, ending 20 days prior to the data breach event.
Methodology
15
After having obtained the predicted returns, the ARs can be computed. For the one-factor model presented under (1), the computation of the ARs is as follows:
𝐴𝑅𝑖,𝑡 = 𝑅𝑖,𝑡− (𝑎̂𝑖+ ß̂𝑖𝑚𝑅𝑚,𝑡) (3)
For the three-factor model, the computation of the ARs is as follows:
𝐴𝑅𝑖,𝑡 = 𝑅𝑖,𝑡− (𝑎̂𝑖+ ß̂𝑖𝑚𝑅𝑚,𝑡+ ß̂𝑖𝑠𝑆𝑀𝐵𝑡+ ß̂𝑖𝑣𝐻𝑀𝐿𝑡) (4) The ARs reflect the deviation between the actual realized returns in the event period and the predicted returns based on the models presented above.
The event window that will be considered crucial for the following analysis is a three-day event window, from t-1 to t+1, in which t denotes the date of the data breach announcement. In the case that t is not a trading day, the event date t is moved to the closest following trading day. This window is chosen as the underlying assumption of the event study methodology assumes that the effects of the event materialize in a rather short-term window surrounding the event. Additionally, this short event window reduces the possibility that other confounding factors might influence the stock price and hence the results obtained. By including the day prior to the event date, it is ensured that any market reactions that arise due to information leakage are captured in the results as well. The cumulated abnormal returns (CAR) over the chosen event window are calculated as follows:
𝐶𝐴𝑅𝑖 = ∑𝑡2𝑡=𝑡1𝐴𝑅𝑖,𝑡 (5)
where t1 and t2 are the defined event interval and ARi,t is defined as under (3) and (4). In the
following analysis, not only the event window t1= t-1 and t2= t+1 are considered, but a range of different window lengths in order to assess the time frame over which the market fully incorporates the entire impact of the data breach.
As there are 366 events within the sample, the individual CARs for each event i will be aggregated to show the mean effect of a data breach event. This will be done as follows: 𝐶𝐴𝑅𝑖 =
1
𝑁∑ 𝐴𝑅𝑖,𝑡 𝑡2
𝑡=𝑡1 (6)
with N being the number of events. For the full sample, N is equal to 366. For the different industries, N can vary according to the number of firms and hence events within each industry classification.
Methodology
16
The statistical significance of the results obtained is tested through a parametrical as well as a non-parametrical test.
For the parametrical test, the standardized cross-sectional test as proposed by Boehmer, Masumeci and Poulsen (1991) (also called BMP-test) was used. This approach accounts for the variance that is induced by the event itself by standardizing the ARs by the standard deviation of the returns that are measured within the estimation window. Commonly used cross-sectional tests that do not account for the event-induced variance usually tend to reject the null hypothesis of ARs being indifferent from zero even though the hypothesis is actually true.
The null hypothesis that CAR is equal to zero is tested through the equation shown under (7): 𝑍𝑆𝐶𝑆 =
∑𝑁𝑖=1𝑆𝐶𝐴𝑅𝑡
√𝑁𝛿𝑆𝐶𝐴𝑅𝑡 (7)
with the standardized abnormal return SCARt being equal to
𝑆𝐶𝐴𝑅𝑡 = 𝐶𝐴𝑅𝑡
𝛿𝐶𝐴𝑅𝑡 (8)
and the variance of the standardized abnormal return being equal to 𝛿𝑆𝐶𝐴𝑅2 𝑡 = 1 𝑁−1∑ (𝑆𝐶𝐴𝑅𝑡− 1 𝑁∑ 𝑆𝐶𝐴𝑅𝑡) 2 𝑁 𝑗=1 𝑁 𝑖=1 (9)
Parametrical tests usually assume an underlying normal distribtion. In the case that this assumption is violated, parametrical tests tend to reject the null hypothesis. Non-parametrical tests, however, do not assume an underlying normal distribution. In this paper, ARs are calculated on the basis of daily returns. The distribution tends to have fat tails and be skewed (see for instance Mandelbrot, 1963; Fama, 1965). Therefore, it can be assumed that this holds true for the calculated ARs. To account for this, the generalized sign test by Cowan (1992) is applied as an additional non-parametric test.
This test is a further development of the sign test, examining whether the fraction of positive ARs within the event period is higher than the number that would have been expected in the absence of the event and hence abnormal performance.
For this test, the expected number of positive returns is calculated as the fraction of positive returns within the estimation window used. The calculation is shown under (10):
𝑝̂ = 1 𝑁∑ 1 𝐿∑ 𝑆𝑖,𝑡 𝐿 𝑡=1 𝑁 𝑖=1 (10)
Methodology
17
with L being the number of days within the estimation window and Si,t being 1 if ARi,t at time
t is > 0 and 0 if otherwise.
The generalized sign test statistic uses the normal approximation with parameter p̂ and is specified as follows:
𝑍𝐺𝑆 =
𝜔−𝑁𝑝̂̂ [𝑁𝑝̂̂ (1−𝑝̂̂)]12
(11) with ω being the number of CARs within the event window t1 to t2 for which CAR > 0 holds true. The null hypothesis that is tested is that there is no difference between the fraction of positive returns within the event window compared to the estimation window and hence the expected fraction under the absence of the ARs.
Hypothesis development
18 3 Hypothesis development
The main goal of this study is to examine whether there is an effect of data breaches on firm value and, if there is a measurable effect, to quantify the resulting impact. As pointed out in section 2.3, this impact will be measured through an event study approach. Following the findings of previous studies using a similar approach, the assumption in this study is that there is a negative effect on firm value following a data breach event. Hence, the main null hypothesis of this study is as follows:
H10: Firms do not experience negative abnormal equity returns following a data breach
announcement.
As described in section 2.2, there are different company specific as well as incident specific variables that will be investigated in detail.
The following hypotheses will be tested regarding variables concerning company
characteristics.
Firstly, it will be investigated which of the eight different industries experiences the most negative abnormal equity returns, assuming that H10 is rejected. The hypothesis that will be
tested is that firms operating within the financial industry (SIC Code 6000 – 6799) experience the most negative ARs following a data breach announcement. This is expected, as these companies’ operations use high amount of sensitive customer information that can immediately be used to extract financial value, as in the case of the Equifax breach in which customer data was used to unauthorizedly increase credit lines. For other sectors, the conversion of the breached data into a financial value is anticipated to take more time since customer data, such as e-mail and address information, is usually sold to interested third parties, which might take a considerable amount of time.
H1CS: Companies operating in the financial sector (SIC 6000 – 6799) experience the
most negative abnormal equity returns following a data breach announcement.
This hypothesis is tested by comparing the CARs of the different industries in the event window [-1;1] and testing the CARs for statistical significance through a parametric and a non-parametric test (see section 2.3).
Furthermore, it is investigated if the company specific variables size, profitability and leverage have an impact on the realized ARs within the event window [-1;1]. As stated in section 2.2.1, it is expected that size will have a negative impact on the ARs realized, meaning
Hypothesis development
19
ARs should be more negative for firms that have a bigger size in terms of market capitalization. This is anticipated as firms with a bigger size probably experience a higher degree of media coverage following a data breach announcement. Hence, reputational costs might be higher in comparison to smaller firms. Following the line of argumentation of Malhotra and Malhotra (2011), these reputational costs mainly arise as customers and the market expect that bigger firms do have more complex IT systems than their smaller peers. A comparatively small breach (in terms of IT systems affected and number of customer records exposed) can already undermine trust in the ability of a firm to protect all of its IT systems and therefore the entire amount of customer information stored in the company’s IT infrastructure. This negative word-of-mouth effect is expected to be more significant for bigger firms as the coverage and network effects are higher due to the larger customer base. The outcomes expected for the variables profitability and leverage are also as stated in section 2.2.1, meaning it is expected that profitability will have a positive influence on the ARs while leverage is anticipated to show a negative effect. However, the effects are not expected to be as significant as for size. It is hypothesized that size will have the most significant influence on the ARs obtained. Therefore, profitability and leverage serve as control variables. The hypothesis tested is:
H2CS: The higher the market capitalization of a firm affected by a data breach, the more
negative the abnormal equity returns.
The hypothesis will be tested by applying an OLS regression to the CARs realized in the event window [-1;1], controlling for industry effects. The regression equation is specified as follows:
𝐴𝑅𝑖,𝑡 = 𝛼𝑖+ ß1𝑥 𝑆𝑖𝑧𝑒𝑖,𝑡 + ß2𝑥 𝑃𝑟𝑜𝑓𝑖𝑡𝑎𝑏𝑖𝑙𝑖𝑡𝑦𝑖,𝑡+ ß3𝑥 𝐿𝑒𝑣𝑒𝑟𝑎𝑔𝑒𝑖,𝑡+ 𝛾1𝑥𝐼𝑛𝑑𝑢𝑠𝑡𝑟𝑦𝑖,𝑡+
𝜀𝑖,𝑡 (12)
with i being the respective firm at time t.
The last hypothesis that is explored regarding variables on company characteristics is whether there is a notable effect if a subsidiary of a publicly listed company experiences a data breach. The underlying working hypothesis is that the parent company (i.e. the publicly listed firm) will realize negative abnormal equity returns. This view stems from the fact that the parent company will ultimately be affected in a cost perspective, for instance in terms of legal costs or customer compensation. Even if these costs are not borne by the parent company directly, the decline in profits as a result of these additional, potentially unanticipated costs for the
Hypothesis development
20
subsidiary results in declining profits that are passed on to the parent company. Additionally, the data breach of a subsidiary is expected to also have negative reputation effects for the parent company, ultimately leading to negative abnormal equity returns.
H3CS: Parent companies will realize negative abnormal equity returns if a subsidiary is
affected by a data breach.
The hypothesis is tested through an OLS regression over the event window [-1;1] to test if firms with affected subsidiaries realize negative ARs. The respective regression equation is as follows:
𝐴𝑅𝑖,𝑡 = 𝛼𝑖+ ß1𝑥 𝑆𝑢𝑏𝑠𝑖𝑑𝑖𝑎𝑟𝑦𝑖,𝑡+ 𝜀𝑖,𝑡 (13)
with subsidiary being a dummy variable.
Additionally, the sub-sample containing subsidiaries will be tested on significance by applying both the parametrical and non-parametrical significance test as stated in equation (7) and (11) to the CARs over the event window [-1;1].
Additionally, incident specific variables are analyzed as well.
Regarding the data breach incident itself, it will be tested whether the number of records exposed, i.e. the impact, has an effect on the ARs realized. It is expected that a higher number of records exposed leads to a more negative effect, meaning the ARs realized are more negative compared to incidents in which a smaller number of customer records are exposed. Also, it is envisioned that there is an interplay between the impact and firm size. In case both variables increase, the effect on ARs is expected to be more negative as well. The hypothesis tested therefore is:
H1IS: The higher the impact of a data breach in combination with an increase in firm
size, the more negative the realized abnormal equity returns.
This is tested through the following OLS regression over the event window [-1;1]:
𝐴𝑅𝑖,𝑡 = 𝛼𝑖 + ß1𝑥 𝐼𝑚𝑝𝑎𝑐𝑡𝑖,𝑡 + ß2𝑥 𝑆𝑖𝑧𝑒𝑖,𝑡+ ß3𝑥 (𝐼𝑚𝑝𝑎𝑐𝑡 𝑥 𝑆𝑖𝑧𝑒) + 𝜀𝑖,𝑡 (14)
Moreover, it will be investigated if the type of data breach that occurred (as specified under 2.2.2) has an impact on the realized ARs. Various studies conducted in recent years showed that there are differences in total costs arising from data breaches dependent on the type of breach (see for instance Accenture, 2017). The highest costs are associated with hacking attacks such as malware and DOS attacks while insider theft causes relatively little losses in
Hypothesis development
21
comparison. With these studies in mind, it is assumed that data breaches that can be categorized in category (2) Hacking/ phishing will experience the most negative ARs in comparison.
H2IS: Data breaches that are categorized as hacking and/or phishing attacks will
experience the most negative abnormal equity returns in comparison to the other breach type categories.
This hypothesis is tested by comparing means through a single-factor analysis of variance (ANOVA) as proposed by Fisher (1925). If differences in means can be detected and as a consequence the null hypothesis is rejected, a further t-test will be applied to detect the breach type with a difference in means.
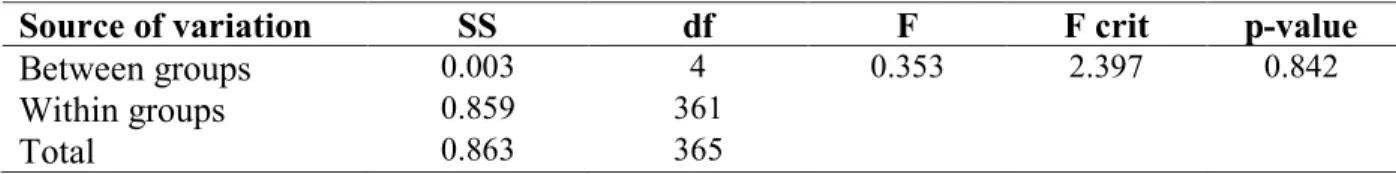
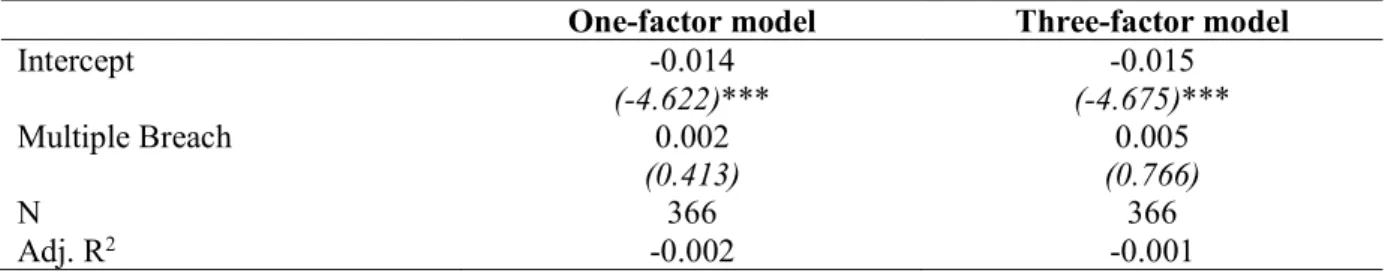
The last hypothesis that is tested regarding the data breach incident itself is whether companies that are affected by a data breach multiple times over the time frame January 2013 to July 2018 are experiencing more negative ARs over the event window [-1;1]. It is expected that companies that have been experiencing multiple breaches prior to the most recent and hence the data breach considered are realizing more negative ARs throughout the event period. This is anticipated as these companies are likely to lose customer trust multiple times, therefore the effect on brand reputation is expected to be much more negative, resulting in higher reputational costs to the company affected, which is reflected by more negative ARs. H3IS: A company experiencing multiple data breaches over the considered time frame of
2013 to 2018, is experiencing more negative ARs.
This will be tested using a further OLS regression, which is as follows:
𝐴𝑅𝑖,𝑡 = 𝛼𝑖+ ß1𝑥𝑀𝑢𝑙𝑡𝑖𝑝𝑙𝑒 𝐵𝑟𝑒𝑎𝑐ℎ𝑖,𝑡 + 𝜀𝑖,𝑡 (15)
with multiple breach being a dummy variable. The ARs considered for the regression are the ARs obtained for the most recent data breach. For instance, if a company experienced a data breach in 2014 and a second in 2017, the ARs considered for the regression are the ones obtained for the breach that occurred in 2017. This is done as it is anticipated that the negative effect for multiple breaches will be most significant for the latest breach, as customers and business partners should lose more trust the more often a company experiences a data breach, hence the reaction is expected to be more negative following each breach incident.
Hypothesis development
22
Additionally, to test for the significance of the sub-sample for companies that experienced multiple data breaches, parametrical and non-parametrical significance tests as stated in equation (7) and (11) will be applied to the CARs over the event window [-1;1].
Empirical results and discussion of findings
23 4 Empirical results and discussion of findings
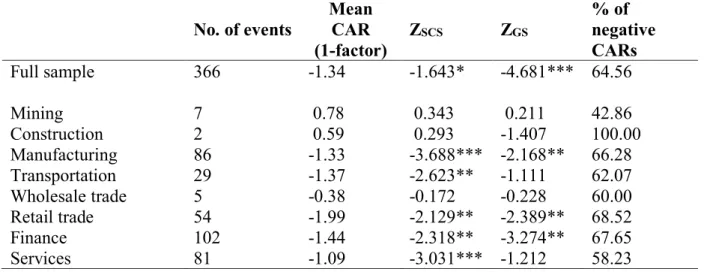
The results obtained for the CARs over the main event window of three days from t1= t-1 to t2= t+1 confirm the findings of previous studies. For the entire sample, including 366 events, the CARs obtained from both the one-factor model and the three-factor model are significantly negative. The following table shows the results for both models for the entire sample and for the respective industries as specified in table 2.
Table 6: Cumulative abnormal returns and test statistic results for three-day event window The following table provides the results of the event study over the event window t1= t-1 to t2= t+1 for the entire sample and for each industry, respectively. The calculation of the mean CARs reported is as stated in equation (6). The total number of events N is equal to the number reported in the column no. of events. The statistical significance of the mean CARs reported was assessed using the parametric test ZSCS as reported in equation (7) and the non-parametric test ZGS as reported in equation (11).
Percentage of negative CARs reports the relative fraction of negative CARs (<0) in each industry cluster. The mean CAR and % of negative CARs are reported in percent. *, ** and *** indicate the statistical significance at the 10%, 5% and 1% level.
Panel A shows the results obtained applying the one-factor model for the estimation of the abnormal returns as stated in equation (1), (3) and (5). Panel B shows the results for the three-factor model for the estimation of the abnormal returns as stated in equation (2), (4) and (5).
Panel A: Cumulative abnormal returns and test statistic results using the one-factor model No. of events Mean CAR
(1-factor) ZSCS ZGS % of negative CARs Full sample 366 -1.34 -1.643* -4.681*** 64.56 Mining 7 0.78 0.343 0.211 42.86 Construction 2 0.59 0.293 -1.407 100.00 Manufacturing 86 -1.33 -3.688*** -2.168** 66.28 Transportation 29 -1.37 -2.623** -1.111 62.07 Wholesale trade 5 -0.38 -0.172 -0.228 60.00 Retail trade 54 -1.99 -2.129** -2.389** 68.52 Finance 102 -1.44 -2.318** -3.274** 67.65 Services 81 -1.09 -3.031*** -1.212 58.23
Empirical results and discussion of findings
24 Panel B: Cumulative abnormal returns and test statistic results using the three-factor model
No. of events Mean CAR
(3-factor) ZSCS ZGS % of negative CARs Full sample 366 -1.33 -2.692*** -4.416*** 63.46 Mining 7 0.79 0.343 0.432 42.86 Construction 2 0.36 0.200 -1.421 100.00 Manufacturing 86 -1.21 -3.389*** -1.681* 62.79 Transportation 29 -1.51 -2.816*** -1.473 65.52 Wholesale trade 5 -0.55 -0.274 -0.281 60.00 Retail trade 54 -2.06 -1.971* -2.215** 66.67 Finance 102 -1.44 -2.333** -3.532*** 68.63 Services 81 -1.04 -2.842*** -0.834 55.70
The decrease in firm value over all industries is on average -1.33 percent to -1.34 percent, depending on the model used to estimate the ARs, over an event window of three days for t1= t-1 and t2= t+1. As the results obtained are statistically significant, the null hypothesis can be rejected. The robustness of the results is tested by applying the generalized sign test as stated in equation (11), as this non-parametric test does not assume a normal distribution of the obtained ARs. As the results reported for ZGS are significant at the one percent level for both
models for the full sample, it can be confirmed that a data breach incident has a negative impact on firm value. Based on the mean value of market capitalization, the loss in firm value over the three-day event window is on average equal to 392 million USD or rather 395 million USD, depending on the model used to estimate abnormal returns. This number seems to be rather high, keeping in mind that this amount is similar to the estimated costs for the Equifax breach which was one of the most significant breaches in the financial sector. Perhaps there is a differentiation of costs depending on the firm size in terms of market capitalization. Nevertheless, a decrease in firm value, independent from firm size and other variables such as industry type seems reasonable considering the reputational as well as direct cost related to a data breach event. The decrease in firm value is potentially based on the reputational costs of shattered customer trust and the negative associations towards brand perception which manifest in a decrease in sales and hence revenues. Further reputational costs might also include the termination of certain contracts by supplier that do not want to be associated with the brand following the data breach incident. Direct costs include the notification, the reimbursement and the ongoing support of customers. A high proportion of costs are potentially related to detecting the leak, its extent and the closure of the data vulnerability to prevent future data breaches. Whether it is beneficial for companies to ensure that no data
Empirical results and discussion of findings
25
breaches can occur in the future is discussed when looking at the results concerning the test of H3IS. Other direct costs include fines imposed by the FTC and legal costs that can be related
to lawsuits and settlements following a data breach.
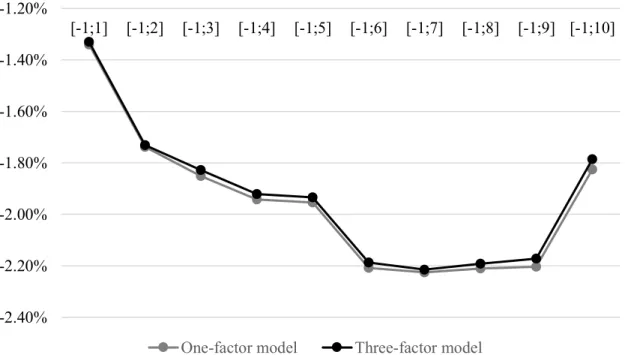
Extending the event window to the days beyond t2= t+1, it can be seen in the graph below that the negative effect on firm value is fully realized seven days after the event. The CARs as well as the results of the BMP-test and a normal t-test are reported in Appendix 1 in table 1. With regards to the normal t-test, the CARs are significant until t2= t+10 at the one percent level for both models. This is different for the BMP-test. The one-factor model shows very mixed results, with only some days within the extended event window being significant and only at the ten percent level. For the three-factor model, all event window periods are significant, however, the significance level decreases as the event window increases. This indicates that the use of a parametrical significance test is useful for the event study approach, as a normal t-test tends to overestimate the results obtained in the present case.
Figure 1: Development of cumulative abnormal returns until ten days after event
The graph below shows the development of mean CARs for the full sample of 366 events. The x-axis reports the different lengths of event windows from t1 to t2. The CARs are reported in %.
For the three-factor model, the realized CARs are slightly less negative over the course of time period in scope. The further decline in firm value over the following days is probably due to the fact that the full extent of the data breach, such as the total number of systems infiltrated and the total number of records exposed, is only fully detected during the days following the data breach announcement. Hence, the market adjusts its assessment of the full
-2.40% -2.20% -2.00% -1.80% -1.60% -1.40% -1.20% [-1;1] [-1;2] [-1;3] [-1;4] [-1;5] [-1;6] [-1;7] [-1;8] [-1;9] [-1;10]
Empirical results and discussion of findings
26
costs related to the breach over a course of seven days following the data breach announcement.
The first company related hypothesis, that companies within the financial industry suffer the highest degree in firm value decrease, does not hold true neither for the one-factor model nor the three-factor model. For both models, the retail industry experiences the most negative abnormal equity returns with -1.99 percent for the one-factor model and -2.06 percent for the three-factor model. These declines are significant at the five and ten percent significance level, respectively. However, for neither of the two models used the financial industry experiences the most negative abnormal equity returns. This sector also experiences a decrease in firm value, however, this decrease is not as negative as previously expected. This result is surprising, especially since this sector records the highest number of breaches in the covered time frame 2013 to 2018. A possible explanation might be the fact that these companies are the ones that are most commonly targeted in cyber security attacks. However, this cannot be empirically confirmed with the results obtained in this study. Due to the high frequency of breaches, companies within the financial sector might already have some kind of routine in responding to a data breach. This routine might manifest itself in processes that are already in place and designed in an effective way, starting from the detection of a data breach to the final legal settlement and the potential to avoid or reduce costly fines imposed by authorities and regulators. However, this explanation should be subject to further empirical investigation. In summary, H1CS cannot be confirmed with the results obtained in this paper.
Following, the results for the company specific hypothesis H2CS are reviewed. Table 7 shows
the results of the regression for the company specific variables size, profitability and leverage as stated in equation (12).
Empirical results and discussion of findings
27 Table 7: Regression results for company specific variables size, profitability and leverage This table provides the ARs of firms experiencing a data breach. The regression equation is reported under (12). The dependent variables are the CARs over the event window [-1;1]. The independent variables size, profitability and leverage are constructed as stated in section 2.2.1. Industry fixed effects are included as indicated. T-statistics are reported in parenthesis. *, ** and *** indicate the statistical significance at the 10%, 5% and 1% level.
One-factor model Three-factor model
Intercept -0.008 (-1.304) (-1.219) -0.008 Size 0.000 (0.900) (0.928) 0.000 Profitability 0.007 (2.432)** (2.676)*** 0.008 Leverage 0.006 (0.982) (0.929) 0.006
Industry fixed effects Yes Yes
N 366 366
Adj. R2 0.016 0.019
The results obtained lead to the rejection of H2CS. It cannot be statistically confirmed that
company size has an influence on the cumulated ARs over the event window [-1;1]. However, profitability does have a positive influence on the ARs for the entire sample over the specified event window. It seems that the market penalizes firms less severely for a data breach if they show a comparatively higher profitability. This is a comprehensible result as firms that are more profitable potentially have more cash and monetary reserves available which they can draw on in case of unexpected losses due to a data breach event. Therefore, more profitable companies might be able to absorb the monetary losses associated with data breaches in a better way. A company that is less profitable might have difficulties to cope with the expenses necessary to react to a data breach in an appropriate way. As company size on a standalone basis obviously does not have any effect on the ARs obtained, it was additionally tested whether the interplay of company size and impact of the data breach does have an effect on the ARs. Again, the hypothesis that the higher the company size and the higher the impact, the more negative the ARs (H1IS), cannot be confirmed for the companies within the sample. The
![Table 10: Significance tests of CARs for sub-sample on firms with affected subsidiaries This table shows the CARs over the event window [-1;1] for the sub-sample that only contains publicly listed companies whose subsidiaries experienced a breach between](https://thumb-eu.123doks.com/thumbv2/123dok_br/15672979.1062214/33.893.98.798.277.469/significance-affected-subsidiaries-contains-publicly-companies-subsidiaries-experienced.webp)