D
Development and
Optimization of an
Alternative and
Environmentally
Friendly Agar
Extraction Process.
Suitability of the
Extracted Agars for the
Fabrication of
Sustainable Materials.
Ana Margarida Moreira de Sousa
Programa Doutoral em Química Sustentável,
Departamento de Química e Bioquímica2014
Orientador
Maria do Pilar Figueroa Gonçalves, Professora Associada, Faculdade de Engenharia
This work was carried out with the finantial support of Fundação para a Ciência e a Tecnologia (FCT) through the concession of a PhD grant to Ana Margarida Moreira de
Dedicated to my parents, Miguel and Margarida and brother, Miguel
“We have enough consciousness and humanity to ensure a sustainable tomorrow.”
Paul Anastas
FCUP
ACKNOWLEDGEMENTS
v
Acknowledgements
First and foremost I would like to thank my supervisor, Dr. Maria do Pilar Gonçalves, for her great mentorship throughout this amazing journey. Looking back this last 4 years, I feel that I grew tremendously as a researcher much due to her great guidance and professionalism, always pushing me to get the best results and supporting me when I felt discouraged. Also, for all the patience and wise words particularly, in the final stage of the PhD. For that, I am truly grateful.
Second, I would like to thank Dr. LinShu Liu, my supervisor during my staying at the United States Department of Agriculture (USDA), Agricultural Research Service (ARS), Eastern Regional Research Center (ERRC), in Wyndmoor, Pennsylvania. I feel very fortunate to have been given the unique opportunity of working in such great institution and with the best possible working conditions. All the knowledge I gathered during the 7 months I stayed in the USA is priceless and I’m sure, will make me a better professional in the future. For that, I feel truly blessed and grateful.
Also, a special thanks to Dr. Kevin Hicks for kindly putting me in contact with Dr. Linshu.
Finally, a special acknowledgement to Dr. Sevim Erhan, the center director from ERRC-USDA, for allowing my coming to the center and also to Dr. Peggy Tomasula for receiving me in her research unit and making me feel so welcome.
I would also like to thank several people whose contribution allowed the success of my research:
Dr. Cristina Matos and Dr. Simone Morais from GRAQ-REQUIMTE, for allowing the use of the MAE apparatus. A special thanks to Dr. Morais for the guidance, fruitful comments and discussions throughout the MAE optimization. Thanks for always believing in me!
Dr. Ana Ramos and Dr. Eurico Cabrita from the FCT-UNL, for receiving me so well in their labs and sharing their expertise during my staying in Monte da Caparica.
My co-workers from LERA-REQUIMTE, Cristina, Hiléia and Manuela. Thanks for your precious advices and inputs and most importantly, for the great work environment throughout these 4 years. I had an amazing time!...also, to Patrícia and Natália for the great moments and for understanding my ‘crazy days’.
FCUP
ACKNOWLEDGEMENTS
vi Helena Abreu and Rui Pereira, former CIIMAR researchers and currently successful entrepreneurs, for supplying the raw-material for this work. Thanks for being such good co-workers. I wish you all the best with Algaplus (it’s really a great project)!
Here, I should also acknowledge Coelho & Castro Aquaculture, (Rio Alto, Portugal), where the IMTA systems operated.
A special thanks to Paula Paíga from GRAQ-REQUIMTE, for helping with the MAE extractions and mostly, for being such a great friend and person. You are truly an inspiration!
Here, I must also acknowledge everyone at GRAQ-REQUIMTE for the friendly work environment that made my life much easier during my long days of experiments.
Also, a special thanks to João Borges for the excellent AFM images and fruitful discussions concerning the AFM studies, for the great professionalism and good friendship.
During my staying in the USA I met the most amazing people that made my time there, a life changing experience.
It is impossible to mention everyone from the ERRC-USDA because everyone REALLY made a difference in my daily life! I thank you ALL for making my life so easy!
A special thanks to Joe Uknalis and Nick Latona for doing everything in their power to make all analysis as soon as possible!... also, to Andre White for the daily patience and kind words always with perfect timing. Thank you!!
Thanks to Jessica for all the hard work. I’m sure you will become a great researcher in the future!
A big and special thanks to Ran and Dr. Shih-Chuan Liu. You were amazing co-workers and most importantly, excellent friends! I learned a lot with you, both at professional and personal levels. Also, to my dear friends Daxi, Qiu Qin, Dr. Liu and all the others (I cannot name you all but I will carry you guys in my heart forever!!).
A special thanks to Bret for being such a great friend and very patient landlord, always trying to make our life easier! Of course, I cannot forget sweet Sadie for all the runs, walks and good company. Thank you!
To Dr. James Shie for caring and for being such an amazing person!
A special thanks to Dani for lighten up my days with her smile… of course to Debra, for the kindness and friendship.
FCUP
ACKNOWLEDGEMENTS
vii Thanks to Dr. Ivo Marinov from Atlanta Chemical Enginnering L.L.C., for sharing his knowledge on MAE processing and providing me with all the information concerning the MAE scale-up. It was truly a precious help!
Finally, I would like to acknowledge the Fundação para a Ciência e a Tecnologia (FCT) for financial support to REQUIMTE (grant no. PEst-C/EQB/LA0006/2011) and for the concession my PhD grant (SFRH/BD/64315/2009).
A big thank you to my very BEST and ‘OLD’ friends from Santo Tirso, who I neglected so many times because of this PhD project and who always forgave me and understood my options. You are all very special to me!
Finally, a very special thanks to Gabriel, for being brave enough to enter my life at the worst time ever and supporting me in all possible ways! You were amazing and made everything so much easier! I will never forget that!
I would like to dedicate this thesis to my family. Mom and Dad, you were super heroes! I WILL NEVER FORGET THE EFFORT YOU DID TO MAKE MY LIFE EASIER during these 4 years. You are my inspiration. I look up to each one of you hoping to become a better professional and most of all, a better person. This WOULD HAVE NEVER BEEN POSSIBLE WITHOUT YOU and I feel truly blessed for having you in my life!
… and last but not least, a huge thanks to the best brother ever, Miguel! Thanks for being there for me in the good and mostly in the bad times… for being father, best friend and brother, all at once! You are great!
FCUP
ABSTRACT
viii
Abstract
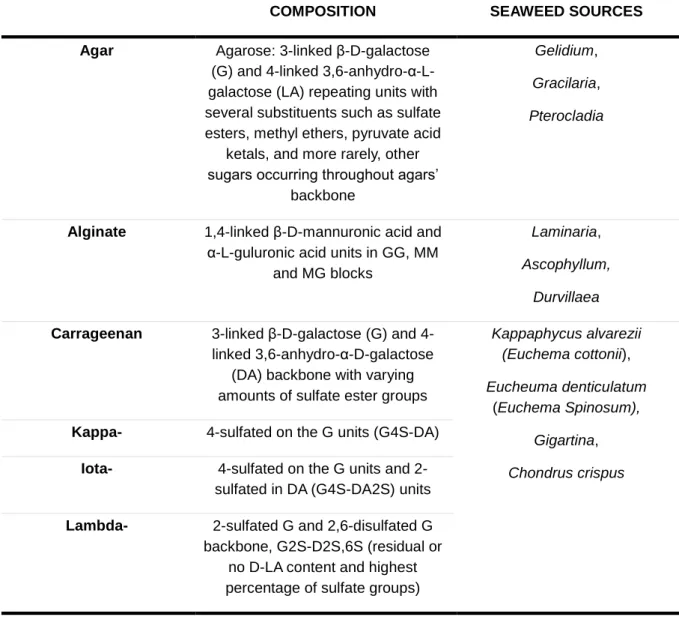
Agar is a seaweed polysaccharide (SP), mainly used in the gel-form in food applications, although its interest for the production of new materials towards the development of emerging areas such as, tissue engineering or ‘smart materials’ has recently gained great attention. Due to its unique molecular structure and behavior supported by strong intra- and intermolecular hydrogen bonds, agar has excellent gelling and film-forming properties. It is also easy to process which makes it attractive to be used in other forms such as bioplastic films (aqueous-blended and melt-processed) or fibers.
Agar industry is a well-established sector in the field of hydrocolloids mostly sustained by long-term implemented machineries and processes, often lacking efficiency. In the current global economic scenario, the use of more efficient technologies, processes and products, not only complies with sustainable development but is also vital for companies to keep competitiveness.
Recent incentives given to the bio-energetic sector and the need to move away from food crops have opened new market opportunities for a second generation of feedstocks based in non-food crops such as algae and by-products. In parallel, the expected growth demand for plastics will demand greater production and consumption of bioplastics.
Gracilaria vermiculophylla is a red algal species currently dominant in Ria de Aveiro,
northwestern Portugal (40°38’’N, 8°43’’W). As non-native species may have a negative impact in the recipient ecosystems intensive joint efforts have been carried out to explore the potentialities of this national underexploited resource. The use of G. vermiculophylla as biofilter in an integrated multitrophic aquaculture (IMTA) system, which is a sustainable farming approach, has shown to be very promising. In wild, cultivated or as waste of emerging industries, seaweeds hold the potential to become a sustainable resource for hydrocolloid and/or polymer transformation industries. Considering the seasonal variation on the abundance and quality of the biomass harvested from wild populations, the production of seaweeds in IMTA systems can offer a continuous supply of raw material with reliable quality to the transformation industries.
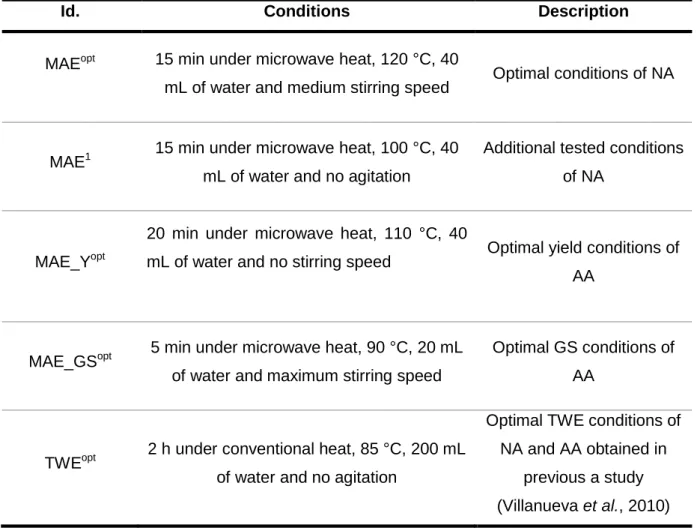
In the first stage of the PhD project, microwave-assisted extraction (MAE) of native (NA) and alkali-treated (AA) agars from IMTA Gracilaria, was tested and optimized using response surface methodology. The influence of the MAE operational parameters (extraction time, temperature, solvent volume and stirring speed) on the physical and chemical properties of agar (yield, gel strength (GS), gelling and melting temperatures, as well as
FCUP
ABSTRACT
ix sulfate and LA contents) was evaluated in a 24 orthogonal composite design. The found optimal MAE conditions were applied to the same wild biomass to study the influence of the seaweeds’ growth conditions in the quality of the extracted SP. In addition, MAE agars were compared in terms of their properties with SP extracted using a traditional water extraction (TWE) method, previously optimized by our group (2 hours, 200 mL, 85 °C, no agitation).
The quality of the AA obtained by MAE compared favourably with that attained using TWE. The gelling properties were best when the SP were extracted from IMTA Gracilaria and the extracts compared favourably with a commercial sample used as reference. Maximum GS of AA were attained at relatively mild MAE conditions (5 minutes of extraction, 90 °C, 20 mL, maximum stirring speed) which could be very important for industrial implementation (avoid safety concerns). Higher AA amounts were recovered when using 20 minutes of extraction, 110 °C, 40 ml of solvent and no agitation.
MAE optimal conditions (15 min of extraction, 120 °C, 40 mL of solvent and medium stirring speed) led to higher NA recoveries than TWE yet, the lower Mw and Mv indicated
substantial depolymerization of the SP backbone; this resulted in lower GS, in any case, fulfilling the commercial standards for application in soft-texture food products. The higher tendency for degradation when exposed to microwaves could be attributed to the higher sulfate content of NA (more labile character of L6S units). AA in turn, with higher LA fraction were more stable to microwaves. The MAE approach supports sustainable development, as it requires less energy and solvent than conventional processes, while generating fewer wastes. This work suggests the feasibility of exploitation of G. vermiculophylla, wild or produced in IMTA systems, for the production of agar gels with commercial quality.
A case study concerning the influence of the extraction process on the rheological and structural properties of representative AA from wild Gracilaria was carried out. While TWE agar showed a more open and irregular 3D network, MAE agar gel imaged by cryoSEM was denser and fairly uniform. The rheological (higher thermal stability and consistency) and mechanical (higher GS) behaviors of MAE agar seemed consistent with a positive effect of molecular mass and LA content. MAE produced non-degraded agar comparable with commercial ones, and if properly monitored, could be a promising alternative to TWE.
In order to assess the influence of MAE conditions on the behavior of NA and AA in dilute and concentrated aqueous media, a second case study was performed also using agars from wild Gracilaria. Different MAE routes led to SP with unique properties which in turn, resulted in different molecular assemblies imaged by AFM and cryoSEM, in dilute and concentrated aqueous media. The molecular assemblies of agars can be tuned via MAE which can be of great interest towards the development of new agar-based materials for
FCUP
ABSTRACT
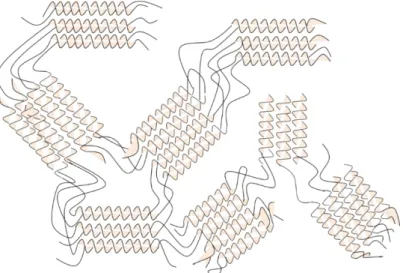
x emerging applications. The image studies supported well the view of double helix formation followed by intensive double helix association proposed for agar gelation.
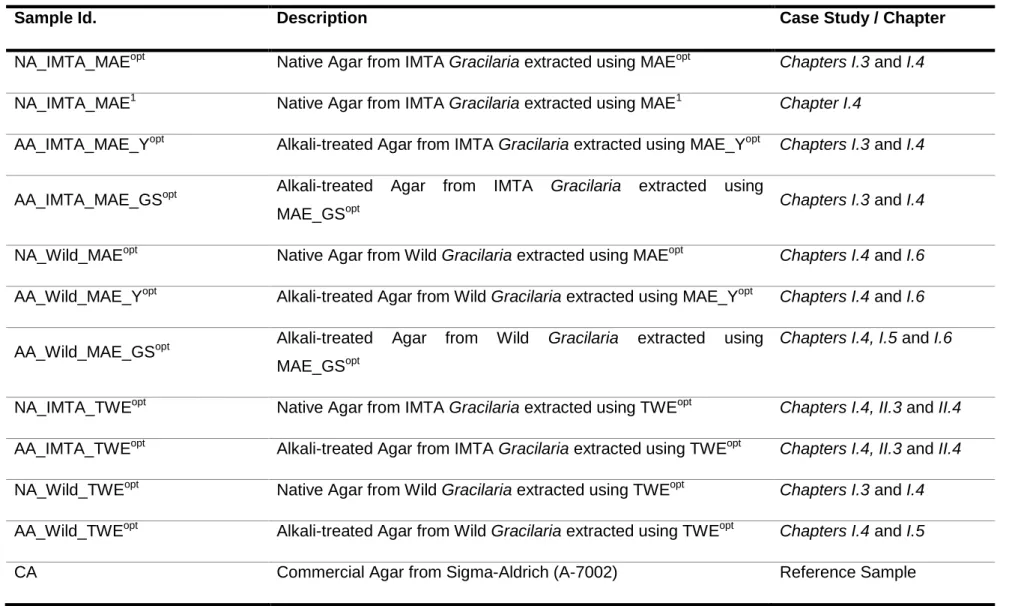
The 2nd stage of the PhD project focused on exploring the obtained optimal agar extracts for the production of sustainable materials. The first considered applications were the production of aqueous agar-blended films and hydrogels. For these studies, representative agar extracts were used: NA and AA from IMTA Gracilaria extracted using TWE (i.e. NA_IMTA_TWEopt and AA_IMTA_TWEopt). Agar/locust bean gum (LBG) mixtures were prepared at different mass ratios (i.e. 100/0, 75/25, 50/50, 25/75, 0/100) using water as solvent and processed in the form of films or hydrogels.
The addition of LBG to agar made easier the films’ fabrication by dramatically increasing the viscosity and decreasing the gelling character of the solutions as confirmed by rheology. It also led to a significant improvement of the films’ final properties. Best films were found at 50/50 and 25/75 agar/LBG mass ratios for AA_IMTA_TWEopt while NA_IMTA_TWEopt prepared at 25/75 yielded the best results. For instance, the mechanical properties for the mentioned optimal AA_IMTA_TWEopt formulations fell in the range, TS ~80-110 MPa and YM ~69-84 MPa, while for 25/75 NA_IMTA_TWEopt/LBG, TS ~80-120 MPa and
YM ~67-93 MPa. All agar/LBG films were very brittle (EB in the range ~1.6-2.4 %). The
obtained data show the potential of NA to fabricate aqueous-blended films with comparable or even improved properties than alkali-modified SP. This can be very cost-attractive since the extraction of native SP doesn’t need the inclusion of an alkaline step prior to the extraction. Moreover, the addition of LBG in percentages as high as 50-75%, will further reduce the cost of the films since this polysaccharide is cheaper than agar.
The addition of LBG to agar hydrogels led to mixed systems with various rheological properties which can be very attractive for the manufacture of new products with interesting textures and mouth feel to the consumers. As seen in the films’ case, the physicochemical nature of agar was a relevant factor in the definition of the binding mechanisms between agar and LBG. SAOS and LAOS studies gave different and insightful information on the microstructure of the mixed gels as well as the established interactions between both polysaccharides. The rheological tests seemed to indicate different interactions of NA and AA with LBG, which could be related with the different physicochemical nature of the SP. Yet, further studies are clearly needed to shed more light on this topic. The LBG incorporation to AA_IMTA_TWEopt solutions, decreased the GS and increased the deformability of the gels. The interactions established between agar and LBG were also dependent on the material’s form.
FCUP
ABSTRACT
xi In order to improve the typical brittle nature of agar films other explored application was the production of non-aqueous agar films. To this end, we tested the suitability of ChCl/urea (DES-U) and ChCl/glycerol (DES-G) eutectic mixtures, at 1:2 molar ratios, used as both solvent and plasticizer. For this application, a commercial agar sample was used. A three-step process was proposed: pre-solubilization of polymer in DES followed by compression-molding and subsequent drying. The mechanical properties, water resistance and microstructure of the films were evaluated at different agar concentrations (i.e. 2 to 6% wt). DES-U showed by far the best film forming ability. Agreeing with the diffusion and SEM data, films with best mechanical properties were found at the lowest and highest concentrations of agar (e.g. TS of 24.2-42 MPa and EB of 15.4-38.9%). Clearly, by replacing water by an alternative solvent such as DES-U, films with remarkably different functional properties can be obtained which might be very attractive for the development of new materials based on agar.
The last form of material to be tested was agar fibers produced by electrospinning technique. Micro- to nano-sized fibers were obtained by processing agar and agar/PVA solutions with different mass ratios (100/0,…, 50/50,…,0/100) at 50 °C. In water, the addition of a co-blending polymer to 1% wt agar solution was needed to attain spinnability. Above 60% PVA content in the final blend (from a 10% wt PVA starting solution), defect-free electrospun nanofibers were obtained. Pure agar nanofibers were only obtained when replacing water by DES-U. The effectiveness of the electrospinning was strongly impacted by the viscoelasticity of the DES-U systems. Solutions with very good spinnability were obtained even at 1% wt agar concentration if working far beyond the gelation transition. In both cases (using water or DES-U), the apparent viscosity increased with the addition of PVA. The morphology of agar composite fibers in DES-U was greatly affected by the composition of the spinning solution and processing conditions. In the quest for highly functional and sustainable materials this can be quite promising.
Keywords: Gracilaria vermiculophylla; Integrated multi-trophic aquaculture; Polysaccharides; Native agars; Alkali-treated agars; Microwave-assisted extraction; Deep eutectic solvents; Hydrogels; Films; Fibers; Electrospinning; Rheology; AFM; SEM; Sustainability.
FCUP
RESUMO
xii
Resumo
O agar é um polissacarídeo que surge como material intracelular em várias espécies de algas marinhas vermelhas, maioritariamente usado como agente gelificante e estabilizante em aplicações alimentares. Em anos recentes, o seu uso no fabrico de novos materiais para áreas emergentes, tais como engenharia de tecidos ou produção de ‘materiais inteligentes’, tem também suscitado amplo interesse. Devido à sua estrutura molecular única, suportada por fortes ligações de hidrogénio intra- e intermoleculares, o agar possui excelentes propriedades gelificantes e formadoras de filme. É também facilmente processável, o que o torna atrativo para ser usado noutras formas para além de gel, tais como filmes bioplásticos (aquosos e termo-processados) ou fibras.
A produção industrial do agar possui uma longa tradição na indústria dos hidrocolóides sendo sustentada por tecnologias e equipamentos antigos e, por isso, muitas vezes pouco eficientes. Na atual conjuntura económica, o uso de tecnologias, processos e produtos mais eficientes não só cumpre com os princípios de desenvolvimento sustentável como também é vital para as empresas se manterem competitivas.
Os incentivos dados, recentemente, ao setor bioenergético e a necessidade de não competirmos com o cultivo de alimentos, possibilitaram uma nova oportunidade de mercado para uma segunda geração de matérias-primas com origem em produtos não alimentares tais como algas e subprodutos. Paralelamente, o esperado aumento da procura de plásticos exigirá uma maior produção e consumo de bioplásticos.
A Gracilaria vermiculophylla, é uma espécie de alga vermelha, atualmente dominante na Ria de Aveiro, noroeste Portugal (40°38’’N, 8°43’’W). Dado os impactos negativos que espécies não nativas podem ter nos ecossistemas recetores, têm sido levados a cabo esforços conjuntos entre diferentes áreas de investigação com o intuito de explorar as potencialidades deste recurso nacional subexplorado. O uso da G. vermiculophylla como biofiltro em sistemas de aquacultura multitrófica integrada (AMTI), que é um tipo de cultivo sustentável, mostrou ser bastante promissor.
No seu estado natural, cultivadas ou como subprodutos de indústrias emergentes, as algas têm um grande potencial de se tornarem um recurso sustentável para as indústrias dos hidrocolóides ou outros setores transformadores. Considerando a variabilidade na abundância e qualidade da biomassa resultante das populações naturais, o cultivo de algas em sistemas de AMTI pode permitir um fornecimento contínuo de matérias-primas, com qualidade regular, para as indústrias transformadoras.
FCUP
RESUMO
xiii Na primeira fase do presente projeto de doutoramento, foi testada e otimizada a extração assistida por microondas (EAM) de agares nativos (AN) e pré-tratados (APT) de G.
vermiculophylla cultivada em sistemas de AMTI, usando a metodologia de superfície de
resposta. Foi estudado o efeito de diferentes parâmetros da EAM – tempo de extração, temperatura, velocidade de agitação e volume de solvente – sobre o rendimento da extração e as caraterísticas do agar extraído, nomeadamente, teor em sulfatos e em 3,6 – anidro – L – galactose (LA), força de gel (FG) e temperaturas de gelificação e de fusão. Um desenho ortogonal 24 foi a abordagem estatística escolhida para a otimização do processo de extração. Os agares da EAM foram comparados, em termos de propriedades, com agares obtidos pelo método de extração convencional (extração aquosa a quente, EAQ), previamente otimizado pelo nosso grupo (2 horas, 200 mL, 85 °C, sem agitação). Adicionalmente, com o intuito de estudar a influência das condições de crescimento das algas nas propriedades finais dos agares extraídos, foram aplicadas as condições ótimas de EAM e EAQ a amostras de populações naturais de G. vermiculophylla (in natura).
A qualidade dos APT obtidos por EAM foi claramente superior aos obtidos por EAQ. As propriedades gelificantes foram melhores nos agares extraídos da Gracilaria cultivada e, independentemente das condições de crescimento das algas, os resultados foram superiores ao da amostra de agar comercial usada como referência. A FG máxima para os APT foi obtida a condições de EAM relativamente suaves (5 minutos de extração, 90 °C, 20 mL, agitação máxima), o que poderá ser muito relevante em termos da implementação industrial do processo (minimização dos riscos de segurança). O rendimento ótimo dos APT foi registado para 20 minutos de extração, 110 °C, 40 ml de volume e sem agitação.
As condições de EAM ótimas: 15 minutos de extração, 120 °C, 40 mL de volume de solvente e agitação média, permitiram obter maiores rendimentos de AN que o método convencional; no entanto, as massas moleculares mais baixas estimadas para estes agares evidenciaram uma maior degradação das cadeias poliméricas quando comparados com os polissacarídeos obtidos por EAQ; isto traduziu-se em valores de FG mais baixos, em todo o caso, de acordo com os valores comerciais de referência para aplicações alimentares com texturas suaves. A maior suscetibilidade à degradação por microondas poderá ser atribuída ao maior teor em sulfatos dos AN (maior caráter lábil dos monómeros L6S). Por seu turno os APT, com maior teor em LA foram mais estáveis às microondas. A EAM suporta o desenvolvimento sustentável pois requere menores gastos de energia e de solventes que os processos convencionais, simultaneamente gerando menos resíduos. Os resultados obtidos sugerem a viabilidade de exploração da G. vermiculophylla, cultivada em AMTI ou in natura, para a produção de agares com qualidade comercial.
FCUP
RESUMO
xiv A influência do processo de extração nas propriedades reológicas e estruturais dos agares foi estudada através de um caso de estudo com extratos representativos de agares de Gracilaria in natura. Os ensaios de microscopia de varrimento eletrónico evidenciaram redes poliméricas 3D mais densas e uniformes para os géis de agar obtidos por EAM, e redes mais abertas e irregulares para os géis de polissacarídeos obtidos por EAQ. Os comportamentos reológicos (maior consistência e estabilidade térmica) e mecânicos (maior FG) do agar obtido por EAM foi consistente com um efeito positivo da massa molecular e do teor em LA. A EAM produziu agares não degradados com propriedades comparáveis a amostras comerciais, e se bem otimizado, pode constituir uma alternativa promissora à EAQ.
Um segundo caso de estudo foi levado a cabo para perceber a influência das condições operacionais da EAM no comportamento de AN e APT, em meio aquoso diluído e concentrado. Para o efeito, também foram considerados agares de Gracilaria in natura. Diferentes condições de EAM produziram agares com propriedades únicas, o que, por sua vez, resultou em aglomerados moleculares únicos observados por microscopias de força atómica e eletrónica de varrimento. As imagens obtidas foram concordantes com o modelo atualmente proposto para o mecanismo de gelificação do agar: formação de hélices duplas seguida de intensa associação entre hélices. A arquitetura molecular do agar pode ser moldada via EAM, o que pode ter bastante interesse no desenvolvimento de novos biomateriais, feitos à base de agar, para aplicações em áreas emergentes.
A segunda fase do projeto de doutoramento focou-se na produção de materiais sustentáveis feitos à base dos agares extraídos. As primeiras formas de materiais exploradas foram filmes aquosos e hidrogéis à base de agar e goma de alfarroba. Para estes estudos, foram usados AN e APT de Gracilaria cultivada, obtidos por EAQ (i.e. AN_AIMT_EAQopt and APT_AIMT_EAQopt). As misturas de agar/goma de alfarroba foram preparadas com diferentes composições mássicas (i.e. 100/0, 75/25, 50/50, 25/75, 0/100) e processadas na forma de filmes e/ou hidrogéis.
A adição da goma de alfarroba ao agar facilitou o processamento das soluções durante o fabrico dos filmes através de um aumento significativo da viscosidade e diminuição do caráter gelificante das soluções. Também possibilitou uma melhoria significativa nas propriedades finais dos filmes. As formulações ótimas para o APT_AIMT_EAQopt foram as 50/50 e 25/75 agar/goma de alfarroba, enquanto que o AN_AIMT_EAQopt misturado a 25/75 produziu os melhores resultados. Por exemplo, as propriedades mecânicas para as misturas ótimas de APT_AIMT_EAQopt situaram-se entre, ~80-110 MPa para a tensão-na-rutura (TR) e ~69-84 MPa para o modulo de Young (MY),
FCUP
RESUMO
xv enquanto que para o filme 25/75 de AN_AIMT_EAQopt/goma de alfarroba, TR ~80-120 MPa e MY ~67-93 MPa. Todos os filmes de agar/goma de alfarroba produzidos foram muito quebradiços (deformação-na-rutura, DR entre ~1.6-2.4 %). Os resultados reunidos nesta fase mostraram o potencial dos AN para o fabrico de filmes aquosos com propriedades comparáveis ou mesmo melhores do que os APT. Isto pode ser economicamente bastante atrativo uma vez que os AN não necessitam de pré-tratamento alcalino antes do processo de extração. A adição da goma de alfarroba em percentagens tão elevadas como 50-75% permitirá reduzir ainda mais o custo final do bioplástico, uma vez que é um polissacarídeo mais barato de produzir que o agar.
A adição da goma de alfarroba aos hidrogéis de agar resultou em sistemas com propriedades reológicas variadas, o que pode ser bastante atrativo para o desenvolvimento de produtos com novas e interessantes texturas, mais apelativas ao consumidor. Tal como nos filmes, a natureza físicoquímica do agar foi um fator relevante na definição dos mecanismos de interação entre o galactano e a goma de alfarroba. Os estudos reológicos levados a cabo a pequenas e elevadas deformações deram informação importante e complementar relativamente à microestrutura dos géis obtidos, bem como às interações estabelecidas entre os polissacarídeos. Os resultados reológicos obtidos a elevadas deformações pareceram indicar interações diferentes entre cada agar e a goma de alfarroba. Contudo, mais estudos serão necessários para fundamentar esta sugestão. A adição da goma de alfarroba aos géis de APT_AIMT_EAQopt diminuiu a FG e aumentou a sua deformabilidade. As interações estabelecidas entre o agar e a goma de alfarroba foram diferentes, dependendo do material (filmes aquosos ou hidrogéis).
A fim de diminuir o caráter quebradiço tipicamente associado aos filmes aquosos de agar, foi explorada a produção de filmes de agar não aquosos. Para este efeito, foi testada a aplicabilidade, como solventes e plastificantes, das misturas eutéticas de cloreto de colina/ureia (DES-U) e cloreto de colina/glicerol (DES-G) com uma razão molar de 1:2, na produção de filmes de agar comercial a diferentes concentrações de polímero (i.e. 2 to 6% wt). A metodologia de fabrico dos filmes consistiu na pré-solubilização do agar no DES seguida por termo-compressão do sistema e posterior secagem. A mistura eutética de DES-U revelou, de longe, as melhores propriedades formadoras de filme. Concordando com os resultados de permeabilidade e de microscopia, as melhores propriedades mecânicas foram obtidas para as concentrações mais baixa e mais alta de agar (p.ex. TR entre 24.2-42 MPa e DR entre 15.4-38.9%). Claramente, substituindo a água por um solvente alternativo como o DES-U, podem ser produzidos filmes de agar com propriedades funcionais substancialmente diferentes dos materiais aquosos habitualmente produzidos.
FCUP
RESUMO
xvi O ultimo estudo dos materiais focou a produção de fibras de agar por eletrofiação (‘electrospinning’). Micro- e nanofibras com diferentes morfologias foram produzidas através do processamento, a 50 °C, de misturas de agar/PVA preparadas em água e em DES-U, com diferentes proporções mássicas (100/0,…, 50/50,…,0/100). Em meio aquoso, a adição do PVA a uma solução de agar 1% wt foi necessária para obter uma amostra eletrofiável. Acima de 60% de teor de PVA na mistura final (a partir uma solução-mãe de 10% wt PVA), foram produzidas nanofibras sem defeitos.
Nanofibras de agar puras só foram conseguidas quando se substituiu a água pelo DES-U. Neste caso, a eficácia do processo de eletrofiação dependeu fortemente da viscoelasticidade dos sistemas de agar/PVA. Quando operando longe da temperatura de gelificação do sistema, foram obtidas soluções facilmente eletrofiáveis mesmo quando usando uma concentração de agar de 1% wt. Nos dois tipos de sistemas (aquosos ou em DES-U), a viscosidade aparente aumentou com a adição do PVA. A morfologia das fibras compósitas de agar, em DES-U, foi muito afetada pela composição da solução e das condições de processamento. Na busca pelo desenvolvimento de novos materiais altamente funcionais e sustentáveis, os resultados obtidos podem ser bastante promissores.
Palavras-chave: Gracilaria vermiculophylla; Aquacultura multitrófica integrada; Polissacarídeos; Agares nativos; Agares pré-tratados; Extração assistida por micro-ondas; Solventes eutéticos; Hidrogéis; Filmes; Fibras; Eletrofiação; Reologia; Microscopia de Força Atómica; Microscopia Eletrónica de Varrimento; Sustentabilidade
FCUP
LIST OF PUBLICATIONS
xvii
List of Publications
List of publications in peer-reviewed journals included in this PhD thesis:
A.M.M. Sousa, H.K.S. Souza, N. Latona, C.-K. Liu, M.P. Gonçalves, L.S. Liu, 2014.
Choline chloride based ionic liquid analogues as tool for the fabrication of agar films with improved mechanical properties. Carbohydrate Polymers (accepted).
Ana M.M. Sousa, João Borges, Fernando Silva, Maria Pilar Gonçalves, 2013. Influence
of the extraction process on the rheological and structural properties of agars.
Carbohydrate Polymers, 96, 163-171.
Ana M.M. Sousa, João Borges, Fernando Silva, Eurico J. Cabrita, Ana Ramos, Maria Pilar Gonçalves, 2013. Shaping the molecular assemblies of native and
alkali-modified agars in dilute and concentrated aqueous media via microwave-assisted extraction. Soft Matter, 9, 3131-3139.
Ana M.M. Sousa, Simone Morais, Maria H. Abreu, Rui Pereira, Isabel Sousa-Pinto, Eurico J. Cabrita, Cristina Delerue-Matos, 2012. Structural, Physical and Chemical
Modifications Induced by Microwave Heating on Native Agar-like Galactans, Journal
of Agricultural and Food Chemistry, 60, 4977-4985.
• A.M.M. Sousa, V.D. Alves, S. Morais, C. Delerue-Matos, M.P. Gonçalves, 2010. Agar
extracted from integrated multitrophic aquacultured Gracilaria vermiculophylla: evaluation of a microwave-assisted process using Response Surface Methodology.
Bioresource Technology, 101, 3258-3267.
Other publications in peer-reviewed journals concerning related studies with this PhD thesis:
Hiléia K.S. Souza, Ana M.M. Sousa, Javier Goméz, Maria Pilar Gonçalves, 2012.
Complexation of WPI and Microwave-Assisted Extracted Agars with Different Physicochemical Properties. Carbohydrate Polymers, 89, 1073-1080.
R. Villanueva, A.M.M. Sousa, M.P. Gonçalves, M. Nilsson, L. Hilliou, 2010. Production
and properties of agar from the invasive marine alga, Gracilaria vermiculophylla (Gracilariales, Rhodophyta). Journal of Applied Phycology, 22, 211-220.
FCUP GENERAL INDEX xviii
General Index
Acknowledgements v Abstract viii Resumo xiiList of Publications xvii
List of Figures xxviii
List of Tables xli List of Symbols, Abbreviations and Shorthand Notations xlvi
General Introduction
Preface liv Goals lv Thesis Organization lviiPART I. Development and Optimization of an Alternative and
Environmentally Friendly Agar Extraction Process
CHAPTER I.1. Literature Review
I.1.1. Seaweeds: An Overview 3I.1.2. Seaweeds: a Promising Resource for Sustainable Development 5
I.1.3. Seaweed Polysaccharides (SP) 6
I.1.3.1. Agar 7
I.1.3.1.1. Agar Gelation 9
FCUP
GENERAL INDEX
xix
I.1.4. Integrated Multitrophic Aquaculture (IMTA) 12
I.1.5. Gracilaria vermiculophylla: a National Underexploited Resource 15
I.1.6. Agar Traditional Water Extraction (TWE) 17
I.1.7. Agar Industry 18
I.1.7.1. Agar Industry in Portugal 20
I.1.7.2. Agar Applications 20
I.1.8. Microwave-Assisted Extraction (MAE) 24
I.1.8.1. MAE of Seaweed Compounds 26
I.1.8.2. MAE Scale-up 27
References. 30
CHAPTER I.2. Materials and Methods
I.2.1. Chemicals 42I.2.2. Preparation of Seaweed Samples 42
I.2.3. Agar Extractions 45
I.2.4. Purification of Agar Extracts 46
I.2.5. Structural Characterization 46
I.2.5.1. NMR and FTIR Spectroscopies 46
I.2.5.1.1. Basic Principles 46
I.2.5.1.2. Experimental Procedures 51
I.2.6. Physicochemical Characterization 53
I.2.6.1. Determination of the Sulfate and Sugar Contents 53
I.2.6.2. Size Exclusion Chromatography (SEC) 54
I.2.6.2.1. Basic Principles 54
I.2.6.2.2. Experimental Procedure 55
FCUP
GENERAL INDEX
xx
I.2.7.1. Atomic Force Microscopy (AFM) 56
I.2.7.1.1. Basic Principles 56
I.2.7.1.2. Preparation of Agar Solutions 58
I.2.7.1.3. Experimental Procedure 58
I.2.7.2. Intrinsic Viscosity Measurements 59
1.2.7.2.1. Basic Principles 59
1.2.7.2.2. Experimental Procedure 61
I.2.8. Concentrated Aqueous Regime Studies 61
I.2.8.1. Preparation of Agar Solutions and Gels 61
I.2.8.2. Rheological Measurements 62
I.2.8.2.1. Basic Principles 62
I.2.8.2.1.1. Dynamic Oscillatory Testing 64
I.2.8.2.1.2. Steady Shear Measurements 67
I.2.8.2.2. Experimental Procedure 67
I.2.8.3. Texture Analysis 69
I.2.8.3.1. Basic Principles 69
I.2.8.3.2. Penetration Tests of Agar Gels 71
I.2.8.3.2.1. Experimental Procedure 71
I.2.8.4. cryoScanning Electron Microscopy (cryoSEM) 72
I.2.8.4.1. Basic Principles 72
I.2.8.4.2. Experimental Procedure 74
References. 75
CHAPTER I.3. MAE Optimization
I.3.1. Optimization Strategy 79FCUP
GENERAL INDEX
xxi
I.3.2.1. Yield 81
I.3.2.2. Gel Strength (GS) 84
I.3.2.3. Gelling and Melting Temperatures 85
I.3.2.4. Sulfate Content 88
I.3.2.5. LA Content 89
I.3.3. MAE Optimization of NA 93
I.3.4. Conclusions 97
References. 97
CHAPTER I.4. Characterization of the Extracted Agars: Influence of Extraction
Process and Seaweed Growth Conditions
I.4.1. Agars from IMTA Gracilaria 100I.4.1.1. Native Agars (NA) 100
I.4.1.1.1. Structural Analysis 100
I.4.1.1.2. Yield and Physicochemical Properties 109
I.4.1.2. Alkali-treated Agars (AA) 111
I.4.1.2.1. Structural Analysis 111
I.4.1.2.2. Yield and Physicochemical Properties 112
I.4.2. Wild Gracilaria 114
I.4.2.1. MAE Agars 114
I.4.2.1.1. Structural Analysis 114
I.4.2.1.2. Yield and Physicochemical Properties 116
I.4.2.2. TWE Agars 117
I.4.2.2.1. Structural Analysis 117
I.4.2.2.2. Yield and Physicochemical Properties 117
I.4.3. Conclusions 120
FCUP
GENERAL INDEX
xxii
CHAPTER I.5. Influence of the Extraction Process on the Rheological and
Structural Properties of Agars – Case Study 1
I.5.1. Physicochemical Properties of MAE and TWE Agars 126 I.5.2. AFM Studies of Low Concentration Agar Solutions 126 I.5.3. Rheological Studies of High Concentration Agar Solutions/Gels 131 I.5.4. CryoSEM Studies of Agar Gels 138 I.5.5. Conclusions 139 References. 140
CHAPTER I.6. Influence of MAE Conditions on the Behavior of Alkali-modified
Agars in Dilute and Concentrated Aqueous Media – Case Study 2
I.6.1. Dilute Regime Studies 143 I.6.1.1. Influence of Media Concentration 143 I.6.1.2. Influence of the Nature of Agar Chains 150 I.6.1.3. Comparison with Previous Studies 152 I.6.2. Concentrated Regime Studies 154 I.6.3. Conclusions 156 References. 157
PART II. Suitability of the Extracted Agars for the Fabrication of
Sustainable Materials
CHAPTER II.1. Literature Review
II.1.1. A factual truth: We need Plastics! 161 II.1.2. Drivers for Bioplastics 162 II.1.3. The Bioplastic Sector 163
FCUP
GENERAL INDEX
xxiii II.1.3.1. The Bioplastic Concept 164 II.1.3.2. Current Challenges 166 II.1.4. Seaweeds: a Potential Sustainable Resource for the Bioplastic Industry 168 II.1.5. Bioplastics from Seaweed Polysaccharides (SP) 168 II.1.5.1. Aqueous-blended Films 169 II.1.5.1.1. Edible Films for Food Applications 169
II.1.5.1.1.1. Agar and Locust Bean Gum (LBG) Synergistic Interactions 171
II.1.5.1.2. Production Methodologies 174 II.1.5.2. Mulch Films 175 II.1.6. Melt Processing 176 II.1.6.1. Biofillers for Melt-processed Biocomposite Films 177 II.1.6.1.1. Seaweeds as Biofillers 178 II.1.6.1.2. Seaweed Polysaccharides (SP) as Biofillers 179 II.1.7. Fibers of Seaweed Polysaccharides (SP) 179 II.1.7.1. Electrospinning 180 II.1.7.1.1. Choice of Solvent 181 II.1.8. Evaluation of the Properties of Materials 183 References. 189
CHAPTER II.2. Materials and Methods
II.2.1. Chemicals 203 II.2.2. DES Preparation 203 II.2.3. Aqueous-blended Films of Agar/Locust Bean Gum (LBG) 203 II.2.3.1. Preparation of LBG Starting Solution 204 II.2.3.2. Preparation of Agar Starting Solutions 204 II.2.3.3. Preparation of Agar/LBG Mixtures 204
FCUP
GENERAL INDEX
xxiv II.2.3.4. Rheological Studies of the Film-forming Solutions 205 II.2.3.5. Films Fabrication 205 II.2.3.6. Films Characterization 206 II.2.3.6.1. Thickness Measurement 206 II.2.3.6.2. Mechanical Properties 206 II.2.3.6.3. Water Resistance 207 II.2.3.6.3.1. Water Sorption Isotherms 207 II.2.3.6.3.2. Water Vapor Permeability (WVP) 209 II.2.3.6.3.2.1. Basic Principles 209 II.2.3.6.3.2.2. Experimental Procedure 212 II.2.3.6.4. Scanning Electron Microscopy (SEM) 212 II.2.4. Agar/Locust Bean Gum (LBG) Hydrogels 212 II.2.4.1. Rheological Studies 213 II.2.4.2. Penetration Tests 213 II.2.4.3. CryoScanning Electron Microscopy (cryoSEM) 214 II.2.5. Non-aqueous Agar Films 214 II.2.5.1. Pre-solubilization of Agar in DES 214 II.2.5.2. Thermo-compression 214
II.2.5.3. Films Characterization 215 II.2.5.3.1. Scanning Electron Microscopy (SEM) 215
II.2.5.3.2. Thickness Measurement 215 II.2.4.3.3. Mechanical Properties 215 II.2.4.3.4. Sorption Isotherms 216 II.2.4.3.5. Contact Angle Measurements 216 II.2.5.3.6. Water Vapor Permeability (WVP) 216 II.2.6. Statistical Analysis 217
FCUP
GENERAL INDEX
xxv II.2.7. Fibers 217
II.2.7.1. Preparation of Agar/PVA Spinning Solutions 217 II.2.7.1.1. Water as Solvent 217 II.2.7.1.2. DES-U as Solvent 218 II.2.7.2. Rheological Measurements 218 II.2.7.3. Electrospinning 219 II.2.7.4. Scanning Electron Microscopy (SEM) 220 References. 220
CHAPTER II.3. Aqueous-blended Films of Agar/Locust Bean Gum
II.3.1. Rheological Characterization of the Film-forming Solutions 223 II.3.2. Films Preparation 234 II.3.3. Films Characterization 236 II.3.3.1. Films Appearance 236 II.3.3.2. Films Morphology 237 II.3.3.3. Mechanical Properties 238 II.3.3.4. Water Sorption Isotherms 241 II.3.3.5. Water Vapor Permeability (WVP) 244 II.3.4. Conclusions 246 References. 246
CHAPTER II.4. Agar/Locust Bean Gum Hydrogels
II.4.1. Characterization of Agar/Locust Bean Gum Hydrogels 250 II.4.1.1. Appearance and Microstructure 250 II.4.1.2. Rheological Studies 255 II.4.1.3. Penetration Tests 273
FCUP
GENERAL INDEX
xxvi II.4.2. Conclusions 276 References. 276
CHAPTER II.5. Non-aqueous Films
II.5.1. Preparation of Agar/DES Films 280 II.5.2. Films Characterization 280 II.5.2.1. Films Appearance 280 II.5.2.2. Films Morphology 281 II.5.2.3. Thickness and Mechanical Properties 283 II.5.2.4. Water Sorption Isotherms 285 II.5.2.5. Contact Angle Measurements 288 II.5.2.6. Water Vapor Permeability (WVP) 290 II.5.3. Conclusions 291 References. 292
CHAPTER II.6. Agar Fibers
II.6.1. Solubilization of the Polymers 295
II.6.1.1. In Water 295 II.6.1.2. In DES-U 295
II.6.2. Rheological Properties of the Spinning Solutions 296 II.6.2.1. Water as Solvent 296 II.6.2.2. DES-U as Solvent 299 II.6.3. Electrospinning 306 II.6.3.1. Production of Agar fibers Using Water as Solvent 306 II.6.3.2. Production of Agar Fibers using DES-U 311 II.6.4. Conclusions 322
FCUP
GENERAL INDEX
xxvii References. 322
Final Conclusions & Remarks
FCUP LIST OF FIGURES xxviii
List of Figures
PART I
Chapter I.1
Chapter I.2
Fig. I.2.1 – Schematic representation of the experimental steps followed during the
preparation of Gracilaria vermiculophylla samples (1) and subsequent MAE of NA (7-11) and AA (2-10, 12). Images identified with numbers are mentioned throughout the text.
44
Fig. I.2.2 – Pressure (1) and temperature (2) probes placed in the control vessel
and connected to the MAE apparatus.
45
Fig. I.2.3 – Magnetic shielding (Source: Cabrita, 2010). 47 Fig. I.2.4 – General NMR spectrometer scheme (adapted from ‘High resolution
NMR techniques in organic chemistry’, 2nd
Ed, Elsevier, 2009).
48
Fig. I.2.5 – Schematic representation of FTIR basic operating principles. 50 Fig. I.2.6 – Schematic representation of a general SEC equipment. 54 Fig. I.2.7 – Schematic representation of a general AFM setup. Illustration of the
different type of interactions established between the tip and the surface of the
56
Fig. I.1.1 – Agar structure. 8
Fig. I.1.2 – Proposed model for agarose network formation considering intensive
interhelical association (Source: Clark & Ross-Murphy, 1987).
10
Fig. I.1.3 – Schematic representation of IMTA approach (image gently provided by
Algaplus: www.algaplus.pt).
15
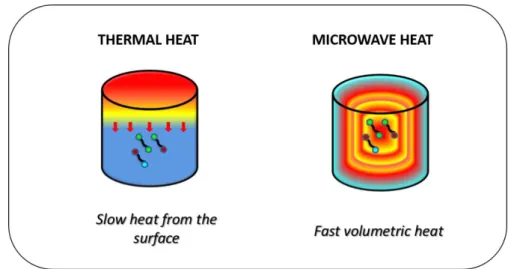
Fig. I.1.4 - Conversion of L6S in LA units during the alkaline treatment. 17 Fig. I.1.5 – Schematic representation of the mechanisms underlying microwave
and thermal heats.
25
Fig. I.1.6 – Schematic representation of a microwave extractor for large production
(image gently provided by Atlanta Chemical Engineering L.L.C.: http://www.atlantachemical.com/).
FCUP
LIST OF FIGURES
xxix sample is also provided (Adapted from Borges, 2012 and Morris, 2010).
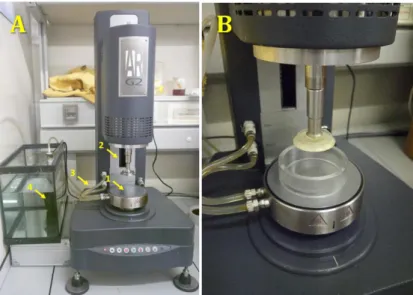
Fig. I.2.8 – Stress-controlled rheometer (ARG2, TA Instruments, USA) with: A) an
attached cone-and-plate geometry (identified by 2). Also indicated are the Peltier plate (1), the soft plastic tubes for water circulation (3) and the small water pump (4); B) an attached parallel plate geometry with radial grooves to avoid slippage.
63
Fig. I.2.9 – Schematic representation of the cone-and-plate (A) and parallel plate
(B) measuring systems.
63
Fig. I.2.10 – Ideal sinusoidal responses of completely elastic (solid), completely
viscous (fluid) or viscoelastic systems to sinusoidal oscillatory shear strain (solid curves) and/or shear stress (dashed curves) (source: (Sittikijyothin, 2006)).
65
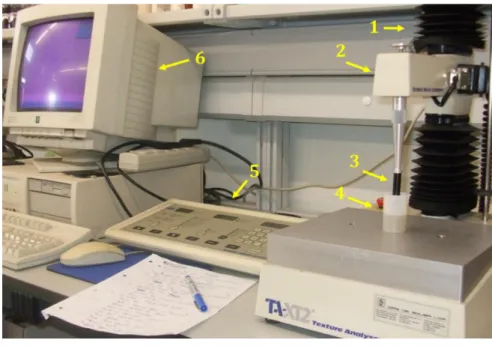
Fig. I.2.11 – General texture analyzer setup. Main components are identified by
numbers (1- arm, 2 – loadcell, 3- probe, 4- gel sample, 5- control panel, 6- computer).
70
Fig. I.2.12 – Examples of probes and grips used to carry out texture analysis (A-
mini Otawa/Kraemer cell; B- cylinder used for agar gels; C- tensile grips used for packaging films). The choice of the probe depends on the sample and property intended to determine.
71
Fig. I.2.13 – Schematic representation of a basic scanning electron microscopy
(SEM) equipment. Main components are identified accordingly. Abbreviations used: SE - secondary electrons detector; EDS – energy dispersive X ray spectroscopy; EBSD – electron backscatter diffraction detector; V- scanning control; SC- Signal conditioning.
73
Fig. I.2.14 – General scanning electron microscopy (SEM) setup (image gently
provided by CEMUP, Porto, Portugal). Main components are identified by numbers (1- N2 gas injector, 2 – EDS detector, 3- SE detector, 4- sample chamber, 5-
electron column, 6- BSE detector, 7- computer).
73
Fig. I.2.15 – Cryo scanning electron microscopy (cryoSEM) setup. The inset figure
highlights the cryo preparation chamber (image gently provided by CEMUP, Porto, Portugal).
74
Chapter I.3
Fig. I.3.1 - Response surface of MAE yield (Y1; %) of AA from IMTA
G.vermiculophylla as a function of temperature (X2) and stirring speed (X4)
(extraction time (X1) = 15 minutes, solvent volume (X3) = 30 ml).
83
FCUP
LIST OF FIGURES
xxx obtained by MAE as a function of extraction time (X1) and temperature (X2) (solvent
volume (X3) = 30 ml, stirring speed (X4) = medium).
Fig. I.3.3 - Response surface of gelling temperature, Tg (Y3; °C) of AA from
G.vermiculophylla obtained by MAE as a function of extraction time (X1) and stirring
speed (X4) (temperature (X2) = 80 °C, solvent volume (X3) = 30 ml.
86
Fig. I.3.4 - Response surface of melting temperature, Tm (Y4; °C) of AA from
G.vermiculophylla obtained by MAE as a function of extraction time (X1) and stirring
speed (X4) (temperature (X2) = 80 °C, solvent volume (X3) = 30 ml).
88
Fig. I.3.5 - Response surface of MAE yield (Y1; %) of NA from IMTA
G.vermiculophylla as a function of temperature (X2; °C) and stirring speed (X4)
(extraction time (X1; min) = 15 minutes and solvent volume (X3; mL) = 40 mL).
94
Fig. I.3.6 - Response surface of gel strength, GS (Y2; g/cm2) of MAE NA from
G.vermiculophylla as a function of extraction time (X1; min) and temperature (X2;
°C) (solvent volume (X3) = 40 mL and stirring speed (X4) = medium).
95
Chapter I.4
Fig. I.4.1- HSQC spectra of NA_IMTA_MAEopt (A), NA_IMTA_TWEopt (B) and NA_IMTA_MAE1 (C). Outside the plots are the corresponding 1D NMR spectra of each nucleus (13C on the left and 1H on top). Other minor components resolved in individual spectra are presented in the text.
105, 106
Fig. I.4.2 - FTIR spectra of NA_IMTA_TWEopt (a), NA_IMTA_MAEopt (b) and NA_IMTA_MAE1 (c). CA was used as reference (d). Bands assigned to total sugar content (C-H; 2920 cm-1 (1)) and respective shoulder of CH3 (2845 cm-1 (2)), total
sulfate (1370 cm-1 (3) and 1250 (4)), LA (930 cm-1 (5)), sulfate at 4-position in G units (845 cm-1 (6), weak signal) are marked accordingly.
108
Fig. I.4.3 - HSQC spectrum of AA_IMTA_MAE_Yopt. Outside the plots are the corresponding 1D NMR spectra of each nucleus (13C on the left and 1H on top).
112
Fig. I.4.4 - 1H NMR spectra (400 MHz) of NA_Wild_MAEopt (a) and AA_Wild_MAE_GSopt (b) samples in D2O (data obtained at 80 °C with the following
conditions: 5.11 s acquisition time, 1.0 s relaxation delay, a spectral width of 6400 Hz and an average of 16 scans). The alkaline modification minimizes the peak of the C1 of the L6S residues. The region of the methylated segments, LA2M and G6M, is identified in the marked inset.
FCUP
LIST OF FIGURES
xxxi
Chapter I.5
Fig. I.5.1 - Representative topographic (A, and C) and equivalent amplitude (B,
and D) AFM images obtained in tapping mode for 0.05% wt ca. 500 µg mL-1 aqueous solutions of AA_Wild_MAE_GSopt (A, and B) and AA_Wild_TWEopt (C, and D), prepared by the ‘slow cooling’ method, deposited onto freshly cleaved mica after being cooled to room temperature. The image size is 5 µm × 5 µm. The curves below the images represent the height profile along the white line drawn in the images. Arrows indicate local aggregates.
128
Fig. I.5.2 - Representative topographic (A, and C) and equivalent amplitude (B,
and D) AFM images obtained in tapping mode for a 0.05% wt ca. 500 µg mL-1 aqueous solutions of AA_Wild_MAE_GSopt (A, and B) and AA_Wild_TWEopt (C, and D). The samples were deposited onto freshly cleaved mica after diluting while hot a 1.5% wt agar solution (‘rapid cooling’ method). The image size is 5 µm × 5 µm. The curves below the images represent the height profile along the white line drawn in the images. Arrows indicate local aggregates.
130
Fig. I.5.3 - Temperature dependence of elastic (G'; filled symbols) and viscous
(G''; open symbols) moduli of 1.5 % wt agar sols/gels during cooling ramp from 80 to 25 °C (AA_Wild_MAE_GSopt (squares) and AA_Wild_TWEopt (triangles)). Inset
figure: Temperature dependence of the loss tangent of 1.5 % wt agar sols/gels
during cooling ramp from 80 to 25 °C (AA_Wild_MAE_GSopt (open squares), AA_Wild_TWEopt (open triangles) and CA (open circles)). The measurements were recorded at 6.28 rad/s and 1% strain amplitude.
132
Fig. I.5.4 - Time evolution of elastic (G'; filled symbols) and viscous (G''; open
symbols) moduli at 25 °C of 1.5 % wt agar gels recorded at 6.28 rad/s and 1% strain amplitude (AA_Wild_MAE_GSopt (squares), AA_Wild_TWE_GSopt (triangles) and CA (circles)).
134
Fig. I.5.5 - Frequency dependence at 25 °C of elastic (G'; filled symbols) and
viscous (G''; open symbols) moduli of 1.5 % wt gels of: A) AA_Wild_TWEopt (triangles), AA_Wild_MAE_GSopt (squares) and CA (circles) B)
AA_Wild_MAE_GSopt (squares) as well as the complex viscosity, (open squares with cross). The solid line represents G''(ω) recalculated from G'(ω) data using the Tschoegl approximation (Eq.I.2.4). All measurements were recorded at 6.28 rad/s and 1% strain amplitude.
134,135
Fig. I.5.6 - Temperature dependence of elastic (G'; filled symbols) and viscous
(G''; open symbols) moduli of 1.5 % wt agar gels/sols during heating ramp from 25
FCUP
LIST OF FIGURES
xxxii to 95 °C (AA_Wild_MAE_GSopt (squares) and AA_Wild_TWEopt (triangles)). Inset
Figure: Temperature dependence of the loss tangent of 1.5 % wt agar gels/sols
during heating ramp from 25 to 95 °C (AA_Wild_MAE_GSopt (open squares), AA_Wild_TWEopt (open triangles) and CA (open circles)). The measurements were recorded at 6.28 rad/s and 1% strain amplitude.
Fig. I.5.7 - Representative cryoSEM pictures obtained for 1.5% wt
AA_Wild_MAE_GSopt (A) and AA_Wild_TWEopt (B) gels at 2000 x, and 10 000 x (inset figure). The accelerating voltage was 15 kV and working-distances 15 m.
138
Chapter I.6
Fig. I.6.1 - Topographical (A,C,E,G) and equivalent amplitude (B,D,F,H) AFM
images of NA_Wild_MAEopt structures formed on the 5 (A-B), 10 (C-D), 50 (E-F) and 100 (G-H) μg/mL dilute aqueous solutions when deposited onto mica and air dried. The image size is 5 μm × 5 μm. Examples of NA_Wild_MAEopt aggregates
(1), local networks (2), cyclic structures (3), individual fibers (4) and branching (5) are identified by numbered arrows.
144
Fig. I.6.2 - Topographical (A,C,E,G) and equivalent amplitude (B,D,F,H) AFM
images of AA1 structures formed on the 5 (A-B), 10 (C-D), 50 (E-F) and 100 (G-H) μg/mL dilute aqueous solutions when deposited onto mica and air dried. The image size is 5 μm × 5 μm. Examples of AA_Wild_MAE_Yopt
aggregates (1) are identified accordingly.
146
Fig. I.6.3 - Topographical (A,C,E,G) and equivalent amplitude (B,D,F,H) AFM
images of AA_Wild_MAE_GSopt structures formed on the 5 (A-B), 10 (C-D), 50
(E-F) and 100 (G-H) μg/mL dilute aqueous solutions when deposited onto mica and
air dried. The image size is 5 μm × 5 μm. Example of AA_Wild_MAE_GSopt
aggregates (1), side-by-side aggregation (2) and partner switching with end association (3) of the fibers, cyclic structures (4) are identified accordingly.
148
Fig. I.6.4 - Enlarged scanning size (3 μm × 3 μm) of the topographical (A) and
equivalent amplitude (B) AFM images of AA_Wild_MAE_GSopt for the 10 μg/mL solution displayed in Figs. I.6.3-C/D.
150
Fig. I.6.5 - Enlarged scanning size (3 μm × 3 μm) of topographical (A,C,E) and
equivalent amplitude (B,D,F) AFM images of NA_Wild_MAEopt (A-B), AA_Wild_MAE_Yopt (C-D) and AA_Wild_MAE_GSopt (E-F) for the 5 μg/mL polymer concentration. The curves below the images represent the height profile along the white line drawn in the images.
FCUP
LIST OF FIGURES
xxxiii
Fig. I.6.6 - Large deformation profiles of NA_Wild_MAEopt (squares) and AA (AA_Wild_MAE_Yopt triangles; AA_Wild_MAE_GSopt circles) gels recorded through penetration tests. The concentration of the hydrogels was 1.5 % wt. Insets: CryoSEM pictures of NA_Wild_MAEopt (A), AA_Wild_MAE_Yopt (B) and AA_Wild_MAE_GSopt (C) 1.5% wt hydrogels at 5000 x magnification. The accelerating voltage is 15 kV and working-distances 15 mm in all the cases. These profiles match the GS data listed in Chapter I.4, Table I.4.8, for the same samples.
154
PART II
Chapter II.1
Fig. II.1.1 – - ‘Mixed junction zone’ model proposed for synergistic gelation of LBG
and agar. This model assumes direct association between the unsubstituted chains of LBG and the LA fraction of intensively associated agar helices (Source: Morris, 1990).
173
Fig. II.1.2 – Fabrication of films by ‘knife-coating’ technique (i.e. casting with
spreader).
174
Fig. II.1.3 – Hydraulic press used to fabricate polymer films by
thermo-compression.
177
Fig. II.1.4 - Chemical structures of the choline chloride (halide salt) and urea (H
bond donor) used to prepare the DES ChCl/urea at 1:2 molar ratio.
183
Chapter II.2
Fig. II.2.1 - Device for measuring the thickness of the films. 206
Fig. II.2.2 - Scheme of the permeation process through a polymeric film (adapted
from Duncan, 2005).
209
Fig. II.2.3 - Schematic representation of the electrospinning setup (a- syringe
pump; b- tubeless spinneret; d- chamber with T control; e- power supply) when using: (left) water as solvent (c- drum collector); (right) the DES-U (c- coagulating bath).
FCUP
LIST OF FIGURES
xxxiv
Chapter II.3
Figure II.3.1 - Frequency dependence at 55 °C of elastic (G'; filled symbols) and
viscous (G''; open symbols) moduli of 1 % wt NA_IMTA_TWEopt/LBG solutions (0/100 (squares), 25/75 (triangles), 50/50 (circles)).
224
Figure II.3.2 - Frequency dependence at 55 °C of elastic (G'; filled symbols) and
viscous (G''; open symbols) moduli of 1 % wt AA_IMTA_TWEopt/LBG solutions (0/100 (squares), 25/75 (triangles), 50/50 (circles)).
225
Figure II.3.3 - Mechanical spectra at 55 °C for 25/75 agar/LBG mixtures
(NA_IMTA_TWEopt (squares), AA_IMTA_TWEopt (triangles)).
225
Fig. II.3.4 - Flow curves at 55 °C for NA_IMTA_TWEopt/LBG solutions (symbols: 0/100 (squares), 25/75 (triangles), 50/50 (circles), 75/25 (stars) and 100/0 (inverted triangles)).
226
Fig. II.3.5 - Flow curves at 55 °C for AA_IMTA_TWEopt/LBG solutions (symbols: 0/100 (squares), 25/75 (triangles), 50/50 (circles), 75/25 (stars) and 100/0 (inverted triangles)).
227
Fig. II.3.6 - Comparison between the flow curves at 55 °C of
NA_IMTA_TWEopt/LBG (filled symbols) and AA_IMTA_TWEopt/LBG (open symbols) solutions (symbols: 25/75 (triangles), 50/50 (circles), 75/25 (stars) and 100/0 (inverted triangles)). Data of the pure LBG solution (0/100) are represented with crosses. The red lines represent predictions of the Cross model (Eq. II.3.1).
229
Fig. II.3.7 – Magnitudes of experimental and predicted zero-shear rate viscosities
(ƞ0), at 55 °C, of NA_IMTA_TWEopt/LBG mixtures, at equal concentrations of each
polysaccharide (blue circles = predicted values with Eq. II.3.3, and orange squares = predicted values with Eq. II.3.4). The linear fittings for each set of data and the respective R2 are also indicated.
232
Fig. II.3.8 – Magnitudes of experimental and predicted zero-shear rate viscosities
(ƞ0), at 55 °C, of AA_IMTA_TWEopt/LBG mixtures, at equal concentrations of each
polysaccharide (blue circles = predicted values with Eq. II.3.3, and orange squares = predicted values with Eq. II.3.4). The linear fittings for each set of data and the respective R2 are also indicated.
233
Fig. II.3.9 - Combined plot of the magnitude of the complex viscosity,
(open squares, open circles), dynamic viscosity, (squares with crosses, black line) and apparent viscosity, (solid squares, red line) at 55 °C, according to the Cox-Merz rule for the: pure LBG solution (main graphic) and 50/50 NA_IMTA_TWEopt/LBG mixture (inset).
233
FCUP
LIST OF FIGURES
xxxv AA_IMTA_TWEopt (right)). It is evident the slightly yellowish coloration of the film
prepared with the non-treated agar. Photograph of the AA_IMTA_TWEopt/LBG (B) and NA_IMTA_TWEopt/LBG (C) films prepared at 25/75 mass ratio.
237
Fig. II.3.11 - Representative SEM pictures of the surface of agar/LBG films at
5000x magnification (A- commercial agar prepared at 1% wt concentration; B- pure AA_IMTA_TWEopt; C- 25/75 NA_IMTA_TWEopt/LBG; D- 25/75 AA_IMTA_TWEopt/LBG). Details of the films represented in images C and D are presented in respectively, E and F at higher magnification (10 000x). Arrows represent larger fibrous particles interpreted as being LBG chains. The accelerating voltage was 10 kV and working-distances 17.1 mm in all cases.
238
Fig. II.3.12 - Tensile strength (TS) of the AA_IMTA_TWEopt/LBG and NA_IMTA_TWEopt/LBG films.
240
Fig. II.3.13 – Young’s modulus (YM) of the AA_IMTA_TWEopt/LBG and NA_IMTA_TWEopt/LBG films.
240
Fig. II.3.14 - Elongation-at-break (EB) of AA_IMTA_TWEopt/LBG and NA_IMTA_TWEopt/LBG films.
241
Fig. II.3.15 - Experimental sorption data (i.e. equilibrium moisture content, Xe vs
water activity, aw; symbols) and respective fit (lines) using the GAB model (Eq.
II.2.1) for NA_ IMTA_TWEopt/LBG films (100/0 (inverted triangles), 75/25 (stars), 50/50 (circles), 25/75 (triangles) and 0/100 (squares).
242
Fig. II.3.16 - Experimental sorption data (i.e. equilibrium moisture content, Xe vs
water activity, aw; symbols) and respective fit (lines) using the GAB model (Eq.
II.2.1) for AA_ IMTA_TWEopt/LBG films (100/0 (inverted triangles), 75/25 (stars), 50/50 (circles), 25/75 (triangles) and 0/100 (squares).
243
Fig. II.3.17 - Water vapor permeability (WVP) of the NA_IMTA_TWEopt/LBG and AA_IMTA_TWEopt/LBG films.
245
Chapter II.4
Fig. II.4.1 - Image of AA_IMTA_TWEopt/LBG (a-d) and NA_IMTA_TWEopt/LBG gels (e-h). (From left to right: 100/0, 75/25, 50/50 and 25/75).
250
Fig. II.4.2 - Representative cryoSEM pictures obtained for 1% wt
NA_IMTA_TWEopt/LBG (100/0 – A; 50/50 – B), AA_IMTA_TWEopt/LBG (100/0 –
C; 50/50 - D) and the pure LBG (0/100 – E) systems at 5 000 x. The accelerating
voltage was 15 kV and working-distances 15 mm in all cases.
FCUP
LIST OF FIGURES
xxxvi
Fig. II.4.3 - Higher magnification (10 000 x) cryoSEM pictures obtained for 1% wt
NA_IMTA_TWEopt (A), AA_IMTA_TWEopt (B) and LBG (C) pure systems. The accelerating voltage was 15 kV and working-distances 15 mm in all cases.
254
Fig. II.4.4 - Representative cryoSEM pictures obtained for 1% wt
NA_IMTA_TWEopt/LBG (25/75 – A; 75/25 – B) and AA_IMTA_TWEopt/LBG (25/75 – C; 75/25 - D) systems at 2 000 x. The accelerating voltage was 15 kV and working-distances 15 mm in all cases.
254
Fig. II.4.5 - Temperature dependence of elastic (G'; filled symbols) and viscous
(G''; open symbols) moduli of 1 % wt NA_IMTA_TWEopt/LBG systems during cooling ramp from 80 to 25 °C (graphic A: 25/75 (squares), 100/0 (triangles);
graphic B: 50/50 (circles), 75/25 (stars)). The measurements were recorded in
the linear viscoelastic region at 6.28 rad/s.
257
Fig. II.4.6 - Temperature dependence of elastic (G'; filled symbols) and viscous
(G''; open symbols) moduli of 1 % wt AA_IMTA_TWEopt/LBG systems during cooling ramp from 80 to 25 °C (graphic A: 25/75 (squares), 100/0 (triangles);
graphic B: 50/50 (circles), 75/25 (stars)). The measurements were recorded in
the linear viscoelastic region at 6.28 rad/s.
258
Fig. II.4.7 - Time dependence of elastic (G'; filled symbols) and viscous (G''; open
symbols) moduli of 1 % wt agar/LBG systems at 25 °C (A - NA_IMTA_TWEopt 25/75 (squares) and 50/50 mixed gels (circles); B - AA_IMTA_TWEopt 25/75 (squares) and 50/50 mixed gels (circles)). The measurements were recorded in the linear viscoelastic region at 6.28 rad/s.
260
Fig. II.4.8 - Frequency dependence at 25 °C of elastic (G'; filled symbols) and
viscous (G''; open symbols) moduli of 1 % wt NA_IMTA_TWEopt/LBG systems (symbols: 100/0 (triangles), 50/50 (circles) and 25/75 (squares)). All measurements were recorded in the linear viscoelastic region of the samples.
261
Fig. II.4.9 - Frequency dependence at 25 °C of elastic (G'; filled symbols) and
viscous (G''; open symbols) moduli of 1 % wt AA_IMTA_TWEopt/LBG systems (symbols: 100/0 (triangles), 50/50 (circles) and 25/75 (squares)). All measurements were recorded in the linear viscoelastic region of the samples.
261
Fig. II.4.10 - Frequency dependence of the tan δ at 25 °C of: A) 1 % wt
NA_IMTA_TWEopt/LBG systems (symbols: 100/0 (triangles), 75/25 (stars), 50/50 (circles), 25/75 (squares) and 0/100 (crosses)); B) 1 % wt AA_IMTA_TWEopt/LBG systems (symbols: 100/0 (triangles), 75/25 (stars), 50/50 (circles), 25/75 (squares) and 0/100 (crosses)). All measurements were recorded in the linear viscoelastic region.
263