Development of a dynamic mechanical analysis with a vibrating beam method to determine the glass transition temperature (Tg) of adhesives
87
0
0
Texto
(2) ii.
(3) To my parents. iii.
(4) . Development of a dynamic mechanical analysis with a vibrating beam method to determine the glass transition temperature (Tg) of adhesives . Abstract. For most metals, the mechanical properties do not vary to a great extent from low to high temperatures. However the same is not true for polymers since the glass transition temperature, often abbreviated as Tg, is often not too far from room temperature or their expected use temperatures. Below Tg, polymers have a glass-like behaviour and above Tg they have a rubber-like behaviour. The most common methods used to determine Tg are thermal and thermo-mechanical analyses. In the dynamic mechanical thermal analysis (DMTA), the mechanical properties are measured as a function of the temperature. Well below and well above Tg (in cross-linked materials), the damping is often quite low. At Tg, there is a peak corresponding to the maximum energy dissipated hence the maximum damping. Therefore, if the damping peak can be measured as a function of temperature then Tg can be found. One method is to vibrate a constrained layer at resonance and to record the temperature and the amplitude. From the theory of forced vibration, the damping is proportional to the inverse of the amplitude. In other words, when the amplitude is at its minimum the damping is at its maximum. The exact value of the damping is not needed, but just the temperature at which it peaks. The objective here is to use a method based on that principle. An automatic device to maintain the constrained layer at resonance previously developed in the Department of Engineering of the University of Bristol, under supervision of Prof R. D. Adams, is tested, refined and if possible at a low cost. In this project, a new mould for specimen manufacture was produced. Also, an entirely new holder structure was designed, using special aluminium extrusions and accessories. The device was assembled and tested several times to obtain results and compare them with reliable sources, which allowed us to calibrate the device accurately. An epoxy adhesive XN1244, supplied by Nagase Chemtex® (Japan) and two epoxy adhesives, Araldite® 2011 and Araldite® AV 138M with hardener HV 998, supplied by Huntsman® Iberia (Spain) were used.. iv.
(5) Development of a dynamic mechanical analysis with a vibrating beam method to determine the glass transition temperature (Tg) of adhesives . . v.
(6) . Development of a dynamic mechanical analysis with a vibrating beam method to determine the glass transition temperature (Tg) of adhesives . Resumo. Para a maioria dos metais, as propriedades mecânicas não variam muito desde baixas até altas temperaturas. No entanto, o mesmo não acontece com os polímeros desde a temperatura de transição vítrea, abreviado como Tg, muitas vezes não estão muito longe da temperatura ambiente ou das temperaturas de utilização esperadas. Abaixo da Tg, os polímeros têm um comportamento tipo vidro e acima da Tg eles têm um comportamento tipo borracha. Os métodos mais usados para determinar a Tg são analises térmicas ou termo-mecânicas. Na análise mecânica dinâmica térmica (DMTA), as propriedades mecânicas são medidas em função da temperatura. Bem abaixo e bem acima da Tg, (para termoendurecíveis), o amortecimento é muitas vezes bastante baixo. Na Tg, existe um pico correspondente à máxima energia dissipada logo ao amortecimento máximo. Portanto, se o pico do amortecimento pode ser medido em função da temperatura, então pode-se obter a Tg. Um método consiste em vibrar uma amostra num provete em ressonância e registar a temperatura e a amplitude. A partir da teoria de vibração forçada, o amortecimento é proporcional ao inverso da amplitude. Por outras palavras, quando a amplitude se encontra no mínimo, o amortecimento encontra-se no máximo. O valor exato do amortecimento não é necessário, só a temperatura a que ocorre esse pico. O objectivo aqui é usar um método baseado neste princípio. Um dispositivo automático para manter uma amostra em ressonância anteriormente desenvolvido no Departamento de Engenharia da Universidade de Bristol, sob a orientação do Prof. R. D. Adams, é testado, melhorado e se possível a um baixo custo. Neste projeto, foi produzido um molde novo para fabricar espécimes. Além disso, foi concebida uma estrutura de suporte totalmente nova, usando-se extrusões de alumínio especial e acessórios. O dispositivo foi montado e testado várias vezes, para obter resultados e compará-los com fontes seguras, o que permitiu calibrar o dispositivo com precisão. Foi usado um adesivo epóxido XN1244, fornecido pela Nagase Chemtex® (Japão), e foram usados dois adesivos epóxidos, Araldite® 2011 e Araldite® AV 138M com o endurecedor HV 998, fornecidos pela Huntsman® Ibérica (Espanha).. vi.
(7) Development of a dynamic mechanical analysis with a vibrating beam method to determine the glass transition temperature (Tg) of adhesives . . vii.
(8) . Development of a dynamic mechanical analysis with a vibrating beam method to determine the glass transition temperature (Tg) of adhesives . Acknowledgements I would like to take this opportunity to express my sincere thanks to my supervisor Doctor Lucas F. M. Silva, to give me the opportunity to undertake this work, and to teach and help me along this thesis. Very special thanks to my co-supervisor Mr Eduardo Marques, for his guidance and support in all tasks done along this thesis and for his friendship. To my colleagues in the Adhesives Group especially Ricardo Carbas, Filipe Chaves, Mariana Banea and Ana Queirós for their friendship and help. To Prof Monteiro Baptista, who gave me the opportunity and helped me to choose this project. To Prof Francisco Vasques for the availability and very useful clarifications. To Prof Sebastião Feyo de Azevedo for allowing me to present my thesis in September 2012. To Dr António Mendes Lopes for his help with electronic devices. To Mr Joaquim Fonseca, Mr José Fernando, Mr Albino Calisto, Mr Pedro Falcão and Mr José Saldanha for their help. To my friends from INEGI, Pedro Mimoso, Rodolfo Rito, Tiago Guimarães and Bártolo Paiva for their friendship and help. To my friends, Adelino Alvelos, João Pedro Mota (Braga, for friends), Gabriel, Mascaranhas, Miguel Pereira, Nuno Andrade, Nuno TP Silva, Eduardo Leite, Jorge Santos, João Costa, Heitor Sá, Vítor Ferreira, Pedro Cruz and João Cruz for their friendship and support. To my uncle Lourenço and Rafael Tavares for their motivation. To my parent José Telha Tavares and Maria Natália Tavares, I am profoundly grateful for their understanding, support and encouragement, to my brother João Carlos Tavares Telha, to my sister in law Susana Afonso Telha†, to my nephew André Afonso Telha and to my niece Beatriz Afonso Telha for their friendship and understanding. viii.
(9) Development of a dynamic mechanical analysis with a vibrating beam method to determine the glass transition temperature (Tg) of adhesives . . Contents. Abstract ...................................................................................................................................... iv Resumo ...................................................................................................................................... vi Acknowledgements .................................................................................................................viii List of Acronyms ....................................................................................................................... xi List of Figures ...........................................................................................................................xii List of Tables ........................................................................................................................... xiv 1 Introduction ........................................................................................................................... 1 1.1 Introduction ...................................................................................................................... 1 1.2 Problem definition ............................................................................................................ 1 1.3 Aim of the study ............................................................................................................... 1 1.4 Thesis overview ................................................................................................................ 2 2 Literature review ................................................................................................................... 3 2.1 Glass transition temperature (Tg) ...................................................................................... 3 2.2 General methods used for measuring Tg ........................................................................... 5 2.2.1 Thermo mechanical analysis (TMA) ......................................................................... 5 2.2.2 Differential scanning calorimetry (DSC) .................................................................. 7 2.2.3 Dynamic mechanical thermal analysis (DMTA) ....................................................... 9 2.2.4 Comparison between different methods .................................................................. 11 3 Experimental details ............................................................................................................ 13 3.1 Description of the Tg apparatus ...................................................................................... 13 3.1.1 Feedback system ...................................................................................................... 16 3.1.2 Heating system ........................................................................................................ 18 3.1.3 Holder structure ....................................................................................................... 22 3.1.4 Coils ......................................................................................................................... 25 3.2 Adhesives tested ............................................................................................................. 29 3.3 Specimen preparation ..................................................................................................... 30 3.3.1 Specimen description ............................................................................................... 30 3.3.2 Mould for specimen manufacture ............................................................................ 33 3.3.3 Manufacture steps of the specimen ......................................................................... 36 ix.
(10) . Development of a dynamic mechanical analysis with a vibrating beam method to determine the glass transition temperature (Tg) of adhesives . 4 Results .................................................................................................................................. 42 5 Conclusions .......................................................................................................................... 46 6 Future works ....................................................................................................................... 47 References ............................................................................................................................... 48 Appendix ................................................................................................................................. 50 Appendix A: Mould for specimen manufacture drawings ................................................... 50 Appendix B: Technical information sheet of: ...................................................................... 56 Appendix B1: Araldite® 2020A/B (XW 396 / XW 397) from Huntsman® .................... 56 Appendix B2: Epoxy Resin XN1244 from Nagase Chemtex® ........................................ 62 Appendix B3: Araldite® 2011 from Huntsman® .............................................................. 64 Appendix B4: Araldite® AV 138M with Hardener HV 998 from Huntsman®................ 70 . x.
(11) Development of a dynamic mechanical analysis with a vibrating beam method to determine the glass transition temperature (Tg) of adhesives . . List of Acronyms. DEMec - Department of Mechanical Engineering DLTMA - Dynamic Load TMA DMA – Dynamic Mechanical Analysis DMTA – Dynamic Mechanical Thermal Analysis DSC – Differential Scanning Calorimetry FEUP – Faculty of Engineering of the University of Porto IDMEC – Institute of Mechanical Engineering INEGI – Institute of Mechanical Engineering and Industrial Management MDSC - Modulated Differential Scanning Calorimetry MIEM - Integrated Master in Mechanical Engineering SMPT - Materials and Technological Processes Group TA - Thermal Analysis TMA – Thermal Mechanical Analysis. xi.
(12) . Development of a dynamic mechanical analysis with a vibrating beam method to determine the glass transition temperature (Tg) of adhesives . List of Figures Figure 1 - Plot of the variation of dynamic modulus, E*, and damping, η, with respect to the temperature of an amorphous polymer (Zhang, 2008) .............................................................. 4 Figure 2 – Schematic diagram of a vertical TMA instrument (Menczel and Prime, 2009)....... 5 Figure 3 – Schematic representation of a TMA curve in expansion (Lobo and Bonilla, 2002) 6 Figure 4 – Schematic graph shows the determination of Tg from a plot of specific heat capacity versus temperature (Zhang, 2008) ............................................................................... 7 Figure 5 – Cross-section of a Du Pont (now TA Instruments) DSC heat flux cell .................... 8 Figure 6 - Schematic of a DMA operation (Perkin Elmer Instruments) .................................... 9 Figure 7 - Curves E', E'' and tan δ of a DMA of an epoxy system (Li et al, 2000) .................. 10 Figure 8 - Damping versus temperature for a polymeric material (Koh, 2000) ...................... 13 Figure 9 – Working principle of the Tg apparatus, a) Maximum positive polarity of the coils, b) Neutral polarity of the coils, c) Maximum negative polarity of the coils............................ 14 Figure 10 - Diagram of the feedback circuit to maintain resonance ........................................ 16 Figure 11 - Feedback box......................................................................................................... 17 Figure 12 – Epoxy adhesive Araldite® AV119 damping in the heating and cooling process by using a hot air gun (Zhang, 2008) ............................................................................................ 18 Figure 13 - Portable oven (Zhang, 2008) ................................................................................. 19 Figure 14 - Entire heating system ............................................................................................ 20 Figure 15 – Coils, coils supports and magnets of the cast specimen out of the portable oven 20 Figure 16 - Araldite® AV119 damping of the heating and cooling process by using a portable oven (Zhang, 2008) .................................................................................................................. 21 Figure 17 – First holder structure approach ............................................................................. 22 Figure 18 – 3D drawing holder structure with a pair of specimens ......................................... 23 Figure 19 – Holder structure made with Minitec company components ................................. 23 Figure 20 – Entire Tg apparatus................................................................................................ 24 Figure 21 - Magnet slot ............................................................................................................ 25 Figure 22 - Coil ........................................................................................................................ 25 Figure 23 - Exploded view of the final mould for coil manufacture. ...................................... 25 Figure 24 - Electronic scale ..................................................................................................... 26 Figure 25 - Mixing machine..................................................................................................... 26 Figure 26 - Coil mould components in a ventilated place/area................................................ 27 Figure 27 - Mould assembled................................................................................................... 27 Figure 28 – Coil with 0.5 mm diameter coated cooper wire and the mould completely disassembled ............................................................................................................................ 27 Figure 29 – Coil ....................................................................................................................... 28 Figure 30 - Dynamic mechanical analysis results for the epoxy adhesive XN1244 (Banea et al, 2011) ........................................................................................................................................ 29 Figure 31 - Schematic 3D colour representation of the cast specimen .................................... 30 Figure 32 - Effect of the length of the epoxy resin adhesive on the damping properties (Koh, 2000) ........................................................................................................................................ 31 Figure 33 - Dummy specimen used to measure temperature ................................................... 31 xii.
(13) Development of a dynamic mechanical analysis with a vibrating beam method to determine the glass transition temperature (Tg) of adhesives . . Figure 34 – Test specimen used to measure damping .............................................................. 32 Figure 35 - Specimen made with pre-cured adhesive (Zhang, 2008) ....................................... 32 Figure 36 - Schematic representation of the mould for specimen manufacture (Zhang, 2008)33 Figure 37 - Mould to produce the cast specimen (Zhang, 2008) .............................................. 33 Figure 38 - An exploded view of the mould for specimen manufacture with all the components ............................................................................................................................... 34 Figure 39 - Mould for specimen manufacture is easy to use and to handle even with thermal gloves ........................................................................................................................................ 35 Figure 40 - Work area zoom of the heated plates press with the mould .................................. 35 Figure 41 – Work area of the heated plates press ..................................................................... 35 Figure 42 - Schematic representation of the test specimen production .................................... 36 Figure 43 - Schematic closed mould with two test specimens ................................................. 37 Figure 44 – Schematic representation of the dummy specimen production............................. 37 Figure 45 - Schematic closed mould with the two dummy specimens .................................... 38 Figure 46 - Pair of set specimens.............................................................................................. 38 Figure 47 – Schematic closed mould with a complete set of specimens .................................. 38 Figure 48 - The mould disassembled ........................................................................................ 39 Figure 49 - Removal of the dummy specimen, a) Step 1, b) Step 2, c) Step 3......................... 41 Figure 50 - Dynamic mechanical test results, Amplitude versus Temperature for the epoxy adhesive XN1244 ..................................................................................................................... 42 Figure 51 – Dynamic mechanical test results, Damping versus Temperature for the epoxy adhesive XN1244 ..................................................................................................................... 42 Figure 52 - Dynamic mechanical test results, Amplitude versus Temperature for the epoxy adhesive Araldite® 2011 ........................................................................................................... 43 Figure 53 – Dynamic mechanical test results, Damping versus Temperature for the epoxy adhesive Araldite® 2011 ........................................................................................................... 43 Figure 54 - Dynamic mechanical test results, Amplitude versus Temperature for the epoxy adhesive Araldite® AV 138M with HV 998 ............................................................................. 44 Figure 55 – Dynamic mechanical test results, Damping versus Temperature for the epoxy adhesive Araldite® AV 138M with HV 998 ............................................................................. 44 Figure 56 - Drawing of the plate 1 ........................................................................................... 50 Figure 57 - Drawing of the plate 2 ........................................................................................... 51 Figure 58 - Drawing of the plate 3 ........................................................................................... 52 Figure 59 - Drawing of the thermocouple inserts ..................................................................... 53 Figure 60 - Drawing of the mould for specimen manufacture assembled................................ 54 Figure 61 - Drawing of the assembly set of the mould ............................................................ 55 . xiii.
(14) . Development of a dynamic mechanical analysis with a vibrating beam method to determine the glass transition temperature (Tg) of adhesives . List of Tables. Table 1 - Effect of the type of measuring on the value of Tg (Konarski, 1999)....................... 11 Table 2 - Most significant differences between coils .............................................................. 28 Table 3- Glass transition temperatures measured for each specimen ...................................... 44 . xiv.
(15) Development of a dynamic mechanical analysis with a vibrating beam method to determine the glass transition temperature (Tg) of adhesives . . 1 Introduction. 1.1 Introduction. For most metals, mechanical properties do not vary to a great extent from low to high temperatures. But this is not true for a variety of materials such as polymers (which includes the material studied in this thesis, adhesives) since the glass transition temperature, often abbreviated as Tg, is often not too far from room temperature or their expected use temperatures. Below Tg, adhesives have a glass-like behaviour and above Tg they have a rubber-like behaviour. This principle is important to the knowledge of the properties of the materials, fundamental to all engineering design (Rubinstein and Colby, 2003).. 1.2 Problem definition. The existing devices for measuring Tg are usually expensive and complex. Additionally they have long work cycles, which might over cure the adhesive or dry a previously wet adhesive. The in-house device proposed in this work is faster to use and less complex. This device allows us to determine the Tg with accuracy, is relatively fast and also economic, when compared to the general methods used for measuring Tg.. 1.3 Aim of the study. This research aims to develop a reliable device based on previous works from the University of Bristol. The main objectives of this study are: • • • • • •. Develop an existing device based on the one developed at the University of Bristol, Ensure that it is a low cost and functional device, Establish a reliable and simple procedure to obtain data, Develop a stiff and adjustable specimen holder structure, Select appropriate specimen specifications, geometry and, Develop moulds to produce specimens and coils.. 1.
(16) . Development of a dynamic mechanical analysis with a vibrating beam method to determine the glass transition temperature (Tg) of adhesives . 1.4 Thesis overview. The structure of the thesis is summarised below: This work is divided into seven chapters that describe in detail the theoretical and experimental work developed. The first chapter introduces the dissertation subject and presents the main objectives of this work.. Chapter 2 (Literature review) describes the theory about Tg and the general methods used for measuring it, such as: • • •. Thermal mechanical analysis (TMA), Differential scanning calorimetry (DSC) and, Dynamic mechanical thermal analysis (DMTA).. Chapter 3 (Experimental details) describes the apparatus used for measuring Tg, more specifically: • • • • •. The whole system in general, The feedback system, The heating system, The holder structure and, The coils, moulds and specimens manufacture.. Chapter 4 (Results) describes the experimental results achieved with this work and compares them with those obtained using other techniques.. Chapter 5 (Conclusions) summarises the main conclusions from research of this thesis.. Chapter 6 (Future works) provides some suggestions for future works and improvements.. 2.
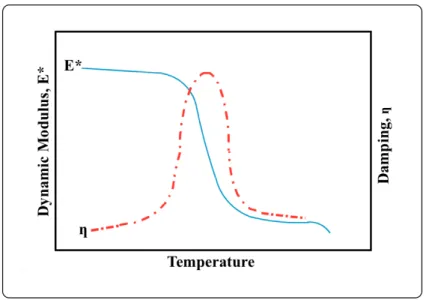
(17) Development of a dynamic mechanical analysis with a vibrating beam method to determine the glass transition temperature (Tg) of adhesives . . 2 Literature review. As this work describes a novel method for measuring the glass transition temperature of a polymeric material, it is important to first explain the definition of Tg and to describe the main methods currently used for its determination, such as; thermal mechanical analysis (TMA), differential scanning calorimetry (DSC) and dynamic mechanical thermal analysis (DMTA) (Menczel and Prime, 2009).. 2.1 Glass transition temperature (Tg). A very important property of polymeric materials is the glass transition temperature, often abbreviated as Tg, a single parameter that determines the application of many non-crystalline polymers (Mark et al, 1993). At low temperatures, a polymeric material is stiff and vitreous while at higher temperatures it becomes softer and rubbery. The Tg is the temperature at which there is a clear transition between these two behaviours. As adhesives are polymeric materials, it is fundamental to know their Tg so that it is possible to predict how an adhesive joint will react within a certain temperature range. Polymers used as adhesives have an amorphous or semi-crystalline structure. This means that there is significant degree of randomness in the distribution of the polymeric chains. The movement of the atoms in these chains is the underlying factor for the existence of the Tg. Below the Tg there is a lack of rotational and translational movement of the atoms that compose the polymeric chain. They are frozen in position and this translates into a stiff adhesive that cannot withstand large deformations. Above Tg there is more freedom for this molecular movements to occur, which leads to increased flexibility and deformation capability on the adhesive. The most common theory that explains the existence of this change in behaviour as a function of temperature is the free volume theory. This theory explains that as the polymer volume expands or contracts (due to the temperature changes) more or less free volume is available for the molecular chains to move. It is known that when the polymeric materials suffer a volumetric expansion of approximately 2.5%, the chains become considerably more mobile, which leads to a transition into a rubbery behaviour. Due to the complex structure of the amorphous materials, the glass transition temperature is not a single exact temperature but a small range of temperatures in which there is a noticeable change of properties. ASTM E1142-07 standard defines it as the temperature chosen to represent the range of temperatures in which the transition occurs (Reis, 2012).. 3.
(18) . Development of a dynamic mechanical analysis with a vibrating beam method to determine the glass transition temperature (Tg) of adhesives . The Tg of a material can be determined by studying the variation of certain parameters with temperature. The modulus of elasticity, damping, specific volume and enthalpy all suffer noticeable changes around the Tg value (see Figure 1).. Figure 1 - Plot of the variation of dynamic modulus, E*, and damping, η, with respect to the temperature of an amorphous polymer (Zhang, 2008). Various experimental methods study the variation of these fundamental properties to pinpoint the range of temperatures where there is a significant change of behaviour. This allows the precise identification of a Tg value. The methods most commonly used for this purpose are presented in the following section.. 4.
(19) Development of a dynamic mechanical analysis with a vibrating beam method to determine the glass transition temperature (Tg) of adhesives . . 2.2 General methods used for measuring Tg. In this section, the different techniques to measure Tg are described: • • •. The thermal mechanical analysis (TMA), The differential scanning calorimetry (DSC) and, The dynamic mechanical thermal analysis (DMTA).. 2.2.1 Thermo mechanical analysis (TMA). The TMA method directly measures the expansion of a sample when heated. Figure 2 shows a diagram of the equipment used in this method. There is an abrupt expansion during the change of the polymer state from vitreous to rubber, which permits measuring Tg.. Figure 2 – Schematic diagram of a vertical TMA instrument (Menczel and Prime, 2009). The two major fields of TMA application in polymers are the determination of the thermal expansion coefficient and the measurement of Tg. Sometimes the melting point (Tm) of semi crystalline polymers is also measured using this method.. 5.
(20) . Development of a dynamic mechanical analysis with a vibrating beam method to determine the glass transition temperature (Tg) of adhesives . These quantities can be measured only once in TMA, as shown schematically in Figure 3. As mentioned above, the glass transition temperature is determined as the point of intersection of the curves of glass and expansion phases of rubber (or fusion) (Menczel and Prime, 2009).. Figure 3 – Schematic representation of a TMA curve in expansion (Lobo and Bonilla, 2002). Sometimes a particular dynamic loading is used to study the elastic behaviour of materials. The name given to this variant is the DLTMA (Dynamic Load TMA). The scope of the TMA technique covers a variety of materials such as plastics, composites, ceramics and adhesives. The method is also applicable to the determination of properties such as, for example, the coefficient of thermal expansion, Tg and softening temperature. However, it is a method that has a high dependence on sample preparation and poor repeatability (da Silva et al, 2007).. 6.
(21) Development of a dynamic mechanical analysis with a vibrating beam method to determine the glass transition temperature (Tg) of adhesives . . 2.2.2 Differential scanning calorimetry (DSC). The DSC is a technique, which is part of a group of techniques called thermal analysis (TA). The TA is based upon the detection of changes in the heat content (enthalpy) or the specific heat of a sample with temperature. As thermal energy is supplied to the sample, its enthalpy increases and its temperature rises by an amount determined, for a given energy input, by the specific heat of the sample. The specific heat of a material changes slowly with temperature in a particular physical state, but alters discontinuously at a change of state. As the sample temperature increase, the supply of thermal energy may induce a physical or chemical process in the sample, e.g. melting or decomposition, accompanied by a change in enthalpy, latent heat of fusion, heat of reaction etc. Such enthalpy changes may be detected by thermal analysis and related to the process occurring in the sample. The measuring principle of DSC is to compare the rate of heat flow of the sample to an inert material that are heated or cooled at the same rate (Holubová et al, 2005). The changes in the sample are associated with absorption of heat. By comparing the heat absorption of the sample with that of the inert material, a differential heat flow is measured. The heat flow curves have a peak, where the area under the peak is directly proportional to the enthalpy change and its direction indicates the thermal event is an endothermic process. The analysis of a DSC thermogram enables to determine two important parameters, the transition temperature peak (Tg) and the enthalpy (Friedli, 1996). Figure 4 shows a temperature versus heat flow graph, which can be used to identify Tg as described above.. Figure 4 – Schematic graph shows the determination of Tg from a plot of specific heat capacity versus temperature (Zhang, 2008). The equipment used for this type of measurement consists in a metal disk, which connects a sample and a reference with low heat flow resistance (see Figure 5). This connection is placed inside a heating device. The enthalpy or heat capacity of the sample when experiencing changes causes a differential temperature measured against a reference sample (Höhne et al, 2003). This is then registered and is related to the change in enthalpy in the sample by an experimental calibration system (Zhang, 2008). 7.
(22) . Development of a dynamic mechanical analysis with a vibrating beam method to determine the glass transition temperature (Tg) of adhesives . Figure 5 – Cross-section of a Du Pont (now TA Instruments) DSC heat flux cell. This system has some advantages such as the easy preparation of the samples, because it makes use of small samples and is an automated procedure (Rodriguez et al, 2003), applied to solids and liquids, and covers a wide range of temperatures. Besides being able to obtain the glass transition temperature it can also collect information on other properties, for example, melting and boiling point, crystallization temperature and time, percentage of purity degree and rate of curing, heat capacity and specific heat, etc. The most important disadvantages and concerns are the results are susceptible to systematic errors based on incorrect calibrations by poor packaging and preparation of samples or by an inappropriate reference.. 8.
(23) Development of a dynamic mechanical analysis with a vibrating beam method to determine the glass transition temperature (Tg) of adhesives . . 2.2.3 Dynamic mechanical thermal analysis (DMTA). The dynamic mechanical (thermal) analysis, often abbreviated as DMA or DMTA (Rodriguez et al, 2003) is another method commonly used to measure the Tg of polymeric materials. The DMTA apparatus measures the changes in mechanical behaviour of any material as a function of temperature, frequency, time, stress or combinations of these parameters over the temperature range of -150 ºC to +500 ºC with experimental scanning rates of 0.1 to 5 ºC/minute for heating and cooling. This is a sensitive technique, especially for determining Tg, which give rise to a pronounced maximum damping in a dynamic mechanical experiment. The DMTA analysis gives accurate information on stiffness, cure, ageing, melting behaviour, stress/strain, and mechanical hysteresis. The analyser is used to obtain information regarding the structural properties of materials, product and materials development, process optimisation, quality control and production process support. The range of materials that can be studied includes polymers (including both thermoplastics and thermosets), elastomers, adhesives, optical materials and metals ranging from solid bars to coatings, films and fibres (Odlyha, 1997). A typical DMA device with grips to hold the sample and an environmental chamber to provide different temperatures is shown in Figure 6. The mounted sample is an environmental chamber and can slide to and encompasses the sample.. Figure 6 - Schematic of a DMA operation (Perkin Elmer Instruments). The polymer viscoelastic property is evaluated by dynamic mechanical analysis, where a sinusoidal force (tension σ) is applied to a material and the resulting displacement (strain) is measured (Fried, 2003). For a perfectly elastic solid, the resulting stress and deformation will be perfectly in phase. For a purely viscous fluid, there is a phase delay δ of 90 degrees with respect to the deflection voltage. Polymers have viscoelastic characteristics where the phase delays δ will occur during the DMA testing.. 9.
(24) . Development of a dynamic mechanical analysis with a vibrating beam method to determine the glass transition temperature (Tg) of adhesives . The storage modulus measures the stored energy, which represents the elastic portion, and the loss modulus measures the energy dissipated as heat, representing the viscous portion (Menczel and Prime, 2009). Figure 7 shows a graph with curves obtained by DMA of an epoxy adhesive. The curves are. tan δ, the storage modulus, E' and loss modulus, E'', as a function of temperature. The glass transition point (and the corresponding Tg) is observed at the inflection point of E', the maximum peak of E'' and tan δ, as shown in Figure 7.. Figure 7 - Curves E', E'' and tan δ of a DMA of an epoxy system (Li et al, 2000). For highly cross-linked polymers, the Tg region is wide and the test depends on parameters such as the frequency of the test and heating rate. By this technique, the Tg range extends from the point of inflection of the curve E' to the temperature of tan δ peak. According to Li et al (2000), the standard recommended for reporting Tg is the temperature of the temperature peak of E''. Although DMTA is as powerful as DSC for measuring Tg, it is time-consuming. Moreover, the method may change the curing state of the specimen or dry samples that are initially wet.. 10.
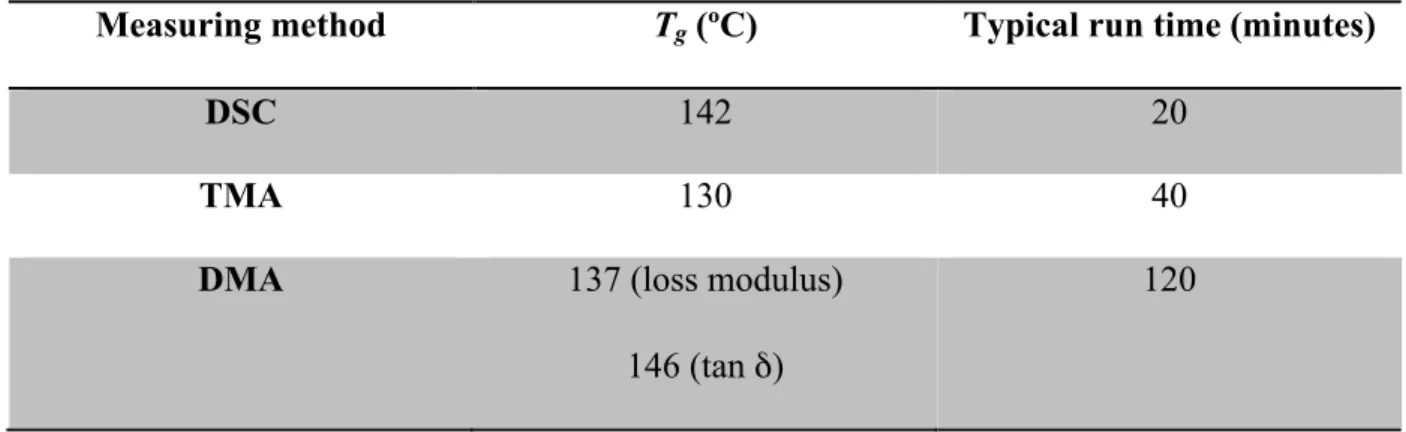
(25) Development of a dynamic mechanical analysis with a vibrating beam method to determine the glass transition temperature (Tg) of adhesives . . 2.2.4 Comparison between different methods. As mentioned above, there are various methods for measuring the glass transition temperature. The first method used to determine the glass transition temperature is the DSC, which detects the change in heat capacity. Later came the MDSC (Modulated Differential Scanning Calorimetry), which increased the sensitivity and resolution of thermal events. Although less used, TMA, DMA (or DMTA) are more sensitive methods. The TMA method measures the volumetric expansion of a specimen during heating. By analysing the expansion versus temperature curve, transition temperatures can be identified by changes in the curve slope. The DMA is a thermal analysis that is designed to identify modes of oscillation, oscillation frequency, frequency of resonance voltage and creep. It directly measures frequency, stress, strain, time, temperature and phase angles. The DMTA is a thermal analysis in fixedfrequency mode, which measures time, frequency, temperature and rigidity. Both techniques measure the loss modulus and storage temperature. Each method has its advantages and limitations. Depending on the method, the measured values for the glass transition temperature can have differences.. The study of an epoxy with DMA showed that the Tg value of the epoxy resins based on tan δ peak is influenced significantly by the frequency at which the test takes place (Li et al, 2000). Moreover, the value of Tg is more consistent using the peak of loss modulus. However, if the tests are performed at high heating rates, the Tg tends to be higher. Konarski (1999) studied the effect of measuring instruments in the Tg of samples cured at 145 ºC for 2 hours. Table 1 shows the glass transition temperature measured by different methods, DMA, DSC and TMA. This study supports the fact that Tg varies as a function of the measuring device, in this case Tg varies from 130 until 146 °C.. Table 1 - Effect of the type of measuring on the value of Tg (Konarski, 1999). Measuring method. Tg (ºC). Typical run time (minutes). DSC. 142. 20. TMA. 130. 40. DMA. 137 (loss modulus). 120. 146 (tan δ). 11.
(26) . Development of a dynamic mechanical analysis with a vibrating beam method to determine the glass transition temperature (Tg) of adhesives . The DSC test is the most simple and rapid to measure Tg. The method requires extremely small samples (usually 5-20 mg), which do not require special preparation. Unfortunately, this quick and convenient method is not universally applicable to all materials. High load, high crosslink density, and other processes may mask the displacement due to Tg and make the transition difficult or impossible to identify. This technique becomes costly because of using considerable quantities of liquid nitrogen for each test to obtain the cooling of the sample. The TMA analysis consists in simply heating the sample and measuring its dimensional change with a probe. This method also achieves relaxation of the stresses around the glass transition region, which sometimes leads to ambiguity in assigning a specific Tg and can measure a different value for the same sample if measured at a different point. The measured Tg, for instance, can vary when measured near the edge or at the centre of the sample. The DMA is a technique, which consists on measuring the oscillation energy of bending applied to a cured sample. The stress in the sample is measured versus temperature. The method is highly accurate, but Tg may be defined in different ways, which will have different values.. 12.
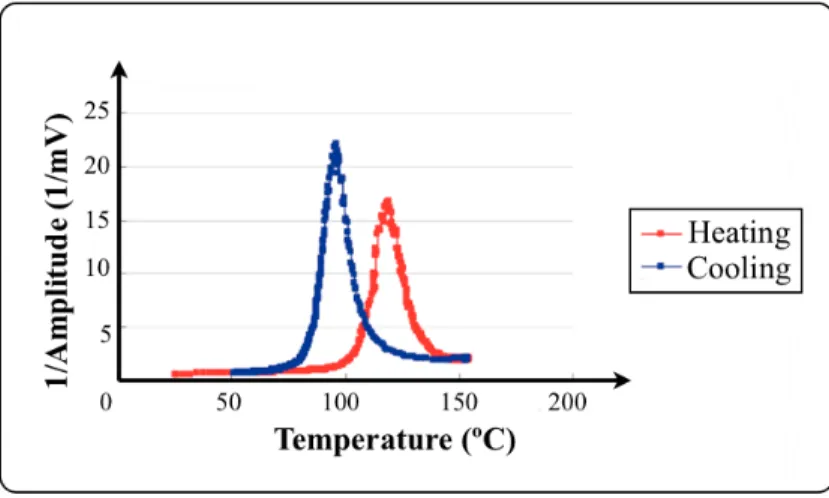
(27) Development of a dynamic mechanical analysis with a vibrating beam method to determine the glass transition temperature (Tg) of adhesives . . 3 Experimental details. The apparatus used in this work measures damping changes of a specimen as a function of temperature. To that purpose, a specimen with adhesive is made to vibrate as much as possible while its temperature changes. At the glass transition temperature, the damping is at its maximum, as shown in Figure 8.. Figure 8 - Damping versus temperature for a polymeric material (Koh, 2000). By identifying this damping peak and the temperature at which it occurs we can accurately determine the glass transition temperature of a polymeric material.. 3.1 Description of the Tg apparatus. As explained before, the Tg of polymeric materials has a large importance in its damping characteristics. As a material reaches the Tg, the damping properties will change significantly. The device developed during this thesis subjects a thin layer of adhesive to a constant and cycling oscillation. This oscillation movement is achieved with a pair of coils and magnets. The adhesive layer is mounted on an aluminium beam with a magnet bolted in each extremity. A coil is placed underneath each magnet. A variable electric current passes trough the coils. When the current is at its highest intensity (positive signal) the coils attract the magnets, see Figure 9a. When the coils do not have intensity the magnets go back to their original positions, see Figure 9b, and when the current is at its lowest intensity (negative signal) the coils push the magnets, see Figure 9c. If the current is changed cyclically as shown previously, the beam and the adhesive layer are subjected to oscillatory movements. 13.
(28) . Development of a dynamic mechanical analysis with a vibrating beam method to determine the glass transition temperature (Tg) of adhesives . Figure 9 depicts the changing polarity of the coils and the effect it has in the movement of the specimen (and consequentially, the stress in the adhesive layer, (bold black arrows). Figure 9a shows a situation where there is attraction between the beam magnets and the coils. This produces a large traction stress in the adhesive layer. Figure 9c, shows the opposite situation, where the adhesive layer is compressed.. (a). (b). (c). Figure 9 – Working principle of the Tg apparatus, a) Maximum positive polarity of the coils, b) Neutral polarity of the coils, c) Maximum negative polarity of the coils. 14.
(29) Development of a dynamic mechanical analysis with a vibrating beam method to determine the glass transition temperature (Tg) of adhesives . . If the temperature of the specimen is gradually changed while the oscillation movement occurs, there will be a temperature value where there is a significant increase of damping. This means that the Tg is achieved and the adhesive has started to have a rubber like behaviour, resisting the movement. If this sudden increase in damping is detected, the temperature at which it occurs will be the Tg. The temperature of the specimen is measured with another specimen, located very close to the test specimen. This dummy specimen has a thermocouple lead embedded in the adhesive layer. If the thermocouple lead were installed in the real specimen, it would change the behaviour of the specimen during the test and could hide the damping changes caused by the glass transition. To have good results, the amplitude of movement of the specimen should be as large as possible. The maximum amplitude of vibration occurs when the specimen is forced to vibrate at its resonance frequency. This creates a problem during the heating phase, as the resonance frequency changes with the temperature and if the frequency of the current applied to the coils is significantly different from the resonance frequency the specimen might stop to vibrate. To ensure that the specimen is always vibrating, a feedback system is required. This system is explained in the following section.. 15.
(30) . Development of a dynamic mechanical analysis with a vibrating beam method to determine the glass transition temperature (Tg) of adhesives . 3.1.1 Feedback system. Figure 10 shows the diagram of the complete apparatus with the feedback circuit used to maintain resonance.. Figure 10 - Diagram of the feedback circuit to maintain resonance. During the initial operation of the device, the electronic system is configured to work in an open loop. A signal generator provides a cyclic wave at the resonance frequency of the specimen. This cyclic wave is amplified in a power amplifier and fed to the drive coil. This coil is responsible for the movement of the specimen. The resonance frequency is identified by gradually changing the frequency of the signal provided by the signal generator until the maximum amplitude of movement in the specimen is detected. In the other extremity of the specimen is the pickup coil. This coil converts the vertical movement of the magnet bolted to the specimen into a small electric current. This current is directly proportional to the amplitude of movement of the specimen. This can be used as a simple method to identify Tg. However, as the temperature changes, the resonance frequency of the specimen also changes and the frequency provided by the signal generator must be constantly changed to ensure that the specimen keeps vibrating. This is unwanted, as it requires constant human action until Tg is found. The accuracy is also not acceptable. 16.
(31) Development of a dynamic mechanical analysis with a vibrating beam method to determine the glass transition temperature (Tg) of adhesives . . To solve this problem, a device known as a feedback box (see Figure 11) was developed by Prof Adams at the University of Bristol. This system works in a closed loop, with feedback. This box reads the small current induced in the pickup coil, amplifies it and feeds it to the drive coil. The feedback box is configured to create a phase change in the signal so that the signal at both coils overlaps. This places the specimen at its resonance frequency, keeping it vibrating independently of the temperature changes.. Figure 11 - Feedback box. As shown in Figure 11, due to the electronic circuits used by the feedback box, the output signal has a square shape instead of the sinusoidal shape suitable to actuate the coils and magnets. To convert this square wave into a sinusoidal wave, a wave filter is inserted after the feedback box. This filter can be seen in the diagram shown in Figure 10. This feedback box also has an output called "DC level". This DC level output is an electric signal whose voltage is directly proportional to the amplitude of the specimen displacement. By using a data acquisition system to register the temperature and this DC level, Tg can be identified. An Instrunet i100B device, connected to a PC, was used as the data acquisition system. Data was registered in two voltage channels, one for the temperature and another for the amplitude. Data was acquired at a rate of 100 Hz, to allow the use of the digital filter provided by the Instrunet i100B. This filter reduced significantly the amount of noise in the final data.. 17.
(32) . Development of a dynamic mechanical analysis with a vibrating beam method to determine the glass transition temperature (Tg) of adhesives . 3.1.2 Heating system. One has to be very careful in choosing the correct heating method, especially when the purpose is to measure correctly Tg (Twiggs et al, 1989). This has to do with the fact that the most important single factor affecting the damping performance of any viscoelastic material, such as a polymer, is definitely the temperature (Koh, 2000). Two main approaches can be used for the heating system: • •. The fast method (with a hot air gun, but not used in this project) and, The slow method (with a portable oven, that has been offered to us by the University of Bristol), the only method used in this project.. The fast method (with a hot air gun). This method was initially developed by Koh (2000) and met the requirement of flash heating by using two 2000 W hot air guns, aimed to produce a concentrated airflow with a fishtail nozzle. The specimen was held firmly to a support to apply airflow on both surfaces of the specimen (the upper and the lower). It is possible to quickly raise the temperature and cool it down quickly to prevent it from curing. Some adhesives, which have very particular curing demands, must use this fast method or the glass transition temperature is greatly changed during the heating process. The main disadvantage is that it is hard to accurately maintain the specimen temperature, and there is a risk of overheating the specimen. This method can also alter the movement of the specimen. The airflow impacting the vibrating specimen can change the damping and slightly alter the results. A test with Araldite® AV119 epoxy adhesive (Huntsman®) is shown in Figure 12 where it can be seen that the Tg used in the heating and cooling cycle due to different temperature rates (Zhang, 2008).. Figure 12 – Epoxy adhesive Araldite® AV119 damping in the heating and cooling process by using a hot air gun (Zhang, 2008). 18.
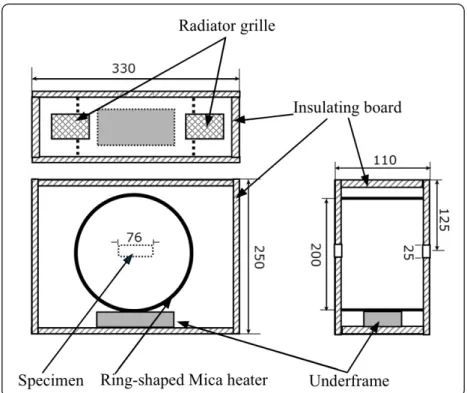
(33) Development of a dynamic mechanical analysis with a vibrating beam method to determine the glass transition temperature (Tg) of adhesives . . The slow method (with a portable oven). To solve the problems of the hot air gun, a small oven was designed at the University of Bristol, as shown in Figures 13 and 14 (Laurence, 2003).. Figure 13 - Portable oven (Zhang, 2008). This oven is built with a circular heating element encased in aluminium walls. The interior of these walls is insulated with boards of "super wool”; a material with extremely low thermal conductivity and that can withstand a maximum temperature of 1000 ºC. The heating source is a ring-shaped Mica heater with 200 mm in diameter and 400 W of power. The outer walls have a small passage in each side of the oven. The specimen passes trough these holes so that the central section, containing the adhesive, is located directly inside the ring shaped heating element (Figure 15).. 19.
(34) . Development of a dynamic mechanical analysis with a vibrating beam method to determine the glass transition temperature (Tg) of adhesives . To minimize temperature fluctuations, an oven controller was used with a thermostat (see Figure 14), which allows controlled heating from room temperature up to 200 ºC. A thermocouple located inside the oven provides the controller with the actual temperature and allows the continuous adjustment of the temperature.. Figure 14 - Entire heating system. Figure 15 – Coils, coils supports and magnets of the cast specimen out of the portable oven. 20.
(35) Development of a dynamic mechanical analysis with a vibrating beam method to determine the glass transition temperature (Tg) of adhesives . . The use of a portable oven (slow method) has the advantages of heating in an easy and controlled way the temperature of the specimen. Because the oven has a small work area that means it performs flash heating and does not over cure the specimen. A test with the Araldite® AV119 damping during heating and cooling process by using the portable oven (Zhang, 2008) is shown in Figure 16, where it can be seen that the Tg measured in the heating and cooling cycles now nearly coincide.. Figure 16 - Araldite® AV119 damping of the heating and cooling process by using a portable oven (Zhang, 2008). 21.
(36) . Development of a dynamic mechanical analysis with a vibrating beam method to determine the glass transition temperature (Tg) of adhesives . 3.1.3 Holder structure. The initial structure to hold the specimen is shown in Figure 17.. Figure 17 – First holder structure approach. While this minimalist holder structure fits our purpose, after some initial validation tests, it was decided to develop an improved holder structure. The new structure must be practical, stiff, easier to adjust and use and must have a low cost. For that purpose Minitec company components were used, such as aluminium profiles, screws, nuts and fastening elements among others. The resulting 3D drawing is shown in Figure 18.. 22.
(37) Development of a dynamic mechanical analysis with a vibrating beam method to determine the glass transition temperature (Tg) of adhesives . . Figure 18 – 3D drawing holder structure with a pair of specimens. This design allowed us to build a holder structure that is more robust and easier to adjust, see Figure 19.. Figure 19 – Holder structure made with Minitec company components. 23.
(38) . Development of a dynamic mechanical analysis with a vibrating beam method to determine the glass transition temperature (Tg) of adhesives . The final version of the apparatus, as installed in the laboratory, is shown in Figure 20.. Figure 20 – Entire Tg apparatus. 24.
(39) Development of a dynamic mechanical analysis with a vibrating beam method to determine the glass transition temperature (Tg) of adhesives . . 3.1.4 Coils. The aim of the coils is to transmit a magnetic force to the magnets (Figure 21), which are fastened to the specimen. The geometry of the coil used is shown in Figure 22.. Figure 22 - Coil Figure 21 - Magnet slot. The magnetic force of a coil with this geometry depends of the diameter of coated cooper wire, the number of turns per layer and the number of layers used to produce the coil. To produce coils easily and consistently, a mould was used for the manufacture, as shown in Figure 23.. Figure 23 - Exploded view of the final mould for coil manufacture.. 25.
(40) . Development of a dynamic mechanical analysis with a vibrating beam method to determine the glass transition temperature (Tg) of adhesives . To obtain coils with 1 mm of thickness (to fit in the magnet slot, see Figure 21) coated copper wire with 0.5 mm in diameter was used, with two turns per layer and with twelve layers.. A two components epoxy adhesive, Araldite® 2020 A/B resin and hardener (Huntsman®) was used to bond the copper wire for coils production. The complete data sheet for this adhesive can be found in Appendix B1.. The proportion of the resin and hardener was carefully weighed (2.5 g to 0.75 g respectively) in an electronic scale (Figure 24) then mixed at 1500 rpm for 1 minute and 30 seconds in a mixing machine, (Figure 25).. Figure 24 - Electronic scale. Figure 25 - Mixing machine. Each component of the mould was cleaned and degreased with acetone (the acetone was handled with care, in a ventilated place/area), as shown in Figure 26. The components were introduced into an oven for 10-15 minutes at 50 ºC to dry them, before application of the release agent.. 26.
(41) Development of a dynamic mechanical analysis with a vibrating beam method to determine the glass transition temperature (Tg) of adhesives . . Figure 26 - Coil mould components in a ventilated place/area. The coated copper wire with adhesive was then applied in 12 layers, as shown in Figure 27. The mould was heated in the oven for 30 minutes at 100 ºC to cure the adhesive and after that, the mould was removed from the oven, and disassembled to remove the coil, as shown in Figure 28.. Figure 27 - Mould assembled. Figure 28 – Coil with 0.5 mm diameter coated cooper wire and the mould completely disassembled. The results were not satisfactory with this coil approach because the magnetic force of the coils was too low, and did not allow us to read the Tg accurately. Therefore, the magnetic strength of the coil was improved by using 0.2 mm diameter coated cooper wire; this implies five turns to keep the 1 mm thickness per layer with 30 layers.. 27.
(42) . Development of a dynamic mechanical analysis with a vibrating beam method to determine the glass transition temperature (Tg) of adhesives . The new coil obtained is shown in Figure 29.. Figure 29 – Coil. Table 2 shows the most significant differences between the two coils.. Table 2 - Most significant differences between coils. Diameter of coated copper wire 0.5 mm 0.2 mm. 28. Number of turns per layer 2 5. Number of layers. Magnetic force. Conclusions. 12 30. Low High. Rejected Approved.
(43) Development of a dynamic mechanical analysis with a vibrating beam method to determine the glass transition temperature (Tg) of adhesives . . 3.2 Adhesives tested. Three epoxy adhesives were investigated in this study. The epoxy adhesive XN 1244 (see Appendix B2), supplied by Nagase Chemtex® (Japan), and two epoxy adhesives, Araldite® 2011 (see Appendix B3) and Araldite® AV 138M with hardener HV 998 (see Appendix B4), supplied by Huntsman® Iberia (Spain).. The value of Tg of XN 1244 adhesive was determined by Banea et al (2011), using a DMTA apparatus cured during 60 minutes at 140 ºC and a value off 155 ºC was obtained (Figure 30).. Figure 30 - Dynamic mechanical analysis results for the epoxy adhesive XN1244 (Banea et al, 2011). Araldite® 2011 glass transition temperature measured by DMTA and cured during 20 minutes at 100 ºC is approximately 63 ºC (manufacturer data). Araldite® AV 138M with hardener HV 998 glass transition temperature measured by DSC and cured during 4 hours at 60 ºC is approximately 85 ºC (manufacturer data). The cure of the adhesives studied in this work was performed with the same temperature and time, as those given above, so that comparison can be made.. 29.
(44) . Development of a dynamic mechanical analysis with a vibrating beam method to determine the glass transition temperature (Tg) of adhesives . 3.3 Specimen preparation. 3.3.1 Specimen description. The specimen preparation is extremely important. The adhesive is stored in containers (adhesive or resin and hardener) and before use, the adhesive with two components need proper mixing. The centrifuging technique was used to mix the adhesive in order to remove the air bubbles and to ensure a homogeneous mixture. The specimens are formed by the layers of the beam, adhesive and the sheet (referred also as top plate) and are adhered together using the adhesive to be tested, see Figure 31. The top plate is necessary to constrain the adhesive layer when the beam is flexing. This intensifies the stress on the adhesive layer, requiring less beam movement to create a given stress level in the adhesive.. Figure 31 - Schematic 3D colour representation of the cast specimen. The beams and sheets were made in aluminium alloy (2024) with dimensions 250 x 12.5 x 3 mm3 and 30 x 12.5 x 1 mm3, respectively. This material was chosen for its a high strength and low specific heat, which makes it suitable to make the beam specimen (de Matos, 2002). Moreover, aluminium has a low rigidity and low damping property (Zhang, 2008).. The adhesive has a similar dimension to the sheet (top plate) but with twice the thickness (2 mm).. 30.
(45) Development of a dynamic mechanical analysis with a vibrating beam method to determine the glass transition temperature (Tg) of adhesives . . The length of the adhesive chosen was 30 mm, based on the study of Koh (2000), as shown in Figure 32. The graph demonstrates that there are diminishing returns when the length of the adhesive layer is increased. An adhesive layer of 30 mm exhibits very similar performance to one with 40 mm; therefore there is no need to increase the adhesive layer length, especially as larger specimens will require bigger equipment to be manufactured.. Figure 32 - Effect of the length of the epoxy resin adhesive on the damping properties (Koh, 2000). Prior to producing the specimens, it is necessary to prepare the mould for specimen manufacture and the aluminium beam specimens. The preparation consists in applying release agent before the manufacturing of the specimens and to achieve accurate results, the mould and the supporting aluminium beams had to be well cleaned and degreased to remove all atmospheric corrosion and dust particles. A dummy specimen is used to measure the adhesive temperature. This dummy specimen has one thermocouple in the middle of the adhesive layer (to measure the temperature), but does not have any magnets (see Figure 33).. Figure 33 - Dummy specimen used to measure temperature. 31.
(46) . Development of a dynamic mechanical analysis with a vibrating beam method to determine the glass transition temperature (Tg) of adhesives . The specimen used to measure damping does not have any thermocouple, but instead has two magnets tightened with screws and nuts, one in each extremity of the aluminium beam (see Figure 34).. Figure 34 – Test specimen used to measure damping. The specimens used in this work were made using a mould to directly bond the adhesive layer to the metallic parts. However, an alternative method to produce the specimens is available. A piece of pre-cured adhesive can be fixed by a nut and bolt (Figure 35). For temperature measurement, thermocouples can be sandwiched between the layers of the specimen. This type of specimen construction allows a fast and economic way to produce specimens. This procedure was not used in this work, but can be used in the future with this apparatus to measure Tg. It is particularly useful for assessing the effect of environment on Tg as the adhesive sample can be easily removed from the sample and introduced in the environment to study (e.g. water).. Figure 35 - Specimen made with pre-cured adhesive (Zhang, 2008). 32.
(47) Development of a dynamic mechanical analysis with a vibrating beam method to determine the glass transition temperature (Tg) of adhesives . . 3.3.2 Mould for specimen manufacture. To produce the mould for specimen manufacture, a detailed study of the mould made by Zhang (2008) was firstly made, with the purpose to include some improvements wherever possible. This initial mould is shown in Figures 36 and 37.. Figure 36 - Schematic representation of the mould for specimen manufacture (Zhang, 2008). Figure 37 - Mould to produce the cast specimen (Zhang, 2008). 33.
(48) . Development of a dynamic mechanical analysis with a vibrating beam method to determine the glass transition temperature (Tg) of adhesives . The mould produced for this work uses the same general construction and working principle of the mould presented by Zhang (2008). However, some improvements were introduced to respect the following design guidelines: • • • • •. Low manufacturing and materials cost, Good compromise between durability and cost (a carbon steel DIN CK45 was used), Able to produce at least four specimens at once, Lightweight and, Easy to use and to handle.. These guidelines led us to some significant differences listed below: • • • •. Thicker plates to increase the robustness and stiffness, Deeper central plate to allow the production of thicker adhesive layers, Wider upper lid to function as handle and, Introduction of two inserts in the outer section to simplify the production of specimens with thermocouples.. These modifications can be seen in the following exploded view of the mould for specimen manufacture (Figure 38), which includes the name and quantities of all components (if more than one, in brackets). Appendix A contains the individual drawings of the mould parts.. Figure 38 - An exploded view of the mould for specimen manufacture with all the components. 34.
(49) Development of a dynamic mechanical analysis with a vibrating beam method to determine the glass transition temperature (Tg) of adhesives . . A very important factor is that the assembly of the mould for specimen manufacture is made from bottom to top. It begins with plate 3 and ends with plate 1. Four screws are needed to tighten all the components to close the mould. Plate 1 (plate that sits on top of the mould) is 20 mm longer per side than plate 2 and plate 3, allowing using it as two extra handles, as shown in Figure 39. The total weight is just 1.9kg, which makes it a relatively lightweight mould. This allows easily placing and removing the assembled mould into the heated plates press, as shown in Figure 40.. Figure 39 - Mould for specimen manufacture is easy to use and to handle even with thermal gloves. Figure 40 - Work area zoom of the heated plates press with the mould. The work area of the heated plates press is relatively high (about one meter and a half from the ground), as shown in Figure 41, explaining why the lightweight and the handles were so important in the design of the mould for specimen manufacture.. Figure 41 – Work area of the heated plates press. 35.
(50) . Development of a dynamic mechanical analysis with a vibrating beam method to determine the glass transition temperature (Tg) of adhesives . 3.3.3 Manufacture steps of the specimen. Figure 42 shows the assembly sequence used in the manufacture of the specimens. These are manufactured in the two central holes of the mould (plate 2), while the dummy specimens are manufactured in the two outer holes to allow access to the thermocouple wires.. Figure 42 - Schematic representation of the test specimen production. The specimen is built (see Figure 42) by inserting components sequentially into the mould holes: • • • •. 36. First, a feeler gauge tape (with 3.2 mm thickness) is inserted to ensure the correct thickness of the adhesive layer. The metallic top plate is then inserted and then covered with a sufficient amount of adhesive. The aluminium beam can then be placed above the adhesive and aligned in the slots provided for this purpose in plate 2 of the mould. Plate 1 is then placed over the specimens and the screws are tightened to plate 3, see Figure 43..
(51) Development of a dynamic mechanical analysis with a vibrating beam method to determine the glass transition temperature (Tg) of adhesives . . Figure 43 - Schematic closed mould with two test specimens. Figure 44 illustrates the assembly sequence of dummy specimens. As mentioned before, these are manufactured at the outer holes of the mould.. Figure 44 – Schematic representation of the dummy specimen production. The manufacture procedure for these dummy specimens is very similar to the one presented for the test specimens. However, it differs slightly as the thermocouple lead must be placed inside the uncured adhesive. To keep the thermocouple lead in position, one must also place the thermocouple insert, shown in green in Figure 44. This insert also avoids the escape of adhesive through the thermocouple hole. After the thermocouple is secured inside the adhesive layer, the procedure is again similar to the one described for the test specimen. 37.
(52) . Development of a dynamic mechanical analysis with a vibrating beam method to determine the glass transition temperature (Tg) of adhesives . The aluminium beam is placed over the adhesive layer and centred, and the mould is closed, see Figure 45.. Figure 45 - Schematic closed mould with the two dummy specimens. Figure 46 shows the complete set of specimens, ready to be tested and Figure 47 shows a schematic closed mould with an entire cast specimens set up: two pairs of specimens with thermocouples inserted (dummy specimens to allow measurement of the temperature) and two test specimens to be subjected to the actual resonance test for measuring the glass transition temperature.. Figure 47 – Schematic closed mould with a complete set of specimens Figure 46 - Pair of set specimens. Before the mould is used for specimen manufacture, some preparations are needed, such as: scraping the surface using an aluminium spatula (because the aluminium is softer than the CK45-steel of the mould it prevents possible damages on the mould during the cleaning procedure). This is necessary to remove some hard adhesive glued on the mould surface as well as cleaning other type of dust particles. The chemical cleaning procedure consists in cleaning and degreasing each component separately from the mould with acetone (handling the acetone with care, in a ventilated place/area). 38.
(53) Development of a dynamic mechanical analysis with a vibrating beam method to determine the glass transition temperature (Tg) of adhesives . . To be ready for use, the mould must be covered with mould release agent. To prepare for the application of this product, the mould first goes into the oven for 10-15 minutes at 50 ºC. The mould release agent cures faster at this temperature. The release agent was then applied in at least five layers. Between each application all the mould components were dried very well. Special care with the rectangular holes of the plate 2 is needed, because it is extremely important to easily remove the cast specimen from the mould. Special care is also needed with the two holes for the thermocouples, because this is a very problematic area. If there is not sufficient mould release agent in this area it is very hard to remove the thermocouples in good shape. To remove the dummy specimen two steps are needed. The first step is to remove the thermocouple, and the second step is to remove the dummy specimen. The test specimen can be removed in a single step. Thermal gloves are necessary to safely remove the mould from the heated plates press and place it on the table surface, where it rests during a couple of minutes to cool down. At this moment all the mould components can be disassembled as shown in Figure 48. This is always done with the mould at room temperature. . Figure 48 - The mould disassembled. . . . 39.
(54) . Development of a dynamic mechanical analysis with a vibrating beam method to determine the glass transition temperature (Tg) of adhesives . The next step is to remove the thermocouple, with the mould disassembled. Plate 2 is then turned down and placed over the plate 1 and plate 3, shown in Figure 49a. Using a piece of wire about 2 mm in diameter and a hammer, the thermocouple insert is removed, as identified in Figure 49b, with caution to avoid damage of the thermocouple wire. Plate 2 is then turned again, as shown in Figure 49c, and the thermocouple wire is finally removed. The removal of the cast specimen is only done in the last step. Using a hammer and a pin removal tool, impacts are applied in the rectangular hole of plate 2, directly in the cast specimen that is to be removed, see Figure 49c.. 40.
(55) Development of a dynamic mechanical analysis with a vibrating beam method to determine the glass transition temperature (Tg) of adhesives . . (a). (b). . (c). . Figure 49 - Removal of the dummy specimen, a) Step 1, b) Step 2, c) Step 3. 41.
(56) . Development of a dynamic mechanical analysis with a vibrating beam method to determine the glass transition temperature (Tg) of adhesives . 4 Results. The glass transition temperature was measured for two pairs of specimens for each adhesive using the dynamic mechanical test device described in section 3.1. Tg was measured during the heating and cooling stages, at heating and cooling rates of 16 and 8 ºC/min, respectively. Figures 50, 52 and 54 give curves of displacement amplitude (value inversely proportional to the damping of the adhesive) versus temperature for the heating and cooling cycles for each adhesive. Figures 51, 53 and 55 give curves of 1/(displacement amplitude) (value proportional to the damping of the adhesive) versus temperature for the heating and cooling cycles for each adhesive.. Figure 50 - Dynamic mechanical test results, Amplitude versus Temperature for the epoxy adhesive XN1244. Figure 51 – Dynamic mechanical test results, Damping versus Temperature for the epoxy adhesive XN1244. 42.
(57) Development of a dynamic mechanical analysis with a vibrating beam method to determine the glass transition temperature (Tg) of adhesives . . Figure 52 - Dynamic mechanical test results, Amplitude versus Temperature for the epoxy adhesive Araldite® 2011. Figure 53 – Dynamic mechanical test results, Damping versus Temperature for the epoxy adhesive Araldite® 2011. 43.
Imagem


+7


Documentos relacionados