1
PERFORMANCE ASSESSMENT OF PORTUGUESE SECONDARY
SCHOOLS: THE SOCIETY AND EDUCATIONAL AUTHORITIES
PERSPECTIVES
Maria C. Portela and Ana S. Camanho
Faculdade de Economia e Gestão, Universidade Católica Portuguesa, Portugal
and Faculdade de Engenharia da Universidade do Porto, Portugal
Abstract
This paper describes a performance assessment of Portuguese secondary schools using data envelopment analysis (DEA). The assessment adopts two perspectives: a society perspective where schools are viewed as promoting students achievement given student characteristics in terms of academic abilities and socio-economic background; and an educational authorities perspective where schools are viewed as transforming a set of resources (including student academic abilities, socio-economic background, and also school resources, such as teachers) into students' achievement. Two types of DEA analysis are performed for each perspective: one using an output oriented model allowing factor weights to vary freely from school to school and another using a model that restricts factor weights to be equal for all schools. The first model is well suited for identifying inefficient schools, whereas the latter is best suited for improving discrimination between efficient schools when pursuing the identification of benchmarks. Our sample comprised a small number of schools and therefore the results obtained are mainly illustrative of the potential of the method. Future research will explore the use of this method for the assessment of schools at a national level
Keywords
:
data envelopment analysis, single weights model, secondary schoolsIntroduction
In the majority of the European countries, the evaluation of schools is at the heart of the educational system as a means to guarantee the quality of education. For example, in the UK the Department for Education and Skills (DfES) publishes School and College Achievement and Attainment Tables, whereas in France, the Ministry of Education publishes three indicators of school performance. In Portugal, there is legislation since 2002 that establishes the self evaluation of schools compulsory and also contemplates the external evaluation. However, there is not yet a systematic procedure for evaluating schools in spite of several attempts that have been made to evaluate schools.
Worldwide, studies about the effectiveness of schools, about what makes a school good, about how to improve schools, or about the school effect on pupils' achievement are widespread. This paper intends to put forth a Data Envelopment Analysis (DEA) framework based on which schools can be evaluated on a comparative basis, which also takes into account the specificities of the Portuguese educational system and the data limitations of the Portuguese case. The schools' assessment considers two perspectives: a society perspective
2 and an educational authority’s perspective. In addition, two types of DEA models were used: an output oriented model allowing factor weights to vary freely from school to school and a new model, developed in this paper, which restricts factor weights to be equal for all schools. The first model is well suited for identifying inefficient schools, whereas the latter is best suited for identifying benchmark schools.
Some data issues are also addressed in this paper, in particular we make some considerations regarding the use of ratios or absolute values as inputs and outputs and issues regarding the treatment of missing data.
The remainder of this paper is organized as follows. Section two includes a brief review of the literature focusing on the general issues that have been addressed in the context of schools evaluation. Section 3 introduces the Portuguese education system and discusses the specification of the inputs and outputs for the assessment of secondary schools. Section 4 describes the DEA models used for school assessment and discusses data issues related to the treatment of missing data. Section 5 presents the results, and Section 6 concludes.
Performance evaluation in education
“Education is a service that transforms fixed quantities of inputs (that is, individuals) into individuals with different qualities” (Hanushek, 1986). This definition of education is thorough since it outlines a number of characteristics of the production process that takes place in schools. Namely, schools provide a service that has the usual characteristics of services like intangibility and heterogeneity, which hamper standardization, and the educational service is carried out on the actual pupil, who is at the same time an input and an output of the production process. These characteristics make the evaluation of schools a particularly difficult task. (Mancebón and Bandrés, 1999) described some other characteristics of the education process that should be carefully taken into account in the assessments of school efficiency: (i) the time dimension of the education process, as many components of this process are only revealed a few years after the students completed the education process at school; (ii) the cumulative nature of the education process, which makes it difficult to assign the students achievements to a given school, since they are influenced by previous years of education; and (iii) the importance of elements exogenous to the school, which also determine the success of the education process for each pupil. The uniqueness of the educational production process implies that a “significant effort must be made to filter out what is really provided by each school” (Mancebón and Bandrés, 1999, p. 133) so that it is possible to measure correctly school efficiency and value-added.
The above mentioned characteristics of the educational process raise several issues that complicate the evaluation of schools, in particular those related with the type of methodology that should be used to model the educational process, and those related with the type of variables that better capture differences between schools. We will detain ourselves in the latter issue since much has been said elsewhere concerning the advantages and disadvantages of different methodologies (see e.g. Mancebón and Bandrés, 1999; Worthington, 2001). The choice of variables for an educational assessment depends on the level of analysis. There are essentially three levels of analysis described in the literature: pupils, schools, and groups of schools (local educational authorities in the UK and school districts in the US). We will concentrate in this paper on the variables used in school efficiency studies, which is the focus of the empirical analysis.
3 The studies that use the school as the level of analysis have reached a generalised consensus about the variables that should be used in the assessments. On the input side, three groups of variables are usually considered: (i) those reflecting characteristics of pupils (like prior attainment, social-economic characteristics, etc.), (ii) those reflecting characteristics of the school (like number of teaching and non-teaching staff, expenditure per pupil, size of school, or class size), and (iii) those reflecting characteristics of teachers (like their salary, experience, or level of education). Outputs are in general related to results of students in standardized test scores, aggregated at the school level in various forms like the median (Bessent and Bessent, 1980), the mean (Muniz, 2002; Mizala et al., 2002), or the proportion of pupils achieving more than a certain grade (Bradley et al., 2001). Other relevant outputs also related to pupils' achievement are the number of approvals or success rates (Kirjavainen and Loikkanen, 1998; Muniz, 2002; Oliveira and Santos, 2005), attendance rate (Bradley et al., 2001; Arnold et al., 1996), number of graduates (Kirjavainen and Loikkanen, 1998), and percentage of students who do not drop out from school (Arnold et al., 1996).
The generalised use of standardized test scores as the main output of school evaluations is related with the availability of these variables and the non-availability of others reflecting equally important outcomes of schooling, such as pupils' attitudes, the type of employment they get when leaving school, the preparation they are offered at school for future jobs, or the quality of their daily lives whilst at school (Gray, 1981). In fact, schools have a number of goals and the achievement of basic cognitive skills is only one among many. In spite of the general agreement that pupils academic outcomes tell just a part of the story that goes on in schools, it is true that these are the only objectively measurable outcomes of schools. Empirical evidence is, however, “inconclusive about the strength of the link between test scores and subsequent achievement outside the schools” (Hanushek, 1986, p.1154). We believe that the use of test scores is especially problematic during compulsory or basic education. Pupils that decide to follow on secondary education in general wish to continue education at universities and for that purpose achieving good academic results is perceived as a main objective at this educational stage.
The Portuguese case
School evaluations in Portugal
The evaluation of school performance is still a recent reality in Portugal. A list of the attempts that have been made to evaluate schools in Portugal is presented in (Azevedo, 2005). From this list it is clear that most efforts have been related to promoting the self-evaluation of schools and only recently these efforts have been directed to the external evaluation of schools. In 2006 the ministry of education created a “working group for school evaluation” whose mission was to define models for self-evaluation and external evaluation of schools at all educational levels (pre-school, basic and secondary education). The outcome of this program led the General Inspectorate of Education (IGE) to initiate in 2007 external evaluations of 100 schools that voluntarily agreed to participate. The external evaluations followed the guidelines established by the working group, which are qualitative in nature in involve on-site visits for analysing several dimensions (e.g. organization and management of the school, leadership, auto-regulation capacity, and results at various levels). Each school visited receives a report mentioning the weaknesses and strengths of the school as seen by the IGE inspectors. These external evaluations are now being extended to all schools in the country. This is certainly a type of external evaluation that is valuable to schools, in particular
4 to guide them on self-evaluation efforts, but does not identify external comparators or benchmarks that could guide schools to have a better idea on how they are performing compared to other schools in the same conditions.
In addition to the program of schools' evaluation led by IGE, there is also a privately run program called “Assessment of Secondary Schools” (AVES). The program started in 2000 but it is not a nationwide program, since the participation of schools is voluntary (in 2008 the number of schools participating in this program was about 40). In AVES a number of tests (academic and non-academic) are given to students and data is collected and analysed at the student level. Since data is analysed at the student level, a number of school variables important to compare schools are not collected (such as variables relating to the teaching body of the school, or to school expenditures and infrastructures). The schools analysed in this paper are those participating in the AVES program, where school level data was collected to complement the pupil level analysis currently undertaken by AVES.
In parallel with these programs for evaluating schools, the results of national examinations taken at the end of secondary education are made available every year (they became public for the first time in Portugal in 2001). The press converts these results to school rankings, based on the average classification of students on a set of exams. Although these rankings are not a fair way of evaluating or comparing schools (since they simply order schools based on uncontextualised scores), they have an enormous impact on public opinion. A side effect of these rankings is the promotion of efforts to prepare secondary students for exams more than anything else. Although these rankings of schools have been criticized, more sophisticated procedures for comparing schools have been postponed due to the unavailability of the data required on schools and pupils at a national level.
Selection of inputs and outputs
In this paper we adopt two perspectives for the assessment of school performance. We called the first society perspective, which intends to be a perspective of external accountability to the society, i.e., if parents could choose the best school to foster the academic development of their children, which school would be considered the best? In this perspective schools are viewed as promoting students achievement (ideally including not only academic results but also interpersonal capacities) given the students characteristics in terms of academic abilities and socio-economic backgrounds. The second was called educational authority’s perspective, where school resources, other than pupil related, are also accounted for in the performance evaluation. In this perspective schools are viewed as transforming a set of resources (including students with given characteristics in terms of academic abilities and socio-economic backgrounds and also school resources, such as teachers) into students achievement. From this perspective schools with less resources are required less in terms of achievement than schools with more resources. Clearly this is different from the parents' perspective where school resources should not be accounted for.
There are in the literature previous distinctions between the types of assessments that can be used for schools. For example (Banker et al, 2004) distinguish between efficiency and effectiveness in schools. According to these authors, effectiveness corresponds to an assessment based on school outcomes, like test scores, whereas efficiency corresponds to an assessment based on outputs, such as number of full time students. Another classification can be found in (Mayston, 2003), who considers that efficiency is value for money (where school resources including expenditures are considered), and effectiveness is value added (where
5 these school resources are not accounted for). Our two perspectives can be considered comparable to the value added and value for money perspectives of (Mayston, 2003), although under our educational authority’s perspective school resources do not need to be necessarily expenditure related.
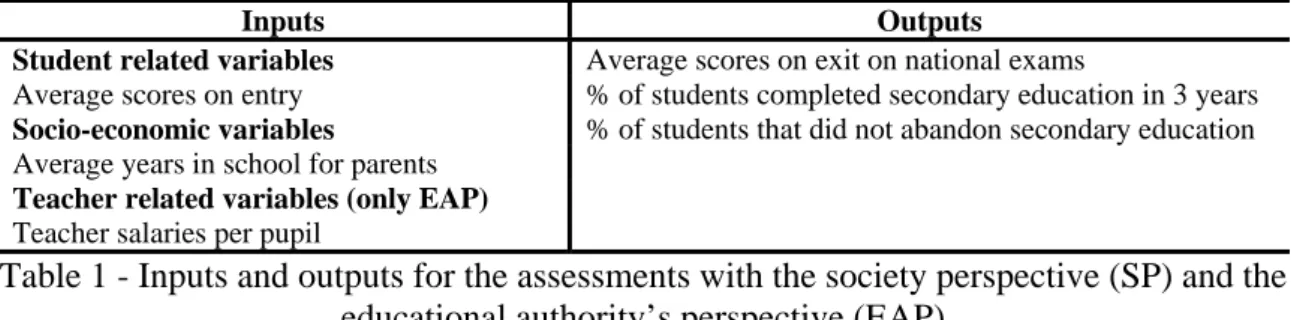
Table 1 summarizes the input and output variables used in the DEA model for both perspectives. The two inputs considered in the society perspective intend to reflect students' academic potential and the socio-cultural context of families. The educational authority’s perspective has a third input, reflecting teaching resources. The outputs reflect student academic achievements. Note that secondary education in Portugal happens for a period of 3 years (10th, 11th and 12th year of school education), so we collected data on this three-year period rather than on a single year. The students analyzed were those finishing secondary education in 2004/05, who started secondary education in the academic year 2002/03.
Inputs Outputs
Student related variables Average scores on exit on national exams
Average scores on entry % of students completed secondary education in 3 years
Socio-economic variables % of students that did not abandon secondary education
Average years in school for parents
Teacher related variables (only EAP)
Teacher salaries per pupil
Table 1 - Inputs and outputs for the assessments with the society perspective (SP) and the educational authority’s perspective (EAP)
The variable average scores on entry is measured by the average scores obtained by students on a number of subjects attended in the first trimester of the 10th year of secondary education. These scores were summed for all students that started secondary education in the school in 2002/03 (scores vary between 0 and 20). Ideally this variable should be defined by the scores in the national exams taken at the end of the previous educational cycle (basic education), but this variable was not available at the time of this study, as national exams at the end of the 9th year only started in the academic year 2005/06. The limitation regarding the input used in our model is that it is internal to the school, which may lead to indicators not homogenous for all schools. As a result, the schools that inflate their internal scores will be penalized in the assessment (i.e., in a comparison of two identical schools in terms of outputs and inputs except for internal classification in the 10th year, the school with inflated internal scores on entry will be classified in the DEA assessment as less efficient that the other school).
In order to reflect the socio-cultural background of pupils, we used the variable average number of years in school for parents. In considering this input we assume that parents with higher academic degrees can foster in their children motivation towards studying, leading to better academic achievements (Hanushek, 1986).
The third input is used for the education authority’s perspective only (together with the remaining inputs). This variable reflects the major running cost of schools. Teacher salaries are a function of the number of teachers and their position in the career. In relation to the number of teachers, schools with more staff can either have small class sizes or, in alternative, some teachers may be allocated to the promotion of extracurricular activities/projects, that are expected to have a positive impact on learning. In relation to the position in the career, which is also reflected in teacher salaries, high positions indicate that
6 teachers have good qualifications or experience. In order to maintain the consistency in the model variables, we used a ratio variable corresponding to the expenditure with teacher salaries per pupil.
The outputs (common to both perspectives) reflect the students academic achievements at the end of secondary education and success rates of students during secondary education.
The variable average scores on national exams at the end of secondary education is important because high marks in national exams enable pursuing tertiary education, which is the objective of many students attending secondary education. Note that the scores for each subject vary between 0 and 20. Ideally, we should have considered the data on national exams at the end of secondary education only for the cohort of students that entered the school in 2002/03. However, the database of results on national exams does not allow matching student data concerning previous educational stages. This led us to consider the average exam scores obtained by internal students attending a selection of subjects from general courses.
The variable percentage of students that successfully completed secondary education in three years is obtained by the ratio of the total number of students that obtained a secondary education diploma at the end of the academic year 2004/05, and the number of students that registered for the first time in secondary education in the academic year of 2002/03.
The variable percentage of students that did not abandon secondary education is the number of students that have not abandoned secondary education in the 10th year (2002/03) of secondary education, including both students from general and technological courses, divided by the number of students registered in the 10th year in the beginning of the academic year. This variable is measured only for the first year of secondary education because this corresponds to the stage with higher abandon rates, so this year was more effective to distinguish schools. Note that we used an isotonic output (i.e. number of students kept in school) instead of the non-isotonic output (i.e. number of students that abandoned school). Data description
The schools used in this study are those currently participating in the AVES project described before. We worked with about 40 schools and collected data using a questionnaire. Only 22 out of the 40 schools provided the school-level data required (other data was publicly available, like national exam scores, or was available through the AVES database) so this was the final set used in our assessment (The need to collect data through a questionnaire relates to the fact that in Portugal there are no databases with historical data on the performance of a student. Data on national exams are available per school and per student, but this database does not contain information regarding past achievement of students nor data regarding their socio-cultural background). From the overall set of schools, 12 were public and 10 were private schools. We assessed public and private schools together given our reduced set of schools. Even so we investigated differences between private and public schools for the variables to be used in the assessment. We found very similar values for all the variables except teacher salaries per pupil. We performed t-tests and non-parametric tests to check whether public and private school could be considered statistically different regarding the modeling variables. The results suggest that except for the input salaries per pupil, the differences between public and private schools are not statistically significant. This means that we can assume that both types of schools are run under the same technology.
7 The descriptive statistics for the input and output variables are reported in Table 2.
Input and output variables Mean St. Dev. Min Max
Average scores on entry 10.7 0.94 9.1 13.9 Average years in school for parents 10.9 1.47 9.4 15.5 Teacher salaries per pupil 2844.5 707.3 1866.7 4074.6 Average scores on exit 11.1 1.02 9.5 13.5 % students completing education in 3 years 38.5 11.5 21.9 58.8 % students that did not abandon school 89.5 9.0 62.9 100
Table 2 - Descriptive statistics of data
The set of schools in our sample is quite homogeneous, which can be seen in Table 2 from the low standard deviations compared to the means. Therefore we do not expect many differences in performance arising from such an homogeneous set of schools.
Model specification
DEA model
The DEA model used in this study is output oriented, since schools try to maximise pupil achievements given the existing resources.
Consider an input vector x=(x1,K,xm)∈R+m used to produce an output vector s s R y y, , )∈ + ( = 1 K
y in a technology involving n schools. Assuming Constant Returns to Scale (CRS), the efficiency assessment of a school o is obtained using the DEA model (1) (Charnes et al, 1978). 0} , , 1, = , , , 1, = , | { max 1 = 1 = ≥ ≤ ≥
∑
∑
j ij io j n j ro o rj j n j o λ y β y r s λ x x i m λ β K K (1)The optimal solution to model (1) provides the output efficiency score of unit o, given by *
1/βo. This efficiency score represents the percentage of outputs unit o is achieving of the maximum it could possibly achieve. So when 1/βo* equals one the unit is deemed efficient
and when it is lower than one the unit is deemed inefficient, meaning that the outputs should improve pro-rata by a factor of βo*.
The targets for the inputs and outputs of the unit under assessment can be obtained using the expressions (2), where λ is the optimal value of *j λj from model (1) .
r y y i x x j rj n j t ro ij j n j t io =
∑
, ∀ =∑
, ∀ * =1 * =1 λ λ (2)Note that ratio data is dimensionless and therefore it presumes CRS. However the ratios defined as inputs and outputs of our model have upper limits and therefore a CRS assumption allowing unlimited extrapolation of the DMUs observed is not coherent with this fact. Therefore, to be able to overcome this limitation of having variables with a natural upper limit, we used a DEA model with an additional constraint imposing
∑
=1 j ≤1n
8 corresponds to an assumption on non-increasing returns to scale (NIRS). This avoids the problem of obtaining unfeasible targets.
The DEA assessment was based on ratios, as it is easier to interpret their meaning in a school context. Nevertheless, it is of interest to note the equivalence between a formulation in terms of absolute values and in term of ratios. A DEA model defined with absolute values, equivalent to our ratio model with the variables reported in Table 1, would have an additional input corresponding to the number of students on entry. All other variables would also need to be expressed in absolute values, which would be accomplished by multiplying the original ratio variables by the input number of students on entry. With the variables measured in absolute values, the DEA CRS assessment would be equivalent to a DEA assessment with the variables defined in ratios (in this case, the input concerning the number of students on entry would be replaced by the NIRS restriction).
Missing values
The data set had a number of missing values that needed to be dealt with, since we did not want to exclude any school from the assessment. We used the approach of (Kuosmanen, 2002) to model missing values, which consists of replacing missing outputs by zero and missing inputs by a very large value.
By modeling missing data in this way one is in fact assuming that a DMU cannot weight the factors that are missing, and therefore its radial efficiency score is equal to that obtained from an assessment without considering the missing factors (see also Thanassoulis et al., 2007 for details). Note that if the missing variable corresponds to a dimension where the school is under-performing, then in an assessment without missing data the unit would choose not to weight the under-performing factor. Therefore, the efficiency score would be the same for an assessment with all data known or with the approach we propose for dealing with missing data. Conversely, if the missing variable corresponds to a dimension with good performance, then in an assessment without missing data the unit could choose to weight that factor and its efficiency could improve in relation to the assessment with missing data. Therefore, the assessment of a unit with missing values always implies a lower (or equal) efficiency score than the assessment with no missing values.
In our data set, the maximum number of missing values encountered per variable was 3 (for the variable percentage of students that finished secondary education in 3 years). The maximum number of missing variables per school was 2 and happened for school 37 and 26. The results obtained for these schools need to be interpreted with caution since in fact these schools are evaluated on a restricted set of variables.
Single weights model
One of the advantages of DEA is that the DMUs are given complete freedom in assigning weights to input and output vectors. This reinforces certainty about inefficiencies (since inefficient units could not find a weighting scheme that conveys a 100% efficiency score), but may raise doubts about efficiencies, since some units may appear efficient just because they neglected most inputs and/or outputs. In order to shed light on the performance of those units identified with 100% efficiency in the free weights model, we analyzed all the schools in the sample imposing restrictions on the weights. In particular we imposed all schools to be assessed in relation to the same weighting scheme. This weighting scheme was not defined a
9 priori (as usual in existing approaches that define a common set of weights like in (Roll et al. 1991 or Cook et al. 1991), but was determined by a DEA model developed in this paper for the purpose of assessing all DMUs with a common set of weights. The schools that are able to maintain their efficiency status under this restrictive assumption confirm their benchmark status.
In developing a model that used weights common to all schools we adapted the model of (Post and Spronk, 1999), which has the advantage of assessing all units with a single LP model, instead of requiring a specific LP model for each DMU, as illustrated in (3) . When the last set of constraints (3b) imposing equal weights for all DMUs are excluded, this model returns for every unit k=1,K the same efficiency score as that obtained using model (1). ,n The efficiency score of DMU k would be given by
ik ik m i rk rk s r x v y u 1 = 1 =
∑
∑
. } , 1, = , , 1, = 0, , ) (3 , , 1, = , = , , , 1, = , = ) (3 , , 1, = 1, = , 1, = , , 1, = 0, | { min 1 = 1 = 1 = 1 = 1 = m i s r v u b k s r u u k m i v v a n k y u n k n j x v y u x v i r r rk i ik rk rk s r ij ik m i rj rk s r ik ik m i n k K K K K K K K ≥ ∀ ∀ ≥ + −∑
∑
∑
∑
∑
(3)However, the imposition of constraints (3b) renders model (3) infeasible, but this problem can be overcome by imposing a single normalising constraint to replace the k constraints in (3a). This renders model (4) as a single weights model with a CRS assumption.
} , 1, = , , 1, = 0, , 1, = ) ( , 1, = 0, | ) ( { min 1 = 1 = 1 = 1 = 1 = 1 = m i s r v u y u n j x v y u x v i r rk n k r s r ij i m i rj r s r ik n k i m i K K K ≥ ≥ + −
∑
∑
∑
∑
∑
∑
(4)Model (4) has the particularity of using aggregate inputs and aggregate outputs in the assessment. Therefore, the objective function value provides an aggregate efficiency score for the group analysed. The efficiency of each DMU k can be computed as the ratio of the weighted sum of its outputs and the weighted sum of its inputs (
ik i m i rk r s r x v y u 1 = 1 =
∑
∑
). The issue of aggregation is closely linked with the issue of common weights or common prices (since weights are shadow prices or opportunity costs that are in general unknown to the researcher). Kuosmanen et al (2006) addressed this issue and used a model that is very similar to model (4), except that it is a cost efficiency model rather than a technical efficiency model.10
Analysis of the results
DEA results
Our sample of schools is very small, such that the discrimination of the DEA analysis is expected to be limited and the results must be interpreted with caution. The results reported intend to show the potentialities of the framework proposed and the type of results/conclusions that can be obtained.
The DEA results produced for both the authorities and society perspectives using model (1) with the additonal restriction imposing NIRS ( 1
1
= ≤
∑
j nj λ ) are reported in Table 3. This table
also indicates the dimension of the DEA analysis for each DMU, representing the total number of inputs and outputs without missing values. Note that a full dimension analysis includes 6 variables for the authorities perspective and 5 variables for the society perspective.
Authorities Society
School Dimension Efficiency times in peer set Dimension Efficiency times in peer set Type
U45 6 100% 8 5 100% 11 private U13 5 100% 1 5 100% 8 private U33 6 100% 7 5 100% 7 public U44 5 100% 2 4 100% 5 public U47 6 100% 6 5 100% 3 private U48 5 100% 3 4 100% 3 public U39 6 100% 2 5 100% 3 public U25 6 100% 3 5 100% 2 public U10 6 100% 7 5 100% 1 private U21 5 100% 1 5 100% 1 private U14 6 100% 1 5 100% 1 private U37 4 100% 1 3 100% 1 private U26 4 100% 1 3 90.4% public U23 6 99.1% 5 97.2% public U16 6 98.9% 5 98.2% public U49 6 97.9% 5 95.1% private U7 6 97.6% 5 96.9% public U34 6 94.0% 5 93.9% public U9 6 87.8% 5 86.9% public U38 6 87.6% 5 87.6% public U40 6 86.1% 5 84.4% private U17 6 85.4% 5 85.3% public
Table 3 - DEA radial scores for authorities and society perspectives
The efficiency scores are quite high for both perspectives. This finding is, in our opinion, a result of two factors: (i) the small number of schools analyzed, and the corresponding small discriminant power of DEA models given the number of inputs and outputs we used; and (ii) the fact that the schools used in this study are already engaged in external evaluations and are in general concerned with quality improvements and efficiency issues. It should also be noted that the efficiency scores are relative, meaning that the high average efficiency of the schools analysed should be interpreted as a sign of homogeneity in terms of efficiency, and cannot be extrapolated to a conclusion that Portuguese schools are very efficient.
In terms of the comparison between the society perspective and authorities perspective, we note that the efficiency scores for the authorities perspective can only be greater or equal to the scores for the society perspective. When the scores are higher in the authorities
11 perspective than in the society perspective, it is an indication that the school achieves the academic results with limited resources available in terms of teacher salaries. The greatest difference between the efficiency scores of the two perspectives was observed in school 26. School 26 has an average salary per pupil of 1887 thousand Euros. Clearly this school has a value for this variable that is lower than the global average (2844.5 thousand Euros), which can be due to a combination of effects like unexperienced teachers in the beginning of their careers, or a small number of teachers. Therefore, some of the inefficiencies detected in terms of the ability to generate good academic achievements can be explained by the lack of teacher related resources, such that it should not be penalized in the authorities perspective assessment.
For each school classified as inefficient, it is possible to identify its main weaknesses and strengths based on a comparison with the peers revealed by the DEA assessment. To illustrate what a school can learn from the DEA assessment, take for example one of the worst performing schools under the educational authorities perspective: school 40. The targets and peers for this school are shown in Table 4.
School 10 School 47 School 25 School 33
Input and output variables Observed Target λ=0.365 λ=0.200 λ=0.240 λ=0.040 Average scores on entry 10.32 10.32 10.36 10.95 10.32 11.36 Average years in school for parents 10.26 10.26 10.04 9.97 10.97 12.53 Teacher salaries per pupil 2790.87 2790.87 2445.54 2246.95 3771.30 3834.52 Average scores on exit 9.52 11.06 11.22 11.25 10.82 13.02 % completing education in 3 years 0.304 0.354 0.297 0.455 0.287 0.583 % that did not abandon school 0.807 0.938 0.964 0.976 0.986 0.905
Table 4 - Targets and peers of school 40 in educational authorities assessment The comparison between input and output levels of inefficient units with their peers can be illustrated using radar graphs, where the strengths and weaknesses of the school assessed become clear. Figure 1 compares school 40 with its peers, where the values in these radars are normalized by the observed input and output levels of school 40 to make comparisons easier. 0 0.5 1 1.5 Scores entry Parents Education Salaries Finished 3 years Non- abandon Scores exit school 40 school 47 0 0.5 1 1.5 Scores entry Parents Education Salaries Finished 3 years Non- abandon Scores exit school 40 school 10 0 0.5 1 1.5 Scores entry Parents Education Salaries Finished 3 years Non- abandon Scores exit school 40 school 25
12 Figure 1 – Comparison of School 40 with its peers
Schools 10 and 47 can be seen as two interesting peers for school 40, since they have about the same or less inputs but both produce more outputs. School 47 is particularly strong in the percentage of pupils finishing secondary education in three years, and it also achieved superior results on non-abandon rates and average scores on exit. School 10 is stronger than school 40 particularly on average scores on exit and non-abandon rates. In addition, school 25 provides evidence that, particularly for the society perspective, it is possible to obtain similar or higher outputs than those of school 40 with about the same inputs. Therefore these peers provide evidence that it is possible for school 40 to improve its outputs about 16.2% (the efficiency score of school 40 is 1/1.162 = 86.06%). Note that school 33 was also used as a peer for school 40, but its contribution to the targets is very small (with λ<5%), so we omitted its graphical representation.
Assessment of schools under a common set of weights
In order to differentiate the set of schools classified as efficient in the DEA analysis and identify global benchmarks, we used model (4) with an additional NIRS constraint to assess schools using a common set of weights.
The result of this assessment is the set of optimal common weights assigned by schools to each input and output under the educational authorities and society perspectives. Interestingly both these perspectives arose at the same set of weights and efficiency scores (since the weight placed on the variable teacher salaries per pupil was zero).
Note that the variables teacher salaries per pupil and percentage of students that completed secondary education in 3 years were assigned a zero weight in the common weights model. These zero weights imply that to weight these factors in the computation of efficiency does not contribute for improving average efficiency for the sample as a whole. One can conclude that as efficiency is a relative measure, the variables that were assigned a non-zero weight are those where schools perform on average similarly, while the variables assigned a zero weight are those where schools perform on average more differently. This implies that an assessment with common weights focuses on characteristics where schools show a similar profile. Therefore, the DMUs identified as efficient from the single weights model are likely to be good benchmarks for all other DMUs in the sample. This is consistent with the fact that the efficient schools in the single weights model (schools 45, 13 and 33) are also those that were included more often in the peer set of inefficient DMUs in the original DEA assessment (see Table 3).
School Efficiency School Efficiency
U45 100% U7 93.9% U13 100% U23 91.3% U33 100% U9 85.3% U10 99.8% U17 85.2% U21 99.2% U38 84.8% U39 97.3% U40 84.4% U16 96.5% U14 82.6% U25 95.8% U48 * U47 95.8% U37 * U49 95.1% U44 * U34 93.9% U26 *
13 The efficiency results corresponding to the assessment with a common set of weights are shown in Table 5, where the schools removed from the assessment due to missing inputs are identified by an asterisk.
It is interesting to note that even when schools are all forced to use the same weights, the efficiency scores are still very high. The lowest score observed is 82.6% for school 14. The average efficiency is 93.4%, just slightly below the average efficiency under the educational authorities and society assessments, that was respectively 96.8% and 94.8%.
Conclusion
This paper assessed a small sample of Portuguese secondary schools using DEA. Schools were assessed from two perspectives, a society perspective and an educational authorities perspective, that implied different specifications of the input set used to evaluate schools. The DEA model allowed schools to freely choose the weights assigned to each of the factors considered in the assessment, which reinforces confidence in the identification of inefficient units. In order to improve the discrimination between efficient schools and to identify global benchmarks, we developed a model with common weights for all schools.
The empirical analysis also provided the opportunity to make some considerations regarding the use of ratio data in DEA assessments of schools, and addressing some issues regarding missing data.
The results showed that the relative efficiency of the schools analysed is quite high, meaning that the performance of these schools is homogenous. Nevertheless, the comparison between benchmark and inefficient schools pointed directions for performance improvement that could be followed by emulating the practices of benchmark schools. The single weights model allowed the identification of global benchmark schools that could be used in a subsequent qualitative study to analyse in more detail the characteristics of these schools, such that their good practices could be disseminated.
A major limitation of this study related to the use of a small sample of schools. The analysis reported in this paper intends to illustrate the potential of the framework described, which can be useful by schools interested in improving the academic achievement of their students.
Acknowledgments
The authors thank Fundação Manuel Leão, in particular professor Joaquim Azevedo, for allowing the use of the AVES data in this study. The authors also acknowledge the financial support of the program POCI 2010 co-financed by the Portuguese government through Foundation for Science and Technology (FCT - Fundação para a Ciência e Tecnologia) and the European Union through FEDER (POCI/EGE/60561/2004).
References
Arnold, V., Bardhan, I., Cooper, W., and Kumbhakar, S. (1996). “New uses and statistical regressions for efficiency evaluation and estimation - with an illustrative application to public secondary schools in Texas”. Annals of Operations Research, Vol. 66, 255-277.
14 Azevedo, J. (2005). “Avaliação de escolas: Fundamentar modelos e operacionalizar
processos”, Conselho Nacional da Educação.
Banker, R.D., Janakiraman, S. and Natarajan, R. (2004). “Analysis of trends in technical and allocative efficiency: An application to Texas public school districts”, European Journal of Operational Research, Vol. 154, No.2, 477-491.
Bessent, A. and Bessent, W. (1980). Determining the comparative efficiency of schools through data envelopment analysis. Educational Administration Quarterly, Vol. 16, No.2, 57-75.
Bradley, S., Johnes, G., and Millington, J. (2001). “The effect of competition on the efficiency of secondary schools in England”, European Journal of Operational Research, Vol. 135, 545-568.
Charnes, A., Cooper, W.W., and Rhodes, E. (1978). “Measuring efficiency of decision making units”, European Journal of Operational Research, Vol. 2, 429-444.
Cook, W.D., Kazakov, A., Roll, Y., and Seiford, L.M. (1991). “A data envelopment approach to measuring efficiency: case analysis of highway maintenance patrols”, The Journal of Socio-Economics, Vol. 20, No. 1, 83-103.
Gray, J. (1981). “A competitive edge: examination results and the probable limits of secondary school effectiveness”, Educational Review, Vol. 33, No.1, 25-35.
Hanushek, E. (1986). “The economics of schooling: production and efficiency in public schools”, Journal of Economic Literature, Vol. XXIV, 1141-1177.
Kirjavainen, T. and Loikkanen, H.A. (1998). “Efficiency differences of Finnish senior secondary schools: An application of DEA and Tobit analysis”, Economics of Education Review, Vol. 17, No. 4, 377-394.
Kuosmanen, T. (2002). “Modelling blank data entries in data envelopment analysis”, Economics working paper at WUSTL, No. 0210001 (Econometrics).
Kuosmanen, T., Cherchye, L., and Sipilainen, T. (2006). “The law of one price in data envelopment analysis: Restricting weight flexibility across firms”, European Journal of Operational Research, Vol. 170, 735-757.
Mancebón, M. and Bandrés, E. (1999). “Efficiency evaluation in secondary schools: the key role of model specification and of ex-post analysis of results”, Education Economics, Vol. 7, No. 2, 131-152.
Mayston, D. (2003). “Measuring and managing educational performance”, Journal of the Operational Research Society, Vol. 54, 679-691.
Mizala, A., Romaguera, P., and Farren, D. (2002). “The technical efficiency of schools in Chile”, Applied Economics, Vol. 34, 1533-1552.
15 Muniz, M.A. (2002). “Separating managerial inefficiency and external conditions in data
envelopment analysis”, European Journal of Operational Research, Vol. 143, 625-643.
Oliveira, M.A. and Santos, C. (2005). “Assessing school efficiency in Portugal using FDH and bootstrapping”, Applied Economics, Vol. 37, 957-968.
Post, T. and Spronk, J. (1999). “Performance benchmarking using interactive data envelopment analysis”, European Journal of Operational Research, Vol. 115, 472-487.
Roll, Y., Cook, W.D., and Golany, B. (1991). “Controlling factor weights in data envelopment analysis”, IIE Transactions, Vol. 23, No. 1, 2-9.
Thanassoulis, E., Portela, M., and Despic, O. (2007). “DEA - the mathematical programming approach to efficiency analysis”, In Fried, H.O., Lovell, C.A.K., and Schmidt, S.S. (Eds.), The Measurement of Productive Efficiency and Productivity Growth, Oxford University Press, New York, Oxford.
Worthington, A. C. (2001). “An empirical survey of frontier efficiency measurement techniques in education”, Education Economics, Vol. 9, No. 3, 245-268.