using Next Generation Sequencing data of
Kidney renal cell carcinoma
Shib Sankar Bhowmick1,2, Luis Rato3, and Debotosh Bhattacharjee2
Abstract MicroRNAs (miRNAs) are a class of 22-nucleotide endogenous noncod-ing RNAs, plays important role in regulatnoncod-ing target gene expression via repress-ing translation or promotrepress-ing messenger RNAs (mRNA) degradation. Numerous re-searchers have found that miRNAs have serious effects on cancer. Therefore, study of mRNAs and miRNAs together through the integrated analysis of mRNA and miRNA expression profiling could help us in getting a deeper insight into the can-cer research. In this regards, High-Throughput Sequencing data of Kidney renal cell carcinoma is used here. The proposed method focuses on identifying mRNA-miRNA pair that has a signature in kidney tumor sample. For this analysis, Ran-dom Forests, Particle Swarm Optimization and Support Vector Machine classifier is used to have best sets of mRNAs-miRNA pairs. Additionally, the significance of selected mRNA-miRNA pairs is tested using gene ontology and pathway analysis tools. Moreover, the selected mRNA-miRNA pairs are searched based on changes in expression values of the used mRNA and miRNA dataset.
Key words: mRNA, miRNA, Next Generation Sequencing data, Particle Swarm Optimization, Random Forest
1 Introduction
MicroRNAs (miRNAs) are small non-coding RNAs of approximately 19-22 nu-cleotides act as post-transcriptional gene expression regulators, bind with
comple-1Department of Electronics & Communication Engineering, Heritage Institute of Technology,
Kolkata, India, e-mail: [email protected]
2Department of Computer Science and Engineering, Jadavpur University, Kolkata 700032,
West Bengal, India, e-mail: [email protected]
3Department of Informatics, University of Evora, Evora 7004-516, Portugal,
e-mail: [email protected]
mentary messenger RNAs (mRNAs) for stimulating their degradation or repressing translation. In this regards, innovation of Next-Generation Sequencing (NGS) [6] technology provides improved solution to the understanding of an entire human genome sequence than compared to the previously used technologies, i.e., Sanger sequencing or Capillary sequencing. Next-Generation Sequencing technologies can also be applied to the RNA sequencing (RNA-seq) to directly sequence complemen-tary DNAs (cDNAs). RNA sequencing permits the quantitative analysis of gene ex-pression and transcript variant discovery. The primary aim of RNA-sequencing is to find out differentially expressed genes when applied to multiple samples at different biological conditions.
Numerous statistical approaches have been proposed over the years to analyze differentially expressed RNA-seq data, e.g., edgeR [15], DESeq [1], and sSeq [20]. In this connection, algorithms like [14, 17] can be used to rank and select the di ffer-entially expressed miRNAs. Apart from this, hypothesis test [10], classifier based method [7] and information theory based measures [13] are used in gene ranking as well as in miRNA ranking. Parametric method like [18] is developed by using the expression overlapping between different classes. Nonparametric ReDiscovery Curve (RDCurve) based method [12] study the stability of various ranking methods. Reviewing all these methods, here we have proposed an integrated analysis of the gene expression profiling of both mRNAs and miRNAs by using Kidney renal clear cell carcinoma data that includes tumor and control samples. The proposed method is a feature selection wrapper, consisting of Random Forests [5], Particle Swarm Optimization (PSO) [8] and Support Vector Machine (SVM) [4] classifier. More-over, emphasis is given here to identified the differentially expressed mRNAs and miRNAs in-order to find out mRNA-miRNA pairs. In particular, this kind of obser-vations might be significant in the cancer diagnosis. Moreover, we validate some of our most interesting findings in different biological significance analysis.
The paper is organized as follows: Section 2 briefly describes the proposed method. Section 3 shows the empirical results. Finally, Section 4 concludes this paper with an additional note of future work.
2 Proposed Method
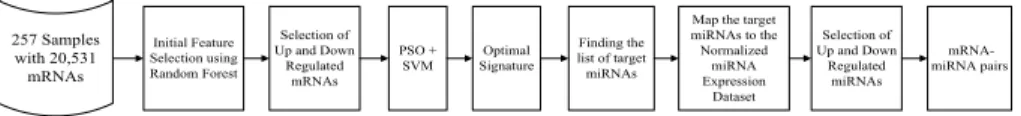
The proposed wrapper based feature selection method starts with 1135 number of samples having 20, 531 mRNAs. The mRNA sample includes 534 tumors and 601 control patients whereas miRNA include 254 tumor and 455 control sample. Since this experiment is an integrated analysis of mRNA and miRNA data. Hence, com-mon tumor and control samples acom-mong mRNA and miRNA data are considered here, that consist of 186 tumor and 71 control samples. Steps of the proposed method are described below:
The primary goal of feature selection is to avoid any kind of over fitting as well as to improve the model performance. To gain a deeper insight into the underlying processes of feature selection Random forest is used here. Several measures of
vari-able importance can be identified by Random forest. Hence, by iteratively fitting Random Forest at each iteration smallest set of informative mRNAs are identified. In this regards, smallest OOB error rate is considered to be the underline criteria. Because of the iterative approach, the OOB error is biased down and mRNAs with smallest OOB error are selected as the reduced set of features. For this analysis, normalized transcript reads of mRNAs are considered.
After feature selection using Random forest, in the next step of this work t-test and fold change concepts are applied in order to segregate differentially expressed mRNAs from normal and malignant samples. For this purpose, cut-off like p-value < 0.05 and the fold change > 1 or < −1 are used as in [21]. In particular, change in expression profile is considered to be the underline criteria to find out differentially expressed mRNAs. Moreover, the differentially expressed mRNAs are mapped to their normalized mRNA expression dataset of tumor and control samples.
The Particle Swarm Optimization (PSO) and Support Vector Machine (SVM) provide a wrapper based approach for feature selection. It can effectively identify significant mRNAs associated with Kidney renal cell carcinoma. For that, initial particles of PSO are created using mRNA indices. Thereafter, the swarm is pre-pared from a number of such particles. Moreover, encoded indices of these particles are used to make a subset of data that are taken part during classification by SVM. Here 5 Fold Cross Validation (FCV) is applied and accuracy is considered to be the underline criteria for fitness evaluation. Block diagram of the proposed approach is presented in Fig. 1. Moreover, the optimal signature refers to be the best set of differentially expressed mRNA that provides highest classification accuracy. In this regards, most appeared mRNAs concerning all runs of the proposed methods are considered.
In this experiment, the expression datasets comprising the profiles of mRNAs and miRNAs are considered. For this analysis, expression values of 1047 miRNA in 186 tumor and 71 control sample are used. The selected mRNAs by PSO+SVM are con-sidered to find their corresponding miRNA targets. For this validation miRDB [19] database is used. Shortlisted target miRNAs are used to find their expression profiles from the normalized miRNA expression dataset of 186 tumor and 71 control sam-ples. Any further analysis of miRNA is done using this reference expression vector in-order to find out differentially expressed miRNAs.
Likewise, the mRNAs, based on p-value and fold change in expression levels, up and down regulated miRNAs are identified. The miRNAs are known for suppressing the expression level of mRNAs. Hence, our method selected up and down regulated mRNAs and miRNAs are used to make mRNA-miRNA pairs. For that, combination of up-regulated mRNAs with down-regulated miRNAs and vice versa are used.
257 Samples with 20,531 mRNAs Initial Feature Selection using Random Forest Finding the list of target miRNAs Selection of Up and Down Regulated mRNAs Optimal Signature PSO + SVM mRNA-miRNA pairs Map the target
miRNAs to the Normalized miRNA Expression Dataset Selection of Up and Down Regulated miRNAs
3 Experimental Results
3.1 Datasets
The dataset comes from The Cancer Genome Atlas (TCGA)1. It features mRNA
and miRNA expression levels for Kidney renal cell carcinoma (KIRC) of different tumor, and control samples. For KIRC, normalized expression mRNA and miRNA datasets consisting of 186 common tumors, and 71 common control samples are considered.
3.2 Results
Here, the problem is to identify mRNA-miRNA pairs for the investigated dataset. For this purpose, the expression profiles of 20, 531 mRNAs over 186 kidney renal cell tumor samples and 71 control samples are considered. In order to find reduced set of features, Random forest is used here. Because of it’s iterative approach, the OOBerror is biased down and mRNAs with smallest OOB error are selected as the reduced set of features. This has been shown in Fig. 2 (a). By this process, 511 infor-mative mRNAs are selected. In order to identify the up and down regulated mRNAs, significant changes in the expression profiles are measured. For this analysis, the volcano plot in Fig. 2 (b), illustrate the differentially expressed mRNAs among the 511. By this process, 242 up and 191 down regulated mRNAs are identified. Now, these shortlisted mRNAs are process, using PSO+SVM. For this process, the pa-rameters used in the proposed method are summarized in Table 1. Here, PSO+SVM executed 30 times (Nexe) on these differentially expressed mRNAs. According to the
experimental results, PSO+SVM achieved 92.60% average classification accuracy for mRNA data. The average values of precision, sensitivity, specificity, F-measure and MCC are 92.57%, 92.58%, 92.62%, 92.58% and 0.920, respectively. For this process, 10 mRNAs are considered by PSO+SVM during each run. Moreover, as PSO+SVM was executed 30 times hence, in each run of the proposed method a new set of differentially expressed mRNAs are identified. After the end of 30 executions, one list is prepared that include all the appeared mRNAs. Thereafter, from that list most appeared mRNAs covering all the runs of the proposed method are identified. These mRNAs are considered to be optimal up and down regulated mRNAs associ-ated with Kidney renal cell cancer subtypes.
Thereafter, these selected mRNAs are used to find their corresponding miRNA targets and for this validation miRDB [19] database is used. Moreover, these short-listed target miRNAs find their expression profiles from the normalized miRNA expression dataset of 186 tumor and 71 control samples. A total of 450 miRNAs tar-gets are identified from the miRGate database. Out of which, 417 miRNAs matches their expression profile in the normalized miRNA expression dataset. Hence, the 1https://tcga-data.nci.nih.gov/tcga/
miRNAs for which expression profile information is known are only taken at this stage. Therefore, out of the 450 miRNAs in the list, 33 have been excluded because they did not have the expression profile information in our used normalized miRNA expression dataset. Thereafter, p-value and fold change analysis of the shortlisted 417 differentially expressed miRNAs, identified the up and down regulated one. By this process 14 informative miRNAs are identified, that includes 12 down reg-ulated and 2 up regreg-ulated miRNAs. Method selected down regreg-ulated miRNAs are mir-200c, mir-181a-2, mir-196a-1, mir-183, mir-194-2, hsa-mir-196a-2, hsa-mir-10b, hsa-mir-138-1, hsa-mir-182, hsa-mir-192, hsa-mir-135b, hsa-mir-199bwhereas hsa-mir-141, hsa-mir-196b are up regulated miRNAs.
Studies on miRNAs found that it can suppress the expression level of mRNAs. As miRNAs and mRNAs belonging to same sample (Tumor and Control) of KIRC dataset is used in this experiment. Hence, differentially expressed miRNAs and mR-NAs of the same sample (Tumor and Control), can be paired. Moreover, up regulated miRNAs can be mapped with down-regulated mRNAs and vice versa. In the pro-cess, many of the selected mRNAs have been excluded from the list while miRNAs remain same. Final list of mRNA-miRNA pair include 98 up-regulated mRNA and 12 down-regulated miRNA pair and 62 down-regulated mRNA and 2 up-regulated miRNA pair. Details of which are given in Table2.
0 5 10 15 20 25 30 35 40 45 50 Number of Grown Trees 0 0.05 0.1 0.15 0.2 0.25 0.3 0.35 O u t-o f-Ba g C la ssi fi ca ti o n Erro r -6 -4 -2 0 2 4 6 0 50 100 150 200 250 300 -log1 0(p-value ) Cutoff Values -log2(ratio)
(a) OOB errors (b) Volcano plot
Fig. 2 (a) Variation of OOB errors with the number of grown trees in Random forest, (b) Volcano plot depicts 242 up and 191 down regulated mRNAs
Table 1 Parameters used in the experiment
Symbol Value Description Symbol Value Description Npar 50 Number of Particles ϕ2 2 Social Constant Nitr 50 Number of Iterations ω 0.9 Inertia Weight L 10 Length of a Particle C 0.01 SVM C Constant ϕ1 2 Cognitive Constant Nexe 30 Number of Executions
Table 2 Method selected up and down regulated miRNA and mRNAs
Down Regulated Up Regulated Up Regulated mRNA Down Regulated mRNA
miRNA miRNA
hsa-mir-200c hsa-mir-141 ABCB7 BCL2L12 C9orf117 CHTF8 DUSP23 FGF2 HIST1H3E B3GALT5 CHURC1 DNAH17 GEMIN7 ID4 hsa-mir-181a-2 hsa-mir-196b ABCD4 BCL7C CA11 COL4A6 DUT FSTL5 HSPA12A BSND CIITA DPYSL5 GIN1 IDH1 hsa-mir-196a-1 ACAD11 BICC1 CACNA2D2 CPD EDEM1 FTL IGSF3 CCNT2 CKAP2L E2F3 GIPC1 hsa-mir-183 ADCY2 BMPR1B CALB2 CREG2 ENGASE FZD3 IL17REL CDC42 CLNK ELL GIT2 hsa-mir-194-2 ADRA2C BPGM CCDC141 CRNKL1 EPB41L1 GABRE IMMP2L CDH10 CLUL1 ENOSF1 GLUD1 hsa-mir-196a-2 AHCYL1 BRI3BP CCDC152 CRTAM EPPK1 GALNT6 IMPA1 CLNK CNOT6L FAM172A GNAS hsa-mir-10b ALCAM BST1 CCDC85C CRTAP EXT1 GATM INCENP DNAH17 CNR1 FAM19A5 GNPTAB hsa-mir-138-1 ANKRD13A BTBD2 CCDC88A CSF2RB FAIM2 GDF2 IQSEC1 DPYSL5 CPEB2 FBXO48 GPR37 hsa-mir-182 ANKRD34B BVES CCND2 CYBRD1 FAM120C GLT8D2 E2F3 CPEB3 FCGR3A GRM5 hsa-mir-192 ARGFX C17orf107 CCNT1 CYLD FAM126B GPKOW ELL CWF19L1 FLRT2 GSTM2 hsa-mir-135b ARHGAP20 C19orf70 CDK10 CYP8B1 FAM189A1 GPR161 ENOSF1 CYP1A2 GAB2 HAGHL hsa-mir-199b ARHGEF18 C4orf32 CGNL1 DIRAS1 FAM196A GTPBP8 EPN1 DAZAP2 GAL3ST1 HBS1L
ARMC10 C4orf45 CHML DNAJC14 FAM198B H6PD GIT2 DISC1 GBP2 HEY1 ATG2A C5AR1 CHST5 DPP9 FBXL18 HACE1 HDDC3 DKK1 GDF11 HIVEP3 ATP2B2 C9orf114 CHST6 DRP2 FCHSD1 HEPH CHST7 DLG5 GDF7 ID3
3.3 Biological Significance
Table 3 Most significant Gene Ontology terms concerning selected genes for Biological Process (P), Cellular Component (C) and Molecular Function (F) obtained through Enrichment analysis via Enrichr [9]
Term P-value Genes
GO Biological
cellular iron ion homeostasis (GO:0006879) 3.68e-05 HEPH, ABCB7, GDF2, CYBRD1, FTL
Process (P)
N-acetylglucosamine metabolic process (GO:0006044) 5.16e-05 CHST6, CHST7, CHST5
sulfur compound metabolic process (GO:0006790) 9.36e-05 CHST6, CHST7, CHST5
positive regulation of cyclin-dependent protein serine (GO:0045737) 4.64e-04 CCNT2, CCND2, CCNT1
negative regulation of cytoplasmic translation (GO:2000766) 8.66e-04 CPEB3, CPEB2
GO Cellular
cyclin/CDK positive transcription elongation factor complex (GO:0008024) 1.60e-03 CCNT2, CCNT1
Component (C)
messenger ribonucleoprotein complex (GO:1990124) 1.60e-03 CPEB3, CPEB2
Golgi membrane (GO:0000139) 1.66e-03 EXT1, CDC42, GALNT6, CHST6,
CHST7, HACE1, GNPTAB, EDEM1, CHST5
CCR4-NOT complex (GO:0030014) 6.59e-03 CNOT6L, CPEB3
neuron projection (GO:0043005) 1.36e-02 CALB2, CDC42, CPEB3, CPEB2
GO Molecular
N-acetylglucosamine 6-O-sulfotransferase activity (GO:0001517) 1.53e-05 CHST6, CHST7, CHST5
Function (F)
7SK snRNA binding (GO:0097322) 8.66e-04 CCNT2, CCNT1
mRNA 3’-UTR AU-rich region binding (GO:0035925) 2.55e-03 CPEB3, CPEB2
transforming growth factor beta receptor binding (GO:0005160) 2.87e-03 GDF11, GDF2, GDF7
translation repressor activity, nucleic acid binding (GO:0000900) 3.10e-03 CPEB3, CPEB2
Biological significance analysis of the mRNAs-miRNAs pairs have been car-ried out by KEGG pathway enrichment and Gene ontology analysis. In this re-gards, miRSystem ver. 20160502 [11] and Enrichr [9] helps is finding the as-sociated pathways of the significant mRNA-miRNA pairs. For the Gene enrich-ment analysis, the biological process (P), cellular component (C) and molecular function (F) hierarchies in gene ontology (GO) are considered. The most signif-icant GO terms, with lowest p-values (< 0.001) for the biological processes (P) associated with mRNA data are cellular iron ion homeostasis (GO:0006879), N-acetylglucosamine metabolic process (GO:0006044), sulfur compound metabolic process (GO:0006790), positive regulation of cyclin-dependent protein serine (GO: 0045737), negative regulation of cytoplasmic translation (GO:2000766)etc. Signif-icant top 5 Gene Ontology terms concerning selected genes for Biological Process (P), Cellular Component (C) and Molecular Function (F) are reported in Table.3. This table also includes a list of associated genes corresponding to each ontology
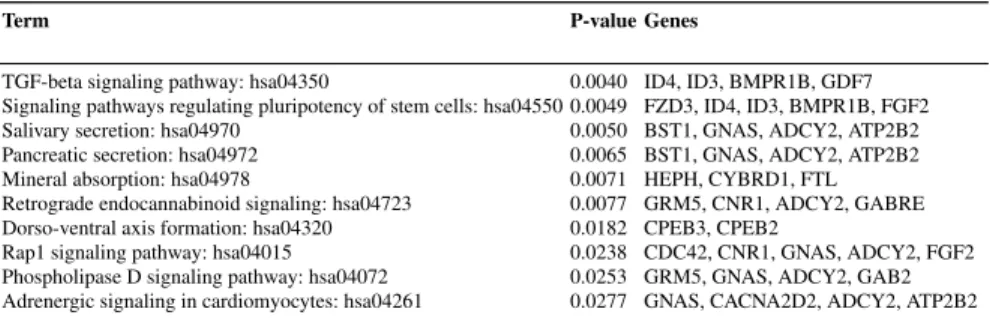
term. Association of the obtained mRNAs with different biological pathways are been identified by KEGG pathway enrichment analysis. It has been observed that, significant mRNAs are associated with many KEGG pathways. Among them, only 10 significant pathways with lowest p-values are presented in Table.4. For this anal-ysis, 98 up-regulated mRNA and 62 down-regulated mRNA are considered. Overall, the results signify the importance of selected mRNA-miRNA pairs.
Table 4 Top 10 KEGG pathways associated with the selected up and down regulated mRNAs
Term P-value Genes
TGF-beta signaling pathway: hsa04350 0.0040 ID4, ID3, BMPR1B, GDF7 Signaling pathways regulating pluripotency of stem cells: hsa04550 0.0049 FZD3, ID4, ID3, BMPR1B, FGF2 Salivary secretion: hsa04970 0.0050 BST1, GNAS, ADCY2, ATP2B2 Pancreatic secretion: hsa04972 0.0065 BST1, GNAS, ADCY2, ATP2B2 Mineral absorption: hsa04978 0.0071 HEPH, CYBRD1, FTL Retrograde endocannabinoid signaling: hsa04723 0.0077 GRM5, CNR1, ADCY2, GABRE Dorso-ventral axis formation: hsa04320 0.0182 CPEB3, CPEB2
Rap1 signaling pathway: hsa04015 0.0238 CDC42, CNR1, GNAS, ADCY2, FGF2 Phospholipase D signaling pathway: hsa04072 0.0253 GRM5, GNAS, ADCY2, GAB2 Adrenergic signaling in cardiomyocytes: hsa04261 0.0277 GNAS, CACNA2D2, ADCY2, ATP2B2
4 Conclusion
In this paper, the integrated analysis of mRNA and miRNA expression data identi-fied a number of mRNAs and miRNAs that are differentially expressed in control and tumor samples. For this analysis, Random Forests is used as initial feature se-lector. Thereafter, with the help of Particle Swarm Optimization and Support Vector Machine classifier the proposed method is optimized to have best sets of mRNAs. In addition to that, functional miRNA targets of selected mRNAs are also identi-fied for the expression data of Kidney renal cell. Finally, differentially expressed mRNA-miRNA pair are prepared. These selected mRNA-miRNA pairs are proven to be relevant according to gene ontology and pathway analysis tools. Hence, these mRNA-miRNA pairs are the potential biomarkers for the Kidney renal cell cancer type. In conclusion, this analysis is proven to be helpful for the joint mRNA-miRNA biomarker identification and could also be used as miRNA marker [3, 16] and gene selection [2].
References
1. Anders, S., Huber, W.: Differential expression analysis for sequence count data. Genome
2. Bhowmick, S.S., Saha, I., Maulik, U., Bhattacharjee, D.: Biomarker identification using next generation sequencing data of RNA. In: Advances in Computing, Communications and Infor-matics (ICACCI), 2016 International Conference on, pp. 299–303 (2016)
3. Bhowmick, S.S., Saha, I., Maulik, U., Bhattacharjee, D.: Identification of miRNA signature using next-generation sequencing data of prostate cancer. in Proceedings of the 3rd Interna-tional Conference on Recent Advances in Information Technology pp. 528–533 (2016) 4. Boser, B.E., Guyon, I.M., N.Vapnik, V.: A training algorithm for optimal margin classifiers.
in Proceedings of the 5th Annual Workshop on Computational Learning Theory pp. 144–152 (1992)
5. Breiman, L.: Random forests. Machine learning 45(1), 5–32 (2001)
6. Grada, A., Weinbrecht, K.: Next-generation sequencing: methodology and application. Jour-nal of Investigative Dermatology 133(8), e11 (2013)
7. Guyon, I., Weston, J., Barnhill, S., Vapnik, V.: Gene selection for cancer classification using support vector machines. Machine learning 46(1-3), 389–422 (2002)
8. Kennedy, J., Eberhart, R.: Particle swarm optimization. in Proceedings of IEEE International Conference on Neural Networks 4, 1942–1948 (1995)
9. Kuleshov, M.V., Jones, M.R., Rouillard, A.D., Fernandez, N.F., Duan, Q., Wang, Z., Koplev, S., Jenkins, S.L., Jagodnik, K.M., Lachmann, A., et al.: Enrichr: a comprehensive gene set enrichment analysis web server 2016 update. Nucleic acids research p. gkw377 (2016) 10. Leidinger, P., Keller, A., Borries, A., Reichrath, J., Rass, K., Jager, S.U., Lenhof, H.P., Meese,
E.: High-throughput miRNA profiling of human melanoma blood samples. BMC cancer 10(1), 1 (2010)
11. Lu, T.P., Lee, C.Y., Tsai, M.H., Chiu, Y.C., Hsiao, C.K., Lai, L.C., Chuang, E.Y.: miRSystem: an integrated system for characterizing enriched functions and pathways of microrna targets. PloS one 7(8), e42,390 (2012)
12. Lu, X., Gamst, A., Xu, R.: RDCurve: A nonparametric method to evaluate the stability of
ranking procedures. IEEE/ACM Transactions on Computational Biology and Bioinformatics
7(4), 719–726 (2010)
13. Peng, H., Long, F., Ding, C.: Feature selection based on mutual information criteria of max-dependency, max-relevance, and min-redundancy. IEEE Transactions on pattern analysis and machine intelligence 27(8), 1226–1238 (2005)
14. Ray, S.S., Ganivada, A., Pal, S.K.: A granular self-organizing map for clustering and gene selection in microarray data (2015)
15. Robinson, M.D., McCarthy, D.J., Smyth, G.K.: edgeR: a bioconductor package for differential
expression analysis of digital gene expression data. Bioinformatics 26(1), 139–140 (2010) 16. Saha, I., Bhowmick, S.S., Geraci, F., Pellegrini, M., Bhattacharjee, D., Maulik, U.,
Plewczyn-ski, D.: Analysis of next-generation sequencing data of miRNA for the prediction of breast cancer. In: International Conference on Swarm, Evolutionary, and Memetic Computing, pp. 116–127 (2015)
17. Sehhati, M., Mehridehnavi, A., Rabbani, H., Pourhossein, M.: Stable gene signature
selec-tion for predicselec-tion of breast cancer recurrence using joint mutual informaselec-tion. IEEE/ACM
Transactions on Computational Biology and Bioinformatics 12(6), 1440–1448 (2015) 18. Sharma, A., Imoto, S., Miyano, S.: A top-r feature selection algorithm for microarray gene
expression data. IEEE/ACM Transactions on Computational Biology and Bioinformatics
(TCBB) 9(3), 754–764 (2012)
19. Wong, N., Wang, X.: miRDB: an online resource for microrna target prediction and functional annotations. Nucleic acids research p. gku1104 (2014)
20. Yu, D., Huber, W., Vitek, O.: Shrinkage estimation of dispersion in negative binomial models for RNA-seq experiments with small sample size. Bioinformatics 29(10), 1275–1282 (2013) 21. Zhuang, X., Li, Z., Lin, H., Gu, L., Lin, Q., Lu, Z., Tzeng, C.M.: Integrated miRNA and
mRNA expression profiling to identify mRNA targets of dysregulated miRNAs in non-obstructive azoospermia. Scientific Reports 5 (2015)

![Table 3 Most significant Gene Ontology terms concerning selected genes for Biological Process (P), Cellular Component (C) and Molecular Function (F) obtained through Enrichment analysis via Enrichr [9]](https://thumb-eu.123doks.com/thumbv2/123dok_br/15567542.1047630/6.918.206.701.479.667/significant-ontology-concerning-biological-cellular-component-molecular-enrichment.webp)