RESISTANCE TO SUGARCANE MOSAIC VIRUS
ISABEL REGINA PRAZERES DE SOUZA1, JOSÉ HENRIQUE SOLER GUILHEN2,
CAMILO DE LELIS TEIXEIRA DE ANDRADE1, MARCOS DE OLIVEIRA PINTO1,
UBIRACI GOMES DE PAULA LANA1 e MARIA MARTA PASTINA1
1Embrapa Milho e Sorgo, Sete Lagoas, MG, Brazil, [email protected],
[email protected], [email protected], [email protected], [email protected] 2Universidade Federal do Espírito Santo, Alegre, Espírito Santo, Brazil, [email protected]
Revista Brasileira de Milho e Sorgo, v.18, n.3, p. 322-339, 2019
ABSTRACT - The Sugarcane mosaic virus (SCMV), a maize pathogen epidemic worldwide, is the causal agent of common mosaic, one of the most important viral diseases in Brazil. In this study, we mapped and characterized quantitative trait loci (QTL) conferring resistance to SCMV in a maize population consisting of 127 F2:3 families from the cross between two
Brazilian maize inbred lines, L18 (resistant) × L19 (susceptible). Field trials were carried out in two years to evaluate the F2:3 families according to a resistance score after artificial inoculation. QTLs were detected via composite interval mapping, using a linkage map based on 82 SSRs, 3 CAPS and 296 SNPs. The heritability ranged from 73.68 to 95.16% and SCMV resistance QTLs were consistently identified on chromosomes 1 and 3, showing minor and major effects, respectively. The major QTL on chromosome 3 explained a large proportion of the genetic variance, being 50 and 70% in year 1 and 2, respectively, while the minor QTL on chromosome 1 explained 11 and 8% in year 1 and 2, respectively. The SNP marker co-localized with the major QTL peak on chromosome 3 and its right flanking marker are positioned inside the predicted gene GRMZM2G122443 encoding a glucosidase II, and the left flanking marker inside the GRMZM2G140537 that encodes a protein tyrosine kinase. Moreover, within this QTL region there are also the GRMZM2G160902 and GRMZM2G122481 predicted genes, encoding a bZIP transcription factor and a cytochrome C oxidase, respectively. The colocalization with this major effect QTL suggests a putative involvement of these candidate genes with maize responses to SCMV resistance, but further functional studies are required for such validation. Our results provide resistance source and genomic target for marker-assisted breeding aiming the development of maize resistant cultivars to SCMV.
Keywords: Zea mays L.; Potyvirus; SNP markers; Genes; Tropical inbred lines.
QTL DE EFEITO MAIOR NO CROMOSSOMO 3 CONFERINDO AO MILHO RESISTÊNCIA AO SUGARCANE MOSAIC VIRUS
RESUMO - Sugarcane mosaic virus (SCMV), patógeno do milho epidêmico em todo o mundo, é o agente causal da doença mosaico comum, uma das mais importantes viroses da cultura no Brasil. Neste estudo, mapeamos e caracterizamos loci de características quantitativas (QTL) conferindo resistência ao SCMV em uma população de milho composta por 127 famílias F2: 3 obtida do cruzamento entre duas linhagens de milho brasileiras, L18 (resistente) × L19 (suscetível). Ensaios de campo foram conduzidos em dois anos empregando avaliação fenotipica por meio do escore de resistência, após inoculação artificial das famílias F2:3. Os QTLs foram identificados por meio do mapeamento por intervalo composto, usando um mapa de ligação baseado em 82 SSRs, 3 CAPS e 296 SNPs. As herdabilidades variaram de 73,68 a 95,16% e os QTLs de resistência ao SCMV foram consistentemente identificados nos cromossomos 1 e 3, com efeitos menor e maior, respectivamente. O QTL de efeito maior no cromossomo 3 explicou 50 e 70% da variação genética nos anos 1 e 2, respectivamente, enquanto o QTL de efeito menor no cromossomo 1 explicou 11 e 8% nos anos 1 e 2, respectivamente. O SNP co-localizado com o pico do QTL de efeito maior no cromossomo 3 e seu marcador flanqueador à direita estão posicionados dentro do gene predito GRMZM2G122443, codificando uma glucosidase II, e o marcador flanqueando à esquerda do QTL está dentro do gene predito GRMZM2G140537 que codifica uma proteína tirosina quinase. Além destes, na região do QTL estão também localizados os genes preditos GRMZM2G160902 e GRMZM2G122481, que codificam um fator de transcrição bZIP e uma citocromo C oxidase, respectivamente. A colocalização com o QTL de maior efeito sugere o envolvimento desses genes candidatos com a resposta do milho à resistência ao SCMV. Entretanto, mais estudos adicionais são necessários para a validação funcional desses genes. Nossos resultados fornecem uma fonte de resistência e uma regiâo genômica alvo para a seleção assistida visando o desenvolvimento de cultivares de milho resistentes ao SCMV.
The common mosaic is one of the most important viral diseases affecting maize in Brazil. Six species of potyvirus have been reported as causing mosaic in various cereals and grasses worldwide, including:
Sugarcane mosaic virus (SCMV), Sorghum mosaic virus (SrMV), Maize dwarf mosaic virus (MDMV), Johnsongrass mosaic virus (JGMV) (Shukla et
al., 1994), Zea mosaic virus (ZeMV) (Sheifers et al., 2000), and Pennisetum mosaic virus (PenMV) (Deng et al., 2008). In Brazil, SCMV was identified as the causal agent of common mosaic in maize and sorghum, which constitutes a monophyletic group distinct from the others SCMV strains, identified worldwide (Souza et al., 2012). Recently, the JGMV potyvirus was identified as another causal agent of mosaic in sorghum (Souza et al., 2017). In this study, among the grass species tested for resistance to the JGMV Brazilian isolate, Sorghum verticilliflorum and Euchalena mexicana were susceptible and no five maize inbred lines were infected, including our L18 source of the SCMV resistance. Maize aphid
Rhopalosiphum maidis (Hemiptera: Aphididae)
(Fitch, 1856) is the most efficient transmission vector of the SCMV (Shukla et al., 1994), and in Brazil is found mainly in regions where sorghum and maize are grown on the second maize cropping season (off-season or Safrinha), which is sown from January to March, causing economic damages (Goussain, 2001; Cruz et al., 2010). These viruses can reduce the maize production by up to 50% (Waquil et al., 1996), and the use of resistant cultivars is one of the most efficient practices to control viral diseases (Rott et al., 2015).
Sources of resistance to SCMV have been identified in different maize germplasm via distinct genetic studies, including European lines D21, D32, and FAP1360A (Kuntze et al., 1995), the U.S. line Pa 405 (Jones et al., 2011), the Chinese line Hyangzao4
(Zhang et al., 2003), and the Brazilian lines L18 and L520 (Souza et al., 2008). SCMV resistance in these European maize lines is controlled by two to three genes, mapped on chromosomes 6 (Scmv1) and 3 (Scmv2) (Melchinger et al., 1998). QTL analyses using a mapping population comprised of 219 F3 families, derived from crossing the lines D32 (resistant) and D145 (susceptible), identified five QTLs on chromosomes 1, 3 5, 6 and 10. Moreover, QTL analyses using a Chinese mapping population consisting of 184 F3 families derived from a cross between Huangzao4 (resistant) and Ye107 (susceptible) identified three to five QTLs on chromosomes 1, 3, 5, 6 and 10, depending on the plant developmental stage (Zhang et al., 2003). Major QTLs conferring resistance to SCMV were consistently mapped on chromosomes 3 and 6 in different mapping populations (Xia et al., 1999; Souza et al., 2008; Tao et al., 2013; Leng et al., 2015; Gowda et al., 2018; Wu et al., 2007). However, the majority of these studies were performed in temperate germplasm, for this reason it is important to detect QTLs associated to SCMV resistance in tropical maize germplasm. The identification of major QTLs conferring resistance to SCMV is an important step for the development of maize resistant genotypes. Thus, the main goal of this study was to map genomic regions associated with SCMV resistance in a tropical biparental population.
Materials and methods Mapping population
The mapping population was obtained by crossing two tropical maize inbred lines contrasting for resistance to mosaic, L18 (resistant) and L19 (susceptible). These lines belong to the maize breeding program of Embrapa Maize and Sorghum, Brazil.
Revista Brasileira de Milho e Sorgo, v.18, n.3, p. 322-339, 2019 Versão on line ISSN 1980-6477 - http://www.abms.org.br
The F1 hybrids were self-pollinated, generating 127 F2 individuals.
Experimental design
The F2:3 families, obtained from selfing of each F2 individuals, the parental lines and F1 hybrids were evaluated in the field in a randomized complete block design with two replications in two different years, year 1 and year 2. Each F2:3 family was represented by a 3 m row and 0.80 m apart, which were overplanted and thinned to 15 plants per row. The experiments were conducted in the experimental area of Embrapa Maize and Sorghum in Sete Lagoas, State of Minas Gerais - Brazil, in a Dystroferric Red Latosol with a very clayey texture (Panoso et al., 2002). Fertilization at sowing, based on the soil fertility analyses, was 400 kg ha-1 of the 08-28-16 NPK+Zn. The nitrogen
top dress fertilization was applied at the V5-V6 plant stage with 60 kg ha-1 of the N.
In both years, the experiments received supplemental irrigation, which was managed using an electronic spreadsheet that calculates the soil water balance daily (Albuquerque & Andrade, 2001). The weather data were downloaded from an automatic climatological station located in the experimental area of Embrapa Maize and Sorghum, while the crop coefficient and cycle duration for maize were obtained from the literature (Allen et al., 1998). Soil water retention data from nearby experimental areas were also input into the spreadsheet, which indicates the day and the amount of irrigation to be applied.
SCMV inoculation and phenotypic evaluation
Plants of the maize inbred line, L19, susceptible to SCMV were conducted in pots in a greenhouse
6 ij j i ij
g
b
y
where
y
ijis the av
i
in block
j
;
g
iis the random genetic effect of the F
2:3progeny
i
,
following a normal distribution with mean zero and variance
2 g
;
b
jis the fixed effect
of the
j
thblock; and
ijis the experimental error, assuming a normal distribution with
mean zero and variance
2
.
ijy
i
j
g
i 2 gσ
b
ji
thj
ε
ij 2 εσ
and inoculated with SCMV, as described below. After disease symptoms expression, the leaves were collected for inoculum preparation. The inoculum solution was prepared at a ratio of 1:3 (weight/ volume) using leaves from these plants at V8 stage macerated in cooled phosphate buffer (10 mM, pH 7.0) (Souza et al., 2008). Carborundum 600 mesh (Sigma-Aldrich) was added to the inoculum solution, which was kept on ice throughout the inoculation process at field condition. The parental lines, F1 individual and the F2:3 families had the first inoculation performed when the seedlings had three to four leaves rubbing the inoculum in the middle to the basal part of the two youngest leaves, following two more inoculations with a week interval. Phenotypic evaluations initiated one week after the first inoculation and repeated weekly for three times in year 1 and five times in year 2. Phenotypes were evaluated for the presence (susceptible) or absence (resistance) of mosaic symptoms. A resistance score was calculated for each F2:3 progeny as the ratio (%) between the number of resistant plants and the total number of plants in the row.
The phenotypic data were taken at three defined periods during disease development to verify the QTL expression during the cropping cycle. Phenotypic data analyses were performed individually for each evaluation point within year, using the following mixed model:
where is the average phenotypic value of the F2:3 progeny in block ; is the random genetic effect of the F2:3 progeny , following a normal distribution with mean zero and variance ; is the fixed effect of the block; and is the experimental error, assuming a normal distribution with mean zero and variance . Generalized heritabilities (h, Cullis et al., 2006), coefficients of experimental variation and
the correlation between evaluations across years were estimated using the software GenStat v. 19 (VSN International, 2017). Adjusted means per genotype for each evaluation point were obtained through the above model, considering a fixed genetic effect of F2:3 progenies.
DNA extraction and genotyping
Genomic DNA was extracted from the leaves of the parental lines, L18 and L19, F1 and F2 individuals (Saghai-Maroof et al., 1984). The parental lines and the F1 hybrid were genotyped with simple-sequence repeat (SSR) markers, and polymorphic SSR were genotyped in the 127 F2 individuals. The SSR sequences were obtained from the Maize Genetic and Genomic Data base (https://www.maizegdb.org/) and polymerase chain reaction (PCR) was performed according to Ninamango-Cárdenas et al. (2003). SNP genotyping was performed by LCG Genomics (Hoddesdon, UK) using the KASP assay system. Polymorphic markers between the parental lines were used to genotype the population.
Development of RGA-tagged markers
Predicted RGA-encoded proteins previously identified in the maize genome (Lana et al., 2017), were physically located around the SCMV resistance QTLs using the MaizeGDB (http:// www.maizegdb.org/data_cen-ter/locus), Gramene (http://ensembl.gramene.org/ Zea_mays/Info/ Index), and Phytozome v10.3 (https://phytozome. jgi.doe.gov/pz/portal.html) databases. A total of 13 maize RGAs predicted around the SCMV resistance QTL on chromosome 3 were selected
for further analysis. Primers were designed using Primer3Plus software (http://www.bioinformatics. nl/cgi-bin/primer3plus/primer3plus.cgi) to search for polymorphisms between parental lines. In addition, molecular markers developed for fine mapping of Rscmv2, a major region for resistance to sugarcane mosaic virus in temperate maize (Ding et al., 2012), were tested.
PCR assays were performed in a total volume of 20 µL containing 30 ng of DNA, 1.5 U of Taq DNA Polymerase (Invitrogen, USA), 1x buffer, 2 mM MgCl2, 0.125 mM deoxynucleotides, 4% (v/v) DMSO and 0.5 µM each primer. The amplification profile was 95°C for 2 min; followed by 40 cycles of 94°C for 1 min, 55°C for 30 sec, and 72°C for 1 min; and, finally, an elongation step of 72°C for 5 min. The amplification products were purified using the QIAquick GelExtraction Kit (Qiagen, Hilden, Germany) and sequenced using the BigDye Terminator Cycle Sequencing Kit (Life Technologies, USA). Sequences were confirmed using BLASTN searches (Altschul et al., 1997) at the National Center for Biotechnology Information (http://www.ncbi.nlm.nih.gov). All sequences were aligned using Sequencher 4.1.4 software (Gene Codes Corp, USA). The single nucleotide polymorphisms were converted into cleaved amplified polymorphic sequences (CAPS) markers, using an online tool to select the restriction sites (http://nc2.neb.com/NEBcut-ter2/). After the amplification reaction, the PCR products were digested with 5 U of the selected restriction enzymes in a final volume of 10 µL. The fragments were separated on 2% (w/v) agarose gel and visualized using GelRed Nucleic Acid Gel Stain (Biotium, USA). Polymorphic markers were genotyped in the F2 population and mapped.
covariates that reflect the QTL genotypic composition at a specific chromosome position (Lynch & Walsh, 1998), were calculated at every 2.0 cM, based on the conditional probabilities estimated according to the observed genotypes of the QTL flanking markers. The residual unexplained genetic and environmental effects were modelled as EGij, which assumed to follow a multivariate normal distribution with mean-vector zero and variance-covariance matrix G, the last with a factor analytic structure of order two. Each independent QTL observed peak was considered as a putative QTL, considering a genome-wide threshold of and the Li and Ji (2005) correction for multiple tests in the QTL search. Finally, a multi-QTL mapping model was built to estimate the QTL effects and the proportion of the genetic variance explained by each individual QTL and by all QTLs in the model.
Results Phenotypic data
Comparing the climate conditions between years for the period from sowing to the first phenotypic evaluation of the F2:3 families, the maximum, minimum and average temperatures were lower in year 2 (Figure S1). However, after this point up to the last phenotypic evaluation, the daylight length and the maximum, minimum and average temperatures decreased in year 1 and maintained higher and constant in year 2.
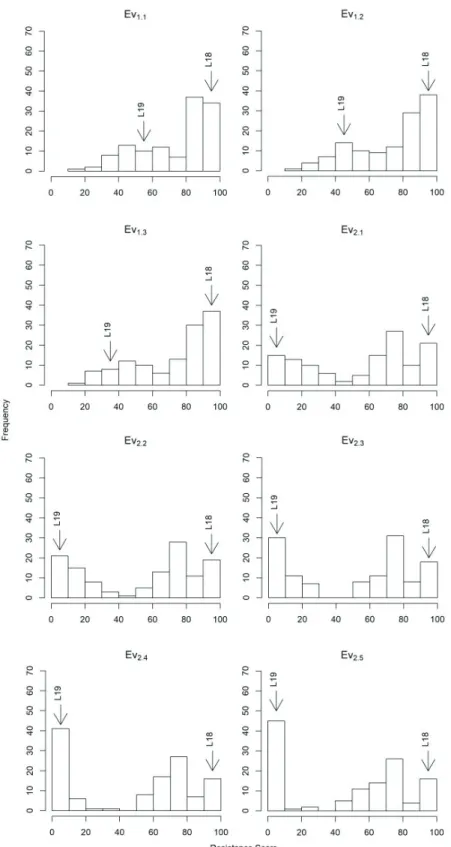
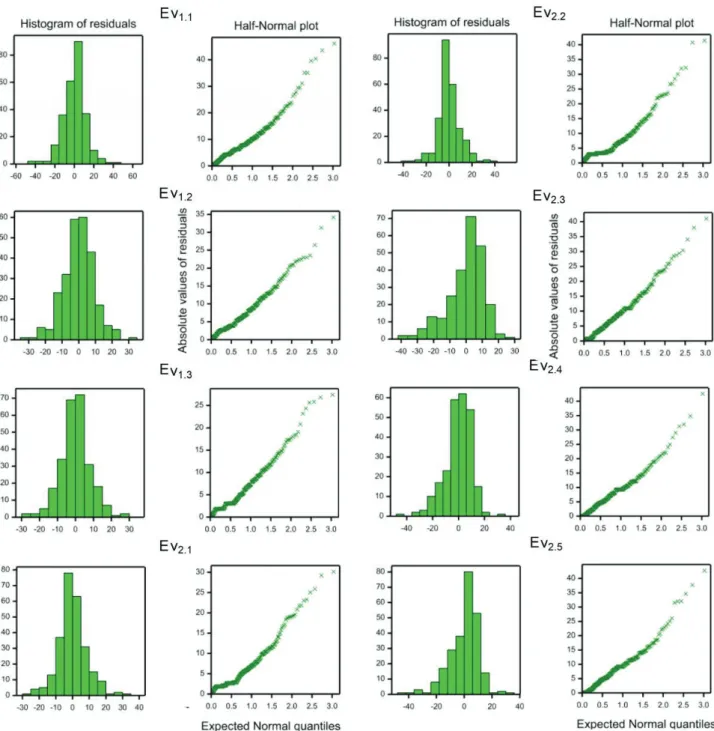
Phenotypes were not normally distributed (Figure1), however, the residuals of the phenotypic fitted models followed a normal distribution in both years, for all evaluation points (Figure S2). The resistance score presented a decrease in the frequency of resistant plants from the first to the last phenotypic evaluation (EV) in both years (Figure1). The decrease
if
xa
x
aiwiw
x
δLinkage mapping
Each marker locus was checked for deviations from a Mendelian segregation ratio of 1:2:1, using a Chi-square ( ) test for goodness-of-fit ( ), considering the Bonferroni correction for multiple tests. Linkage analysis was performed in the software OneMap (Margarido et al., 2007), based on a multipoint approach, considering a minimum log10 odds ratio (LOD) of 6.0 and a maximum recombination frequency of 0.35. Map distances were expressed in centiMorgans (cM) based on the Kosambi function (Kosambi, 1944).
QTL mapping
A genome-wide QTL scan, using a composite interval mapping (CIM), was performed in the software GenStat, such as described by Malosetti et al. (2004) and Boer et al. (2007). For this, each evaluation point within year was considered as a distinct environment. In this context, the following mixed model was considered:
where is the phenotypic value of the F2:3 progeny i in environment j ; Ej is the fixed effect of environment
j ; F is a set of marker cofactors, selected in a previous
simple interval mapping scan; and are the additive genetic predictors of genotype i at the cofactor positions and at the tested QTL position w, respectively, with associated environment-specific additive fixed effects denoted by ajf and ajw for cofactors and tested QTL position, respectively;
if
xδ and are dominance genetic predictors of
genotype i at the cofactor positions and at the tested QTL position w , respectively, with associated environment-specific dominance fixed effects
jf
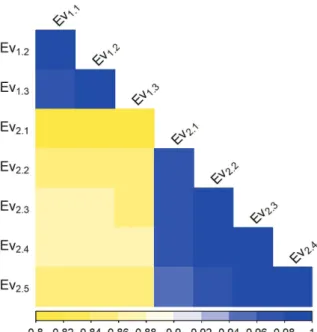
in the resistance score was more accentuated in year 2 with the frequency in the 0-10 class going from 15 to 45 from the first to the final phenotypic evaluation. Thus, the disease symptoms were less severe in year 1 (EV1.3) than in year 2 (EV2.5), with high frequency of the resistance score in the 90-100 and 0-10 class, respectively. In spite of the differences in disease severity, the phenotypic evaluations between years presented high correlation ranging from 0.8 to 0.88 (Figure 2).
The broad-sense heritability coefficients and the genetic variances were higher in year 2 than year 1 (Table 1), with the heritability values ranging from 73.68 to 79.30 and from 87.71 to 95.16, and genetic variances ranging from 355,30 to 451,20 and from 920,30 to 1326,70, for years 1 and 2, respectively. The high heritability values indicate that most of the phenotypic variance is explained by the genetic variability. Between years, the residual variances were very similar, however in year 2 the higher symptoms severity resulted in a higher percentage of the genetic variance contributing to the phenotypic variance.
Genetic linkage map
Three hundred and eight one markers, composed by 82 SSR, 3 CAPS and 296 SNPs, distributed over 10 chromosomes, with an average of 38 markers per chromosome, showed the expected Mendelian segregation (1:2:1) and were used for the genetic map construction and QTL analyses. Genetic mapping analysis of the 127 F2 individuals resulted in the identification of 10 linkage groups, spanning 1836.35 cM with an average distance between markers of 4.82 cM (Figure 3).
QTL Mapping for resistance to SCMV
The SCMV resistance QTLs were identified by a composite interval mapping (CIM), considering the resistance score evaluation points across years as distinct environments (Table 2 and Figure 4). In both years, a major QTL was consistently mapped on chromosome 3 and a minor QTL on chromosome 1 at PZA00413_18 and PHM13619_5 SNP marker
Figure S1. Daily climate conditions in the period from sowing to the last phenotypic evaluations of the F2:3
Figure 1. Frequency distribution of the SCMV score resistance means of 127 F2:3 families and their parental lines in three phenotypic evaluations in year 1 (Ev1.1 to Ev1.3) and five evaluations in year 2 (Ev2.1 to EV2.5). Parental lines L18 (resistant) and L19 (susceptible) are indicated by black arrows.
Figure S2. Histograms of residuals and Normal probability plot of the residuals in Year 1 (Ev1.1 to Ev1.3) and Year 2 (Ev2.1 to EV2.5).
Figure 2. Correlation among the phenotypic evaluations of the F2:3 families across year 1 (Ev1.1 to Ev1.3) and year 2 (Ev2.1 to EV2.5).
Resistance Score
Year Evaluation h2 V
g Vr Min Max Mean L18 L19
1 73.68 355.30 215.10 19.85 100.00 74.15 100.00 55.15 1 2 79.08 428.20 183.30 16.46 100.00 73.54 100.00 45.59 3 79.38 451.20 195.20 16.46 100.00 73.07 100.00 39.71 1 87.71 920.30 257.80 0.00 100.00 56.21 100.00 8.89 2 92.83 1086.60 167.80 0.00 100.00 53.31 100.00 5.56 2 3 95.03 1252.90 131.10 0.00 100.00 50.03 100.00 5.56 4 95.16 1326.70 135.10 0.00 100.00 47.59 100.00 0.00 5 93.03 1267.20 189.90 0.00 100.00 45.66 100.00 0.00
Table 1. Estimates of the heritability, genetic and residual variances, minimum, mean and maximum values of
Figure 3. Linkage map constructed for the 127 F2 genotyped individuals, showing 10 linkage groups, one per chromosome. Molecular marker names are on the right side while the cumulative map distances in centimorgans (cM) are shown on the left side of the linkage groups bars.
Y.E1 Chr2 Locus ID 3 (Physical position in (Mbp)4 Flanking markers5 Confidence intervals6 (Mbp) QTL
Effects7 Explained Genetic Variances8
a d d/a EVI 1.1 1 PH M13619_5 (22, 25) PZ A 00887_1 PH M3226_15 10,96 - 22,58 6.19 6.65 1.1 0.11 1.2 7.13 5.50 0.8 0.11 1.3 6.17 7.52 1.2 0.11 2.1 3.05 5.82 1.9 0.03 2.2 5.84 8.11 1.4 0.08 2.3 6.62 10.08 1.5 0.10 2.4 5.59 10.00 1.8 0.08 2.5 5.98 11.48 1.9 0.11 1.1 3 PZ A 00413_18 (128,9 3) PH M15449_1 0 PZ A 00413_20 128,82 - 128,93 16.60 13.59 0.8 0.51 1.2 18.13 14.00 0.8 0.52 1.3 18.12 14.39 0.8 0.50 2.1 32.32 20.64 0.6 0.70 2.2 32.52 23.89 0.7 0.70 2.3 34.14 25.13 0.7 0.70 2.4 35.25 25.80 0.7 0.70 2.5 35.80 24.02 0.7 0.70
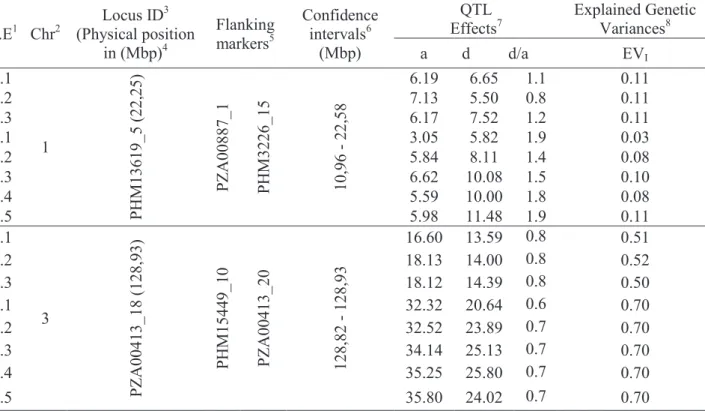
Table 2. Chromosomal physical position in base pair (bp) and parameters of the quantitative trait loci (QTL)
identified for the SCMV resistance using a composite interval mapping (CIM) strategy for multi-environment trials (MET), over two years.
1The first number refer to the year and the second to the phenotypic evaluation point within year; 2Chr: Chromosome; 3position of
QTL; 5QTL flanking markers, PZA00887_1 and PHM3226, and PHM15449_10 andPZA00413_20, respectively, chromosome 1 and
3;4physical position of the SNP marker in the chromosome, in Mega base pair (Mbp); ,6confidence interval of the QTL location in mega
base pair (Mbp); 7a is the estimated additive effects, d is the estimated dominance effects and is the QTL degree of dominance; 8Genetic
variance explained by the QTL; underlined numbers means not significant. positions, respectively. The major and minor effect QTLs had confidence intervals with extension of the 0,11 and 11,62 Mbp, respectively. The major QTL on chromosome 3 presented significant additive and dominance effects, with a putative partial dominance
gene action ( ) The minor QTL on
chromosome 1 showed a more significant dominance effect, suggesting an overdominance gene action ( ). The major QTL on chromosome 3 explained
a large proportion of the genetic variance, being 50% for evaluations in year 1, and 70% for evaluations in year 2. The minor QTL effect on chromosome 1 explained a small proportion of the genetic variance, 11%. However, this minor QTL effect was not significant in the first evaluation of year 2. RGAs and the Rscmv2 markers, although been polymorphic between parental lines, mapped outside the region of our major QTL.
Discussion
Common mosaic is among the most important viral diseases affecting maize in Brazil. Under favorable environmental conditions for the pathogen development, decreases in the production can reach up to 50% (Waquil et al., 1996). In this study, the mosaic symptoms expression presented a slight difference between years, with a higher disease severity observed in year 2 for the L19 (susceptible
parent) and F2:3 families. Although we had in both
years the same condition for inoculum preparation,
the difference in the symptoms severity from year 1 to year 2 could be due climate differences. For example, daylight length, maximum, minimum and average temperatures showed more stable and higher values in year 2 than year 1 at the phenotypic evaluation dates (Figure S1). Probably, the climate conditions interfered in the disease severity across years (Figures 1 and S1), since plant viruses are strongly influenced by weather, and the temperature affects the efficiency of pathogen multiplication (Jones & Barbetti, 2012; Hooda et al., 2016; Kovács et al., 1996). Although the differences observed in these environmental
Figure 4. QTLs resistance to SCMV identified by a composite interval mapping (CIM), within years and
across evaluation points. Additive effects in yellow-red colors come from resistant parent and dominant effects are positive.
covariates, the phenotypic correlations between years and also between evaluation points within years were high, resulting in consistent QTL detection across years (Figure 2 and Table 2).
In addition to the genotype-by-environment interaction, the reproducibility of phenotyping is among the factors that most affect QTL mapping for disease resistance across distinct environments (Yang et al., 2012). In this study, the phenotyping reproducibility was consistent across years, resulting in the identification of two consistent SCMV resistance QTLs across years, based on a
F2:3 populations derived from the cross between L18
and L19, resistant and susceptible Embrapa’s maize inbred lines, respectively. The QTLs were mapped on chromosomes 1 and 3, showing minor and major effects in the SCMV resistance, respectively. The QTL on chromosome 1 explained 11 and 8% of the genetic variance observed in years 1 and 2, respectively, while the QTL on chromosome 3 explained 51 and 70% of the genetic variance observed in years 1 and 2, respectively. The favorable alleles for these QTLs were donated from L18, indicating that this inbred line is an important source of resistance to SCMV in Brazil.
Our major QTL for SCMV resistance on chromosome 3 was flanked by PZA00413-20, which also flanked a QTL associated with maize streak virus resistance (Arusei et al., 2019), and with maize lethal necrosis resistance (Gowda et al., 2018) in two different maize populations. These results confirm the importance of this region for viral disease resistance in maize. Furthermore, Zambrano et al. (2014) mapped resistance QTLs for five different viruses within a physical interval of 57,66 to 161,26 Mpb at chromosome 3, which overlaps with our major SCMV resistance QTL region (128,82 - 128,93 Mbp),
but in a much smaller interval. In previous study, Souza et al. (2008) identified three SCMV resistance
QTLs, based on a F2:3 mapping population derived
from a cross between two contrasting tropical maize inbred lines for SCMV resistance, L520 (resistant) and L19 (susceptible). From these QTLs, one minor QTL was mapped on chromosome 6 and two were mapped on chromosome 3, but at different physical positions to our major resistance QTL. Other studies have already reported QTLs on chromosomes 1, 3 and 6 for different virus resistance, using distinct maize populations (Ding et al., 2012; Ingvardsen et al., 2007; Jones et al., 2018; Melchinger et al., 1998; Tao et al., 2013; Xia et al., 1999; Wu et al., 2007; Zambrano et al., 2014; Zhang et al., 2003).
Based on allelism tests, using F2 individuals derived from the crosses L520 x L19 and L18 x L19, Schuelter et al. (2003) identified segregation ratios of 3:1 resistant to susceptible individuals within each F2 population, indicating the existence of one gene with complete dominance controlling the SCMV resistance. Whereas the F2 individuals derived from the cross between the resistant lines L18 and L520 presented a segregation ratio of 15:1 resistant to susceptible individuals, indicating the existence of two possible independent genes with complete dominance controlling the SCMV resistance. These allelism tests demonstrated the existence of different genes conferring resistance in L18 and L520. However, the inbred line L520 and the F1 individual derived from the cross L520 x L19 presented some SCMV susceptibility when exposed to high temperatures. Thus, Schuelter et al. (2003) suggested the existence of epistatic genes affecting the expression of the SCMV resistance gene present in L520, with variable effects according to the climate conditions. Due the relatively small number of F2 plants evaluated in their
segregation analysis, the number of QTLs identified in our study is probably more powerful.
For the major QTL mapped on chromosome 3, the SNPs sequences blasted against the Phytozome database (https://phytozome.jgi.doe.gov/pz/portal. html), Zea mays Ensembl-18) showed that the SNP markers PZA00413-18 and PZA00413-20 positioned inside the predicted gene GRMZM2G122443, whereas PHM15449-10 mapped within GRMZM2G140537.
The GRMZM2G122443 is localized at 128,92 Mbp
on chromosome 3 and encodes a glucosidase II beta subunit-like protein domain, and GRMZM2G140537,
localized at 128,82 Mbp, encodes a protein
tyrosine kinase. This QTL region also includes
GRMZM2G160902 and GRMZM2G122481
predicted genes. The GRMZM2G160902 is an intronless gene that encodes a bZIP transcription factor, and GRMZM2G122481 encodes a cytochrome C oxidase subunit 5C-2. Jeffares et al. (2008) verified fewer introns in genes that are rapidly regulated during stress.
The basic leucine zipper (bZip) proteins regulate numerous biological processes, among them stress signaling and pathogen defense, and in maize belongs to one of the major family (Wei et al., 2012). In plants, β-glucosidases has many functions, among them defense against biotic stresses (Jones et al., 2000). The natural substrates of
β-glucosidases include cyanogenic and hydroxamic
acid β-glucosides of plant secondary metabolism and b-linked oligosaccharides from the digestion of plant cell walls during germination (Conn, 1981; Cuevas et al., 1992; Leah et al., 1995). Due the wide range of glucosides of unknown functions found in plants suggests that many β-glucosidase functions need to be discovered (Seshadri et al., 2009). Plant protein kinases are defined as enzymes that use the
δ-phosphate of adenosine triphosphate (ATP) to phosphorylate serine, threonine or tyrosine residues in protein (Hanks & Hunter, 1995). Plant protein kinases have been found to be components of signaling networks such as the perception of biotic agents, light quality and quantity, plant hormones, and various adverse environmental conditions
(Lehti-Shiu et al., 2009). These putative candidate genes
identified in the major effect QTL region provide targets for further research to analyze their possible relationship in SCMV resistance.
Conclusions
Maize is a very significant crop and the common mosaic is one of the most important viral disease affecting the culture in Brazil and worldwide. In this study, the major QTL identified on chromosome 3 conferring maize resistance to Sugarcane mosaic virus, and explaining a very large proportion of the
genetic variance, 50 to 70%, are a useful resource for
maize improvement to develop new resistant cultivars to Sugarcane mosaic virus. Also, the putative candidate genes identified in this new major QTL region can be targets for future functional studies.
Acknowledgments
The authors would like to express their gratitude to Célio Ramos das Neves for his assistance in field work. This work had the financial support from Embrapa.
References
ALBUQUERQUE, P. E. P. de; ANDRADE, C. de L. T. de. Planilha eletrônica para a programação da
Milho e Sorgo, 2001. 14 p. (Embrapa Milho e Sorgo. Circular Técnica, 10).
ALLEN, R. G.; PEREIRA, L. S.; RAES, D.; SMITH, M.
Crop evapotranspiration: guidelines for computing crop
water requirements. Rome: FAO, 1998. (Irrigation and drainage paper, 56).
ALTSCHUL, S. F.; MADDEN, T. L.; SCHAFFER, A. A.; ZHANG, J.; ZHANG, Z.; MILLER, W.; LIPMAN, D. J. Gapped BLAST and PSI-BLAST: a new generation of protein database search programs. Nucleic Acids
Research, v. 25, n. 17, p. 3389-3444, 1997.
DOI: 10.1093/nar/25.17.3389.
ARUSEI, P.; RUNO, S.; WARIGIA, M.; NGETICH, A.; LELEY, P. Quantitative trait loci analysis of maize (Zea mays L.) for maize streak virus resistance. Journal of
Experimental Agriculture International, v. 33, n. 4,
article JEAI.41121, 2019.
DOI: 10.9734/jeai/2019/v33i430151.
BOER, M. P.; WRIGHT, D.; FENG, L.; PODLICH, D. W.; LUO, L.; COOPER, M.; VAN EEUWIJK, F. A. A mixed-model quantitative trait loci (QTL) analysis for multiple-environment trial data using multiple-environmental covariables for QTL-by-environment interactions, with an example in maize. Genetics, v. 177, n. 3, p. 1801-1813, 2007.
DOI: 10.1534/genetics.107.071068.
CHUNG, B. N.; CHOI, K. S.; AHN, J. J.; JOA, J. H.; DO, K. S.; PARK, K.-S. Effects of temperature on systemic infection and symptom expression of turnip mosaic virus in Chinese cabbage (Brassica campestris). Plant Pathology
Journal, v. 31, n. 4, p. 363-370, 2015. DOI: 10.5423/PPJ.NT.06.2015.0107.
CONN, E. E. Cyanogenic glycosides. In: STUMPF, P. K.; CONN, E. (Ed.). The biochemistry of plants: a comprehensive treatise. New York: Academic Press, 1981. p. 479-500. (Secondary Plant Products, v. 7).
CRUZ, J. C.; SILVA, G. H. da; PEREIRA FILHO, I. A.; GONTIJO NETO, M. M.; MAGALHÃES, P. C. Caracterização do cultivo de milho safrinha de alta
produtividade em 2008 e 2009. Revista Brasileira de
Milho e Sorgo, v. 9, n. 2, p. 177-188, 2010.
DOI: 10.18512/1980-6477/rbms.v9n2p177-188.
CUEVAS, L.; NIEMEYER, H. M.; JONSSON, L. M. V. Partial purification and characterization of a hydroxamic acid glucoside b-glucosidase from maize. Phytochemistry, v. 31, n. 8, p. 2609-2619, 1992.
DOI: 10.1016/0031-9422(92)83595-P.
CULLIS, B. R.; SMITH, A. B.; COOMBES, N. E. On the design of early generation variety trials with correlated data.
Journal of Agricultural, Biological, and Environmental Statistics, v. 11, article 381, 2006.
DOI: 10.1198/108571106X154443.
DENG, C. L.; WANG, W. J.; WANG, Z. Y.; JIANG, X.; CAO, Y.; ZHOU, T.; WANG, F. R.; LI, H. F.; FAN, Z. F. The genomic sequence and biological properties of Pennisetum mosaic virus, a novel monocot-infecting potyvirus. Archives of Virology, v. 153, n. 5, p. 921-927, 2008. DOI: 10.1007/s00705-008-0068-z.
DING, J.; LI, H.; WANG, Y.; ZHAO, R.; ZHANG, X.; CHEN, J.; XIA, Z.; WU, J. Fine mapping of Rscmv2, a major gene for resistance to sugarcane mosaic virus in maize. Molecular Breeding, v. 30, n. 4, p. 1593-1600, 2012.
DOI: 10.1007/s11032-012-9741-8.
GOUSSAIN, M. M. Efeito da aplicação do silício em
plantas de milho no desenvolvimento biológico da lagarta-do-cartucho Spodoptera frugiperda (J. E. Smith, 1797) e do pulgão-da-folha Rhopalosiphum
maidis (Fitch, 1856) (Hemiptera: Aphididae). 2001. 64 p. Dissertação (Mestrado em Entomologia) - Universidade Federal de Lavras, Lavras, 2001.
GOWDA, M.; BEYENE, Y.; MAKUMBI, D.; SEMAGN, K.; OLSEN, M. S.; BRIGHT, J. M.; DAS, B.; MUGO, S.; SURESH, L. M.; PRASANNA, B. M. Discovery and validation of genomic regions associated with resistance to maize lethal necrosis in four biparental populations.
Molecular Breeding, v. 38, n. 5, article 66, 2018. DOI: 10.1007/s11032-018-0829-7.
HANKS, S. K.; HUNTER, T. Protein kinases 6. The eukaryotic protein kinase superfamily: kinase (catalytic) domain structure and classification. FASEB Journal, v. 9, n. 8, p. 576-596, 1995. DOI: 10.1096/fasebj.9.8.7768349.
HOODA, K. S.; SINGH, V.; BAGARIA, P.; GOGO, R.; KUMAR, S.; SHEKHAR, M. Emerging biotic constraints to maize production in the global climate change- an overview. Maize Journal, v. 5, n. 1/2, p. 1-13, 2016.
INGVARDSEN, C.; SCHEJBEL, B.; LÜBBERSTEDT, T. Functional markers for disease resistance in plants.
Progress in Botany, v. 69, p. 61-87, 2007.
JEFFARES, C.; PENKETT, C. J.; BÄHLER, J. Rapidly regulated genes are intron poor. Trends Genetics, v. 24, n. 8, p. 375-378, 2008.
DOI: 10.1016/j.tig.2008.05.006.
JONES, M. W.; BOYD, E. C.; REDINBAUGH, M. G. Responses of maize (Zea mays L.) near isogenic lines carrying Wsm1, Wsm2, and Wsm3 to three viruses in the Potyviridae. Theoretical and Applied Genetics, v. 123, n. 5, p. 729-740, 2011.
DOI: 10.1007/s00122-011-1622-8.
JONES, M. W.; PENNING, B. W.; JAMANN, T. M.;
GLAUBITZ, J. C.; ROMAY, C.; BUCKLER, E. S.; REDINBAUGH, M. G. Diverse chromosomal locations
of quantitative trait loci for tolerance to maize chlorotic mottle virus in five maize populations. Phytopathology, v 108, n. 6, p. 748-758, 2018.
DOI: 10.1094/PHYTO-09-17-0321-R.
JONES, P. R.; ANDERSEN, M. D.; NIELSEN, J. S.; HOJ, P. B.; MOLLER, B. L. The biosynthesis, degradation, transport and possible function of cyanogenic glucosides. In: ROMEO, J. T.; IBRAHIM, R.; VARIN, L.; DE LUCA, V. (Ed.). Evolution of metabolic pathways. New York: Elsevier Science, 2000. p. 191-247.
JONES, R. A. C.; BARBETTI, M. J. Influence of climate change on plant disease infections and epidemics caused by viruses and bacteria. CAB Reviews, v. 7, n. 22, p. 1-31, 2012.
DOI: 10.1079/PAVSNNR20127022.
KOSAMBI, D. D. The estimation of map distances from recombination values. Annals of Eugenics, v. 12, n. 1, p. 172-175, 1944.
DOI: 10.1111/j.1469-1809.1943.tb02321.x.
KOVÁCS, G. Y.; TOLDI, E.; GÁRBORJÁNYI, R.; VASDINYEI, R. Effect of postinoculation temperature treatments of corn to maize dwarf mosaic. Cereal Research
Communications, v. 24, n. 2, p. 187-193, 1996.
KUNTZE, L.; FUCHS, E.; GRUNTZIG, M.; SCHULZ, B.; HENNIG, U.; HOHMANN, F.; MELCHINGER, A. E. Evaluation of maize inbred lines for resistance to sugarcane mosaic virus (SCMV) and maize dwarf mosaic virus (MDMV). Agronomie, v. 15, p. 463-467, 1995.
DOI: 10.1051/agro:19950714.
LENG, P.; JI, Q.; TAO, Y.; IBRAHIM, R.; PAN, G.; XU, M.; LÜBBERSTED, T. Characterization of sugarcane mosaic virus Scmv1 and Scmv2 resistance regions by regional association analysis in maize. PLoS ONE, v. 10, n. 10, e0140617, 2015.
DOI: 10.1371/journal.pone.0140617.
LANA, U. G. de P.; SOUZA, I. R. P. de; NODA, R. W.; PASTINA, M. M.; MAGALHÃES, J. V.; GUIMARÃES, C. T. Quantitative trait loci and resistance gene analogs associated with maize white spot resistance. Plant Disease, v. 101, n. 1, p. 200-208, 2017.
DOI: 10.1094/PDIS-06-16-0899-RE.
LEAH, R.; KIGEL, J.; SVENDSEN, I.; MUNDY, J. Biochemical and molecular characterization of a barley seed b-glucosidase. Journal of Biological Chemistry, v. 270, n. 26, p. 15789-15797, 1995.
DOI: 10.1074/jbc.270.26.15789.
LEHTI-SHIU, M. D.; ZOU, C.; HANADA, K.; SHIU, S. H. Evolutionary history and stress regulation of plant receptor-like kinases/pelle genes. Plant Physiology, v. 150, p. 12-26, 2009. DOI: 10.1104/pp.108.134353.
LI, J.; JI, L. Adjusting multiple testing in multilocus analyses using the eigenvalues of a correlation matrix.
Heredity, v. 95, n. 3, p. 221-227, 2005.
DOI: 10.1038/sj.hdy.6800717.
LIM, C. H.; BAEK, W.; LIM, S.; HAN, S.-W.; LEE, S. C. Expression and functional roles of the pepper pathogen-induced bZIP transcription factor CabZIP2 in enhanced disease resistance to bacterial pathogen infection. Mol
Plant-Microbe Interactions, v. 28, n. 7, p. 825-833, 2015.
DOI: 10.1094/MPMI-10-14-0313-R.
LYNCH, M.; WALSH, B. Genetics and analysis of
quantitative traits. Sunderland: Sinauer Associates, 1998.
MALOSETTI, M.; VOLTAS, J.; ROMAGOSA, I.; ULLRICH, S. E.; VAN EEUWIJK, F. A. Mixed models including environmental covariables for studying QTL by environment interaction. Euphytica, v. 137, p. 139-145, 2004. DOI: 10.1023/B:EUPH.0000040511.46388.ef.
MARGARIDO, G. R. A.; SOUZA, A. P.; GARCIA, A. A. F. Onemap: software for genetic mapping in outcrossing species. Hereditas, v. 144, n. 3, p. 78-79, 2007.
DOI: 10.1111/j.2007.0018-0661.02000.x.
MELCHINGER, A.; KUNTZE, L.; GUMBER, R.; LÜBBERSTEDT, T.; FUCHS, E. Genetic basis of resistance to sugarcane mosaic virus in European maize germplasm. Theoretical and Applied Genetics, v. 96, n. 8, p. 1151-1161, 1998. DOI: 10.1007/s001220050851. NINAMANGO-CARDENAS, F. E.; GUIMARAES, C. T.; MARTINS, P. R.; PARENTONI, S. N.; CARNEIRO, N. P.; LOPES, M. A.; MORO, J. R.; PAIVA, E. Mapping QTLs for aluminum tolerance in maize. Euphytica, v. 130, n. 2, p. 223-232, 2003.
DOI: 10.1023/A:1022867416513.
PANOSO, L. A.; RAMOS, D. P.; BRANDÃO, M. Solos do
campo experimental da Embrapa Milho e Sorgo: suas
características e classificação no novo Sistema Brasileiro. Rio de Janeiro: Embrapa Solos, 2002. 92 p. (Embrapa Solos. Boletim de Pesquisa e Desenvolvimento, 5).
ROTT, P.; COMSTOCK, J. C.; GILBERT, R. A.; SANDHU, H. S. Sugarcane
mosaic. Gainesville: University of Florida, 2015. (IFAS
Extension SS-AGR-209).
SAGHAI-MAROOF, M. A.; SOLIMAN, K, A.; JORGENSEN, R. A.; ALLARD, R. W. Ribosomal DNA spacer length polymorphism in barley: Mendelian inheritance, chromosomal location and population dynamics. Proceedings of the National Academy of
Sciences of the United States of America, v. 81, n. 24, p.
8014-8018, 1984. DOI: 10.1073/pnas.81.24.8014. SESHADRI, S.; AKIYAMA, T.; OPASSIRI, R.; KUAPRASERT, B.; CAIRNS, J. K. Structural and enzymatic characterization of Os3BGlu6, a rice β-Glucosidase hydrolyzing hydrophobic glycosides and (1→3)- and (1→2)-linked disaccharides. Plant Physiology, v. 151, p. 47-58, 2009. DOI: 10.1104/pp.109.139436. SCHUELTER, A. R.; SOUZA, I. R. P. de; OLIVEIRA, E. de; GUIMARÃES, C. T. Controle genético da resistência ao mosaico comum em linhagens de milho tropical.
Revista Brasileira de Milho e Sorgo, v. 2, n. 3, p.
103-110, set./dez. 2003.
DOI: 10.18512/1980-6477/rbms.v2n3p103-110.
SHEIFERS, D. L.; SALOMON, R.; MARIE-JEANNE, V.; ALLIOT, B.; SIGNORET, P.; HABER, S.; LOBODA, A.; ENS, W.; SHE, Y. M.; STANDING, K. G. Characterization of a novel potyvirus isolated from maize in Israel.
Phytopathology, v. 90, n. 5, p. 505-513, 2000.
DOI: 10.1094/PHYTO.2000.90.5.505.
SHUKLA, D. D.; WARD, C. W.; BRUNT, A. A. The
Potyviridae. Cambridge: CAB, 1994.
SOUZA, I. R. P. de; BARROS, B. de A.; XAVIER, A. da S.; CARVALHO, S. G. M.; SABATO, E. de O.; GONÇALVES, I. A. M.; NODA, R. W.; RODRIGUES, J. A. S. Johnsongrass mosaic virus infecting sorghum in Brazil. International Journal of Current Research, v. 9, n. 12, p. 63415-63422, Dec. 2017.
SOUZA, I. R. P. de; GIOLITTI, F.; CARNEIRO, N. P.; LENARDON, S. L.; OLIVEIRA, E. de; GOMES, E. A.; NODA, R. W.; SOUZA, F. A. de. Sequence diversity in
coat protein of SCMV infecting maize and sorghum in Brazil. Revista Brasileira de Milho e Sorgo, v. 11, n. 2, p. 120-136, 2012.
DOI: 10.18512/1980-6477/rbms.v11n2p120-136. SOUZA, I. R. P.; SCHUELTER, A. R.; GUIMARÃES, C. T.; SCHUSTER, I.; OLIVEIRA, E.; REDINBAUGH, M. Mapping QTL contributing to SCMV resistance in tropical maize. Hereditas, v. 145, n. 4, p. 167-173, 2008.
TAO, Y. F.; JIANG, L.; LIU, Q. Q.; ZHANG, Y.; ZHANG, R.; INGVARDSEN, C. R.; FREI, U. K.; WANG, B. B.; LAI, J. S.; LUBBERSTEDT, T.; XU, M. L. Combined linkage and association mapping reveals candidates for Scmv1, a major locus involved in resistance to sugarcane mosaic virus (SCMV) in maize. BMC Plant Biology, v. 13, article 162, 2013.
DOI: 10.1186/1471-2229-13-162.
VSN INTERNATIONAL. GenStat for Windows. 18th ed. Hemel Hempstead, 2015. Disponível em: <https://www. vsni.co.uk/software/genstat/>. Acesso em: 12 ago. 2019.
XIA, X. C.; MELCHINGER, A. E.; KUNTZE, L.; LUBBERSTEDT, T. Quantitative trait loci mapping of resistance to Sugarcane mosaic virus in maize. Phytopathology, v. 89, n. 8, p. 660-667, 1999.
DOI: 10.1094/PHYTO.1999.89.8.660.
WAQUIL, J. M.; OLIVEIRA, E.; PINTO, N. F. J. A.; FERNANDES, F. T.; CORREA, L. A. Efeito na produção e incidência de viroses em híbridos comerciais de milho.
Fitopatologia Brasileira, v. 21, n. 4, p. 460-463, 1996.
WEI, K.; CHEN, J.; WANG, Y.; CHEN, Y.; CHEN, S.; LIN, Y.; PAN, S.; ZHONG, X.; XIE, D. Genome-wide analysis of bZIP-encoding genes in maize. DNA Research, v. 19, n. 6, p. 463-476, 2012.
DOI: 10.1093/dnares/dss026.
WU, L.; WANG, S.; CHEN, X.; WANG, X.; WU, L.; ZU, X.; CHEN, Y. Proteomic and phytohormone analysis of the response of maize (Zea mays L.) seedlings to sugarcane mosaic virus. Plos ONE, v. 8, n. 7, e70295, 2013.
DOI: 10.1371/journal.pone.0070295.
WU, J.; DING, J.; DU, Y.; XU, Y.; ZHANG, X. Genetic analysis and molecular mapping of two dominant complementary genes determining resistance to sugarcane mosaic virus in maize. Euphytica, v. 156, n. 3, p. 355-364, 2007. DOI: 0.1007/s10681-007-9384-8.
YANG, Q.; BALINT-KURTI, P.; XU, M. Quantitative disease resistance: dissection and adoption in maize.
Molecular Plant, v. 10, n. 3, p. 402-413, 2017. DOI: 10.1016/j.molp.2017.02.004.
YANG, Q.; ZHANG, D.; XU, M. A sequential quantitative trait locus fine-mapping strategy using recombinant-derived progeny. Journal of Integrative Plant Biology, v. 54, n. 4, p. 228-237, 2012.
DOI: 10.1111/j.1744-7909.2012.01108.x.
ZAMBRANO, J. L.; JONES, M. W.; BRENNER, E.; FRANCIS, D. M.; TOMAS, A.; REDINBAUGH, M. G. Genetic analysis of resistance to six virus diseases in a multiple virus-resistant maize inbred line. Theoretical and
Applied Genetics, v. 127, n. 4, p. 867-880, 2014.
DOI: 10.1007/s00122-014-2263-5.
ZHANG, S.; LI, X. H.; WANG, Z. H.; GEORGE, M. L.; JEFFERS, D.; WANG, F. G.; LIU, X. D.; LI, M. S.; YUAN, L. X. QTL mapping for resistance to SCMV in Chinese maize germplasm. Maydica, v. 48, n. 4, p. 307-312, 2003. ZHANG, Y.; LÜBBERSTEDT, T.; XU, M. The genetic and molecular basis of plant resistance to pathogens.
Journal of Genetics and Genomics, v. 40, n. 1, p. 23-35,