www.nat-hazards-earth-syst-sci.net/16/371/2016/ doi:10.5194/nhess-16-371-2016
© Author(s) 2016. CC Attribution 3.0 License.
Spatial impact and triggering conditions of the exceptional
hydro-geomorphological event of December 1909 in Iberia
S. Pereira1, A. M. Ramos2, J. L. Zêzere1, R. M. Trigo2, and J. M. Vaquero31Centre for Geographical Studies, Institute of Geography and Spatial Planning, Universidade de Lisboa, Lisboa, Portugal 2Instituto Dom Luiz (IDL), Faculdade de Ciências, Universidade de Lisboa, Lisboa, Portugal
3Departamento de Física, Universidad de Extremadura, Mérida, Spain
Correspondence to: S. Pereira ([email protected])
Received: 14 August 2015 – Published in Nat. Hazards Earth Syst. Sci. Discuss.: 29 September 2015 Revised: 19 January 2016 – Accepted: 25 January 2016 – Published: 5 February 2016
Abstract. According to the DISASTER database the 20– 28 December 1909 event was the hydro-geomorphologic event with the highest number of flood and landslide cases that occurred in Portugal in the period 1865–2010 (Zêzere et al., 2014). This event also caused important social impacts over the Spanish territory, especially in the Douro Basin, hav-ing triggered the highest floods in more than 100 years at the river’s mouth in the city of Oporto.
This work has a dual purpose: (i) to characterize the spa-tial distribution and social impacts of the December 1909 hydro-geomorphologic DISASTER event over Portugal and Spain; (ii) to analyse the meteorological conditions that trig-gered the event and the spatial distribution of the precipita-tion anomalies.
Social impacts that occurred in Portugal were obtained from the Disaster database (Zêzere et al., 2014) whereas the data collection for Spain was supported by the systematic analysis of Spanish daily newspapers. In addition, the me-teorological conditions that triggered the event are analysed using the 20th Century Reanalysis data set from NOAA and precipitation data from Iberian meteorological stations.
The Iberian Peninsula was spatially affected during this event along the SW–NE direction spanning from Lisbon, Santarém, Oporto, and Guarda (in Portugal), to Salamanca, Valladolid, Zamora, Orense, León, and Palencia (in Spain). In Iberia, 134 DISASTER cases were recorded (130 flood cases; 4 landslides cases) having caused 89 casualties (57 due to floods and 32 due to landslides) and a further total of 3876 affected people, including fatalities, injured, missing, evacuated, and homeless people.
This event was associated with outstanding precipitation registered at Guarda (Portugal) on 22 December 1909 and unusual meteorological conditions characterized by the pres-ence of a deep low-pressure system located over the NW Iberian Peninsula with a stationary frontal system striking the western Iberian Peninsula. The presence of an upper-level jet (250 hPa) and low-level jet (900 hPa) located SW–NE ori-ented towards Iberia along with upper-level divergence and lower-level convergence favoured large-scale precipitation. Finally, associated with these features it is possible to state that this extreme event was clearly associated with the pres-ence of an elongated Atmospheric River, crossing the entire northern Atlantic Basin and providing a continuous supply of moisture that contributed to enhance precipitation.
This work contributes to a comprehensive and system-atic synoptic evaluation of the second most deadly hydro-geomorphologic DISASTER event that has occurred in Por-tugal since 1865 and will help to better understand the me-teorological system that was responsible for triggering the event.
1 Introduction
In the Iberian Peninsula, extreme precipitation events that oc-cur during winter (December-January-February-March) have been historically associated with progressive flooding events in the major rivers (Salgueiro et al., 2013), and exceptionally with flash floods that typically occur in small watersheds or urban areas (Llasat et al., 2005; Fragoso et al., 2012) and also landslide events (Zêzere and Trigo, 2011; Zêzere et al.,
2014, 2015). These events have been the source of major socio-economic impacts, with human and material damage (Barriendos and Rodrigo, 2006; García et al., 2007; Vicente-Serrano et al., 2011; Trigo et al., 2014, 2015).
Regularly, these extreme events have been evaluated based on case studies, like for instance the large flood in the Guadi-ana River in 1876 (Trigo et al., 2014), the November 1967 flash flood in the Lisbon region (Trigo et al., 2015), the 10 June 2000 flash flood in Catalonia (Llasat et al., 2003), and the 20 February 2010 flash floods in Madeira (Fragoso et al., 2012). Major floods that occurred in the Iberian Penin-sula were extensively analysed in the Tagus Basin (Benito et al., 2003; Salgueiro et al., 2013; Machado et al., 2015) and to a lesser extent in the Douro Basin (e.g. Morán-Tejeda et al., 2012).
Recently, a long-term database of hydro-geomorphological cases was developed for Portugal covering the period 1865–2010 in the project DISASTER (Zêzere et al., 2014). This database accounts for 1621 flood cases and 281 landslide cases that were responsible for 1251 fatalities and more than 41 000 homeless people (Zêzere et al., 2014). This database includes social con-sequences (fatalities, injured, missing, evacuated, and homeless people) caused by flood and landslide cases referred to in Portuguese newspapers during the period of 1865–2010. The DISASTER database is the only database containing detailed data on the social impacts of hydro-geomorphologic disasters in Portugal as it accounts for any flood or landslide that, independently of the number of affected people, caused casualties or injuries, or missing, evacuated, or homeless people. Therefore, each DISASTER case is a unique hydro-geomorphologic occurrence, which is related to a unique geographic location and a specific period of time (e.g. the place where the flood or landslide harmful consequences occurred on a specific date). Within this database, a DISASTER event is a set of flood and landslide cases sharing the same trigger mechanism and thus clustered in the temporal domain, which may have a widespread spatial extension and a certain magnitude (Zêzere et al., 2014).
The December 1909 flood in Portugal is considered the most extraordinary flood of the 20th century along the Douro River since systematic records of the river flow began (Ro-drigues et al., 2003). This particular flood also had a strong contribution from the Spanish area of the Douro Basin, at a time when the hydrologic regime was only conditioned by natural factors due to the absence of dams to control the river flow (Rodrigues et al., 2003). It is worth stressing that after the flash flood of November 1967 (with circa 500 deaths) the 1909 flood was the second deadliest Disaster event in Por-tugal in the period 1865–2010, and generated 35 fatalities (29 caused by floods and six caused by landslides). In addi-tion, according to the DISASTER database the 20–28 De-cember 1909 was the DISASTER event with the highest number of flood and landslide cases (67 flood cases and three
landslide cases) occurring in Portugal in the period 1865– 2010 (Zêzere et al., 2014). As we show later in the descrip-tive analysis there were an even larger number of fatalities in Spain (54), raising the total number of deaths to 89.
The societal impacts associated with the 1909 event were particularly high over the NW Iberian Peninsula (Fig. 1). Thus, while most observed floods were concentrated in Por-tuguese and Spanish provinces of the Douro Basin, other ar-eas were equally affected, including the Minho Basin and Tagus valley (Santarém), Lisbon region and also the northern sector of the Tagus Basin in the Spanish territory (Fig. 1).
Besides the intrinsic relevance of this extreme episode from the impact perspective, this event was associated with some outstanding precipitation values and unusual meteoro-logical conditions. However, to the best of our knowledge this extreme hydro-meteorological episode has never been evaluated in detail, namely by Portuguese and Spanish au-thorities or research teams. This lack of previous assessments resulted in our view from several distinct factors, includ-ing (1) lack of sufficient long-term time series of precipita-tion covering most of the affected territory, (2) lack of sur-face and upper-air meteorological fields capable of describ-ing the most important atmospheric circulation features of the episode, and (3) the inexistence of a list of places with the affected people and socio-economic impacts for the complete event over Iberia. These three shortcomings result from the time that has passed since the event in the early 20th century. However, these caveats have been minimized to a large extent in recent years. Thus, a number of initiatives in Portugal and Spain have favoured the digitalization of time series from the late 19th century and beginning of 20th century, allowing the assessment of long-term changes in daily precipitation (Gal-lego et al., 2011; Cortesi et al., 2014), or related to major historical floods and extreme precipitation events (Trigo et al., 2014; Domínguez-Castro et al., 2015). Likewise, a new type of long-term reanalysis has been developed (Compo et al., 2011), and despite being based on surface data, it is ca-pable of reproducing upper-air fields (e.g. Trigo et al., 2014). Finally, as stated previously, a comprehensive list of people affected (fatalities, injured, displaced, evacuated, and disap-peared) has been obtained through the DISASTER database (Zêzere et al., 2014) although covering only the Portuguese territory.
In this context, this work has a dual purpose: (i) to char-acterize the spatial distribution and social impacts of the December 1909 hydro-geomorphologic DISASTER event over Portugal and Spain; (ii) to analyse the meteorological conditions that triggered the event and the spatial distribu-tion of the precipitadistribu-tion anomalies. We aim at characteriz-ing the meteorological synoptic forccharacteriz-ing of a major hydro-geomorphologic event that occurred in the last 150 years and registered in the DISASTER database. However, besides this meteorological/climatological assessment we are equally in-terested in obtaining a full characterization of the associated human cost and the spatial extent of associated social
im-! ! ! ! ! ! ! ! ! ! ! ! ! ! ! ! ! ! ! ! ! ! ! ! ! ! ! ! ! ! ! ! ! ! ! !!!!!!! !! ! ! !! ! ! ! ! ! ! ! ! ! ! ! ! ! ! ! ! ! ! ! ! !! ! ! ! ! ! ! ! ! ! ! ! ! ! ! ! ! ! ! ! ! ! ! ! ! ! ! ! ! ! ! ! ! ! ! ! ! ! ! ! !! ! ! ! !!! ! ! ! ! ! ! ! ! ! ! ! ! ! # * # * # * # * # * # * # * # * # * # * # * # * # * # * # * # * # * # * # * # * # * # * # * # * # * # * #* ! ! ! ! 4 6 2 5 1 7 3 Ebro Tagus Douro Guad iana Guadalqui vir Tarn Mino Jucar Adour Garo nne Aude Sado Zezere Segura El Llob regat Beja Soria Cádiz Évora Murcia Málaga Madrid Huesca Huelva Burgos Lisbon Oporto Guarda Sevilla Granada Coimbra Zaragoza Valencia Alicante Albacete Salamanca La Coruña Barcelona Valladolid Ciudad Real
Sources: Esri, USGS, NOAA 4°0'0"E 0°0'0" 0°0'0" 4°0'0"W 4°0'0"W 8°0'0"W 8°0'0"W 42 °0 '0 "N 42 °0 '0 "N 38 °0 '0 "N 38 °0 '0 "N
´
! Floods ! Landslides # * Rain gauges Large rivers Hydrographic basins FRANCE SPAIN PORTUGAL 0 50 100 km Campo Maior Badajoz Atl an ti c O c e a n M ed i t te r a ne an Se a C a n t a br i a n S e a Pyrenean Mountains Cantabrian MountainsCentral Mountains
Betic Rang
e
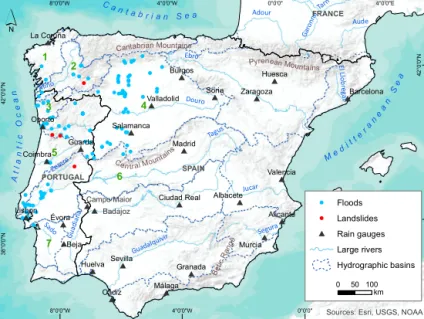
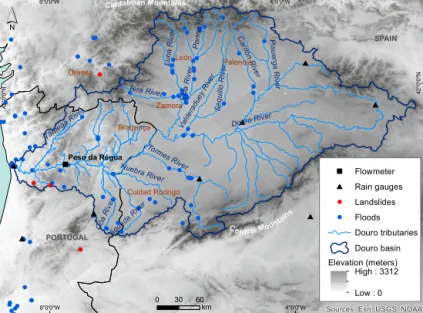
Figure 1. Study area and flood and landslide DISASTER cases from 20–28 December 1909 event over Iberia. Source: Disaster database for Portugal and Spanish newspapers (see Table 1). Numbers in the map correspond to the affected hydrographic basins: (1) Coruña basins; (2) Minho Basin; (3) Lima and Cávado basins; (4) Douro Basin; (5) Águeda, Mondego, and West basins; (6) Tagus Basin; (7) Sado Basin.
pacts, as such evaluation has never been done before. Over-all, we expect to gain a better understanding of the climatic driving forces of hydro-geomorphologic disaster events and corresponding societal impacts over Iberia.
2 Study area and precipitation regime
The Iberian Peninsula is located southwest of Europe and in-cludes the countries of Andorra, Portugal, and Spain. It is surrounded by the Mediterranean Sea (on the southeast and east), the Atlantic Ocean (on the west), and the Cantabrian Sea (on the north). The central part of the Iberian Penin-sula is occupied by the Meseta, a vast plateau (Douro and Tagus Cainozoic basins) that is characterized by hilly and smooth terrain. The central Meseta is surrounded by moun-tains (e.g. Cantabrian Mounmoun-tains, Pyrenean Mounmoun-tains, the Betic Range, and Central Mountains) and is sculptured by the fluvial network (Santisteban and Schulte, 2007) (Fig. 1). There are four large international Iberian rivers (Minho, Douro, Tagus, and Guadiana), all flowing predominantly along the NE–SW direction, with their lower courses in Portugal (Fig. 1). The seasonal precipitation regime in the Iberian Peninsula controls the major river flow regime (Trigo et al., 2004) like in other Mediterranean regions, where most of the river flow is registered in winter and spring time (Dav-eau, 1998).
In the Iberian Peninsula, there is a high spatial and tempo-ral variability of precipitation (Serrano et al., 1999; Trigo et al., 2004; Cortesi et al., 2013) due to its location in the south-ern rim of the Atlantic zonal circulation (Trigo and Palu-tikof, 2001). The successive passage of frontal systems from
west to east over the North Atlantic Basin (most frequent in the winter) produces continuous and persistent daily precip-itation, mostly in the western Iberian Peninsula, which can cause major river floods (Salgueiro et al., 2013). Precipita-tion distribuPrecipita-tion over the Iberian Peninsula depends also on the wind trajectory (SW, W, or NW) and on the local oro-graphic effects (Goodess and Jones, 2002; Salgueiro et al., 2013; Cortesi et al., 2014) that influence precipitation inten-sity and type (snow vs. hail or rainfall) at the regional scale.
Numerous studies have shown that the NAO has a strong impact on the occurrence of extreme flooding in the major rivers, namely along the Tagus River (Benito et al., 2003; Silva et al., 2012; Salgueiro et al., 2013; Machado et al., 2015) and the Guadiana River (Ortega and Garzón, 2004).
In addition, Ramos et al. (2015) show that the presence of the so-called Atmospheric River (AR) structure over the Iberian Peninsula can enhance the precipitation amount, as was the case of another outstanding historical flood event in southern Iberia in 1876 (Trigo et al., 2014). There-fore this will be also taken into account when analysing the 1909 hydro-geomorphologic DISASTER event. ARs are identified as narrow plumes of enhanced moisture transport that are usually present in the core of the warm conveyor belt and occur on the oceans along the warm sector of extra-tropical cyclones (Ramos et al., 2015). They are usually W– E (or SW–NE) oriented and steered by pre-frontal low-level jets along the trailing cold front and subsequently feed the precipitation in the extra-tropical cyclones. The large quan-tity of water vapour within the AR can generate heavy precip-itation and floods when they make landfall (Dettinger, 2011; Lavers et al., 2011). Regarding the Iberian Peninsula, the
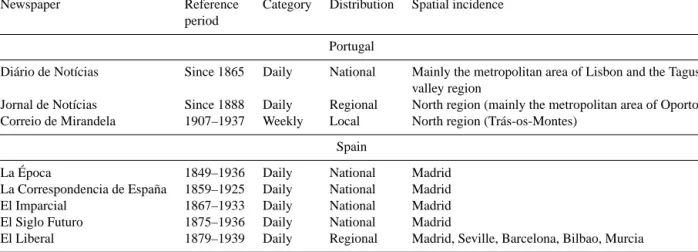
Table 1. Newspapers explored for the December 1909 event data collection.
Newspaper Reference Category Distribution Spatial incidence
period
Portugal
Diário de Notícias Since 1865 Daily National Mainly the metropolitan area of Lisbon and the Tagus
valley region
Jornal de Notícias Since 1888 Daily Regional North region (mainly the metropolitan area of Oporto)
Correio de Mirandela 1907–1937 Weekly Local North region (Trás-os-Montes)
Spain
La Época 1849–1936 Daily National Madrid
La Correspondencia de España 1859–1925 Daily National Madrid
El Imparcial 1867–1933 Daily National Madrid
El Siglo Futuro 1875–1936 Daily National Madrid
El Liberal 1879–1939 Daily Regional Madrid, Seville, Barcelona, Bilbao, Murcia
impact of ARs in extreme precipitation has been assessed systematically (Ramos et al., 2015) but also in relation to several well-known events of floods and extreme precipita-tion with major socio-economic consequences (Couto et al., 2012; Liberato et al., 2013). There are several methodologies to identify ARs (Gimeno et al., 2014), here we adopted the method requiring the existence of a long ( > 2000 km length) and narrow (< 500 km width) band of water vapour at low levels from the subtropics (> 5 g kg−1of specific humidity at 900 hPa), while wind speed should be considered above 12.5 ms−1(Lavers et al., 2011).
3 Materials and methods 3.1 Historical data sources
The data source used to analyse the event of December 1909 in Portugal was the DISASTER Database (Zêzere et al., 2014). The data collection process used to construct the DIS-ASTER database was based on painstaking analysis of nu-merous daily and weekly newspapers, and is explained in full detail in Zêzere et al. (2014).
In 1909 there were available only four newspapers for data collection in Portugal (Zêzere et al., 2014). The national daily newspaper “Diário de Notícias” published since 1865 in Lis-bon provided the longest time period to data collection. As well as this daily newspaper the “Jornal de Notícias”, pub-lished in Oporto (North Portugal) since 1888, was also anal-ysed. The remaining two newspapers are weekly local and regional newspapers, one located in the North (“Correio de Mirandela”) and another one in the South of the country (“O Algarve: o semanário independente”).
In Spain there is no equivalent to the DISASTER database built with similar criteria in order to allow data compari-son between the two countries. As a consequence, we have adopted the same methodology and criteria used in the
DIS-ASTER database to ensure data integrity and to enable data comparison. The data collection process was supported by the systematic analysis of Spanish daily newspapers of the entire month of December 1909. Four daily national newspa-pers (“La Época”, “La Correspondencia de España”, “El Im-parcial”, “El Siglo Futuro”) published in Madrid were used for data collection and a regional newspaper (“El Liberal”) with spatial incidence in Madrid, Sevilla, Barcelona, Bilbao and Murcia was also explored (Table 1). In summary, we can state that, although not included in the original DISASTER database, all locations selected in Spain relative to this event fulfil the DISASTER requirements as described in Zêzere et al. (2014). In this regard they can be considered DISASTER-like cases and the use of this denomination will be applied indiscriminately throughout this work, to both cases and lo-cations in Portugal and Spain.
Each DISASTER case includes details on process charac-teristics and associated damages. The first includes data on type (flood or landslide), subtype, date, location, triggering factor, and data source. In addition, the following damage data were recorded: number of casualties, injuries, missing, evacuated or homeless people, type of damages in buildings, number of affected buildings, type of damage in road and railroad, extent of interruptions in road and railroad circula-tion (Zêzere et al., 2014). Informacircula-tion about the gender of the fatalities was also obtained from the content analysis of the newspapers as well as the circumstances surrounding the fatalities (Pereira et al., 2015). The latter were classified into four classes according to the location where the fatalities oc-curred – namely, inside a building in a rural area; inside a building in an urban area; outdoors in a rural area; outdoors in an urban area.
Location of DISASTER cases in both countries was ob-tained using a point shapefile. The precision of the location depends on the detail of the news and was classified in the following classes: (i) exact coordinates (accuracy associated with scale 1 : 1000); (ii) local toponymy (accuracy associated
with scale 1 : 10 000); (iii) local geomorphology (accuracy associated with scale 1 : 25 000 scale); (iv) centroid of the parish; and (v) centroid of the municipality (Zêzere et al., 2014).
Additionally, in order to evaluate the relative level of dam-ages along the affected regions during this historical event, three damage indices (fatalities index, homeless index, and total affected index) were computed, taking into account the resident population per region obtained from the Census data in Portugal (1911) and Spain (1910):
Fatalities index = No. of fatalities
Resident population·100 000 (1)
Homeless index = No. of homeless people
Resident population ·100 000 (2)
Total affected index =No. of total affected people
Resident population ·100 000. (3)
The number of total affected people includes the total number of fatalities, injuries, missing people, evacuated people, and homeless people. Damage indices were mapped and clas-sified into five classes (low, moderate, high, very high, ex-treme) according to natural breaks of index distribution. Nat-ural breaks classes are based on natNat-ural groupings inher-ent in the data that best group similar values and maximize the differences between classes. With this methodology each affected region (“Distrito” in Portugal and “Provincia” in Spain) was classified according to the fatalities index, home-less index, and total affected index. These indices are impor-tant to compare the societal impacts of floods and landslides observed in different regions; in addition these indices can be applied to other historical events in other study areas.
3.2 Precipitation data
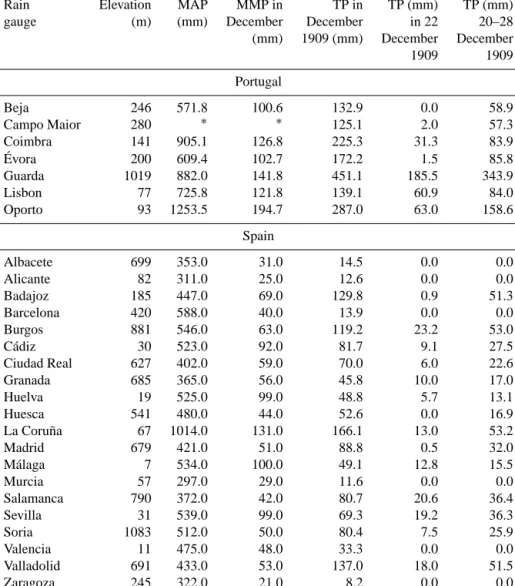
Precipitation data for 27 meteorological stations of Iberia (Fig. 1) used here is summarised in Table 2 including the name, elevation (in m) mean annual precipitation (MAP), mean monthly precipitation (MMP) in December, and to-tal precipitation in 1909 (December, 22 December, and 20– 28 December).
Seven meteorological stations are located in Portugal (Beja, Campo Maior, Coimbra, Évora, Guarda, Lisbon, and Porto) and were digitized by the Geophysical Institute In-fante Dom Luiz (IDL) within the ERA-CLIIM project (Stick-ler et al., 2014). In addition, 20 meteorological stations are located in Spain (Albacete, Alicante, Badajoz, Barcelona, Burgos, Cádiz, Ciudad Real, Granada, Huelva, Huesca, La Coruña, Madrid, Málaga, Murcia, Salamanca, Sevilla, So-ria, Valencia, Valladolid, and Zaragoza) and were digitized in the framework of the project EMULATE which are the most complete and reliable daily precipitation records extending back to the mid-19th century (Brunet et al., 2007). A large fraction of these stations were used in a long-term assess-ment of tendencies in the frequency of days characterised by low, medium, and intense precipitation (Gallego et al., 2011).
Long-term daily precipitation data of Oporto (1906–2007), Guarda (1906–1994), Lisbon (1864–2013), and Salamanca (1894–2003) stations were further explored in detail consid-ering the period from September to December. For the com-plete set of stations, climatological reference periods cor-respond to the 1971–2000 normal in Portugal (IPMA, Por-tuguese Meteorological Office) and to the 1981–2010 normal in Spain (AEMet, Spanish Meteorological Office).
3.3 Synoptic data
The atmospheric circulation during the December 1909 event and prior months was evaluated at different timescales. This was achieved with the recently developed 20th Century Re-analysis version 2 (Compo et al., 2011), hereafter 20 CR.
The 20 CR data set has been shown to be suitable for long-term assessment over Iberia, such as major floods event in 1876 (Trigo et al., 2014) or the decadal change of wind re-sources (Kirchner-Bossi et al., 2014). Several fields related to both surface and tropospheric levels were extracted. From the surface the 6 h sea level pressure field (hPa) and 6 h accumu-lated precipitation were used). In addition the following vari-ables were also extracted and analysed: (i) for the lower lev-els (900 hPa), the 6 h fields of wind vector (m s−1) and spe-cific humidity (g kg−1), and (ii) for the upper levels (500 and 250 hPa) the 6 h fields of wind vector (m s−1), geopotential height, and temperature. The ensemble mean fields for all variables were assessed using a global grid of 2◦×2◦.
3.4 NAO data
NAO data of monthly mean normalized difference of sea level pressures between Lisbon (Portugal) and Stykkishol-mur/Reykjavik (Iceland) (Hurrell, 1995) were obtained from the National Centre of Atmospheric Research (NCAR) cov-ering the period from 1865 onwards.
4 Results
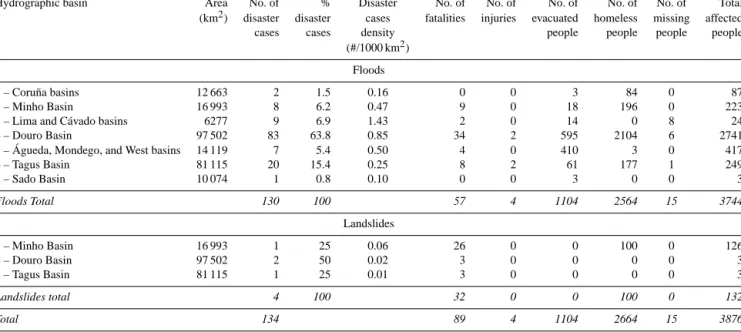
4.1 Societal impacts of the December 1909 event In Iberia, 134 DISASTER cases were recorded – 130 flood cases and four landslides cases (Fig. 1). Table 3 summa-rizes the social consequences of the December 1909 event in Iberia. Considering the data sources from both affected coun-tries, floods that occurred during the December 1909 event caused 57 fatalities, 4 injured, 15 missing people, 1104 evac-uated people, and 2564 homeless people (Table 3). Land-slides (debris flows) caused 32 fatalities and 100 homeless people (Table 3). In total this event affected 3876 people in the Iberian Peninsula.
In this section the spatial distribution of the societal im-pacts will be explored per hydrographic basin whereas the results of the damage indices are presented per region. The temporal distribution of the DISASTER cases per day (20–
Table 2. Available precipitation stations for December 1909 event in Iberia.
Rain Elevation MAP MMP in TP in TP (mm) TP (mm)
gauge (m) (mm) December December in 22 20–28
(mm) 1909 (mm) December December 1909 1909 Portugal Beja 246 571.8 100.6 132.9 0.0 58.9 Campo Maior 280 ∗ ∗ 125.1 2.0 57.3 Coimbra 141 905.1 126.8 225.3 31.3 83.9 Évora 200 609.4 102.7 172.2 1.5 85.8 Guarda 1019 882.0 141.8 451.1 185.5 343.9 Lisbon 77 725.8 121.8 139.1 60.9 84.0 Oporto 93 1253.5 194.7 287.0 63.0 158.6 Spain Albacete 699 353.0 31.0 14.5 0.0 0.0 Alicante 82 311.0 25.0 12.6 0.0 0.0 Badajoz 185 447.0 69.0 129.8 0.9 51.3 Barcelona 420 588.0 40.0 13.9 0.0 0.0 Burgos 881 546.0 63.0 119.2 23.2 53.0 Cádiz 30 523.0 92.0 81.7 9.1 27.5 Ciudad Real 627 402.0 59.0 70.0 6.0 22.6 Granada 685 365.0 56.0 45.8 10.0 17.0 Huelva 19 525.0 99.0 48.8 5.7 13.1 Huesca 541 480.0 44.0 52.6 0.0 16.9 La Coruña 67 1014.0 131.0 166.1 13.0 53.2 Madrid 679 421.0 51.0 88.8 0.5 32.0 Málaga 7 534.0 100.0 49.1 12.8 15.5 Murcia 57 297.0 29.0 11.6 0.0 0.0 Salamanca 790 372.0 42.0 80.7 20.6 36.4 Sevilla 31 539.0 99.0 69.3 19.2 36.3 Soria 1083 512.0 50.0 80.4 7.5 25.9 Valencia 11 475.0 48.0 33.3 0.0 0.0 Valladolid 691 433.0 53.0 137.0 18.0 51.5 Zaragoza 245 322.0 21.0 8.2 0.0 0.0
Note: MAP – mean annual precipitation; MMP – mean monthly precipitation; TP – total precipitation;∗Campo Maior
station was only in operation between December 1872 and December 1909.
28 December) will also be analysed as well as the surround-ing circumstances of fatalities.
4.1.1 Spatial distribution of the impacts
The Iberian Peninsula was spatially affected during this event along the SW–NE direction spanning from Lisbon to the south slope of the Cantabrian Mountains (Fig. 1). The Douro Basin and the Tagus Basin registered 62 and 15 % of to-tal DISASTER cases, respectively (Fig. 2a), but the highest DISASTER cases density (1.4/1000 km2) was registered in the Lima and Cávado basins located in the NW sector of the Iberian Peninsula.
The locations of the DISASTER cases were also anal-ysed taking into account their relative position in three main sectors of the corresponding hydrographic basin (headwa-ter sector, middle sector, and lower sector). These sectors
were identified within each hydrographic basin by dividing the corresponding DEM (pixel = 1 km) into three elevation classes of equal area. The lower sector of the affected hydro-graphic basins contains more than half of DISASTER cases considering the total hydrographic basins affected by the De-cember 1909 event (Fig. 2b). In the western smallest hydro-graphic basins of Lima and Cávado basins and Sado Basin (3 and 7, Table 3) the DISASTER cases only occurred in the lower sector. Disaster cases located in the headwater sector were only registered in the major river basins of Douro and Tagus (10.6 and 4.8 %, of total cases, respectively).
The spatial distribution of fatalities generated by floods and landslides in Iberia during the 1909 event is presented in Fig. 3a. Floods were particularly disastrous along the Douro Basin, where 60 % of total fatalities associated with floods were registered (Table 3). However, the DISASTER case
Table 3. Social consequences of the December 1909 event per hydrographic basin.
Hydrographic basin Area No. of % Disaster No. of No. of No. of No. of No. of Total
(km2) disaster disaster cases fatalities injuries evacuated homeless missing affected
cases cases density people people people people
(#/1000 km2)
Floods
1 – Coruña basins 12 663 2 1.5 0.16 0 0 3 84 0 87
2 – Minho Basin 16 993 8 6.2 0.47 9 0 18 196 0 223
3 – Lima and Cávado basins 6277 9 6.9 1.43 2 0 14 0 8 24
4 – Douro Basin 97 502 83 63.8 0.85 34 2 595 2104 6 2741
5 – Águeda, Mondego, and West basins 14 119 7 5.4 0.50 4 0 410 3 0 417
6 – Tagus Basin 81 115 20 15.4 0.25 8 2 61 177 1 249 7 – Sado Basin 10 074 1 0.8 0.10 0 0 3 0 0 3 Floods Total 130 100 57 4 1104 2564 15 3744 Landslides 2 – Minho Basin 16 993 1 25 0.06 26 0 0 100 0 126 4 – Douro Basin 97 502 2 50 0.02 3 0 0 0 0 3 6 – Tagus Basin 81 115 1 25 0.01 3 0 0 0 0 3 Landslides total 4 100 32 0 0 100 0 132 Total 134 89 4 1104 2664 15 3876
Note: hydrographic basins are shown in Fig. 1.
that generated more fatalities (26 fatalities) was produced by a single landslide (debris flow) that occurred in Orense province in the Minho Basin.
Floods generated the vast majority (96.2 %) of total home-less people, and among these, 82 % were located in the Douro Basin, mostly on the Spanish side of the basin (Fig. 3b, Table 3). In Spain, the provinces of Salamanca, Palencia, Zamora Orense, and León registered the highest number of homeless people due to floods along the Douro tributaries (Tormes, Carrión, Esla, Tera, and Luna rivers) (Fig. 4). In Portugal, the highest number of homeless people was regis-tered at Santarém, in the lower sector of the Tagus hydro-graphic basin.
During the DISASTER event of December 1909 it was also necessary to evacuate people (Fig. 3c) rescued from the waters or flooded buildings. There were two major spots of evacuated people in Portugal, the first in the Lisbon district and the second at the mouth of the Douro River in Oporto City (Oporto district), where 400 and 105 people, respec-tively, were evacuated. In Spain, there was an important spot of evacuated people (101 people) near the confluence of the Carrión River with the Douro River in the province of Palen-cia (Fig. 4). The Douro Basin includes 53.9 % of total evac-uated people registered during the December 1909 event.
Table 3 highlights the Douro Basin as the major zone im-pacted by floods. This basin registered 64% of total Disaster flood cases and 73 % of total affected people by floods. In the case of landslides, the Minho Basin had only a single DISAS-TER case, however, this single event was responsible for the highest number of fatalities (26) and homeless people (100) generated by landslides.
Figure 5 illustrates the spatial variability for different Iberian regions of the three damage indices considered (fa-talities index, homeless index, and total affected index). The Fatalities Index was classified as Extreme in the provinces of Zamora and Orense (Minho Basin) and Very High in Bra-gança and Salamanca in the middle sector of the Douro Basin and Santarém in the lower sector of the Tagus Basin. In the provinces of Palencia, Zamora, and Salamanca, located in the Douro Basin headwater and middle sectors, the Homeless In-dex was Extreme (Fig. 5b). The same provinces registered an Extreme Total Affected Index (Fig. 5c), which was mainly justified by the very high number of homeless people located in the headwater and middle sectors of the Douro Basin. The total affected index was very high in the lower section of the Tagus Basin (Lisbon and Santarém districts) as well as in the headwater and middle sectors of the Douro Basin (León province), and the Minho Basin (Orense Province).
Despite the described social impacts, the December 1909 event also caused huge economic losses in Iberia. In Spain, several settlements were completely submerged by water and a great number of buildings were destroyed, especially in the areas drained by the main tributaries of the Douro River (e.g. in the provinces of Zamora, Salamanca, León, Palencia; Fig. 4). Also, in Portugal Peso da Régua and the riverside ar-eas of Oporto and Vila Nova de Gaia were submerged by the Douro River.
Major cities of Spain (e.g. Salamanca) and Portugal (e.g. Oporto) were kept isolated, without communications (mail, telegraph) with the outside world due to widespread cuts in road and rail networks (submerged or destroyed roads
(a)
(b)
Headwater sector Middle sector Lower sector
Figure 2. Percentage of Disaster cases and Disaster cases density per hydrographic basin (a) and percentage of Disaster cases per hy-drographic basin sector (b). Hyhy-drographic basin code: 1 – Coruña basins; 2 – Minho Basin; 3 – Lima and Cávado basins; 4 - Douro Basin; 5 – Águeda, Mondego and West basins; 6 – Tagus Basin; 7 – Sado Basin.
and railroads, bridges collapsed). Rail connection between Portugal and Spain was also interrupted for several days.
Finally, it was also reported that some cattle herds were killed by the floods in the Spanish provinces affected by the event, as well as widespread destruction of cropped ar-eas (e.g. vegetables, grain) that caused food scarcity after the floods. (“La Correspondencia de España”, 22–28 Decem-ber 1909).
4.1.2 Temporal distribution of the impacts
Daily evolution of fatalities and affected people generated during the December 1909 event is shown in Fig. 6. Between 20 and 22 December 48.8 % of the Disaster cases were reg-istered (Fig. 6a). In addition, the highest daily number of DISASTER cases (58) and fatalities (52) were registered in 22 December. In terms of total affected people, it is possi-ble to recognize two peaks, the major one on 22 Decem-ber (1842 affected people) and a second on 25 DecemDecem-ber (1014 affected people).
In the Douro Basin the daily evolution of the social im-pacts (Fig. 6b) is quite similar to the complete set of the
event. In contrast, the Tagus Basin only registered human im-pacts on 22, 24, and 27 December (Fig. 6c), with a peak of Disaster cases and affected people on 22 December.
The spatial distribution of the DISASTER cases per day is shown in Fig. 7. In general terms, DISASTER cases that oc-curred between 20 and 23 December arose predominantly in the western part of Portugal with some isolated spots in Spain (Salamanca, Zamora, León, and Orense). Disaster cases reg-istered between 24 and 28 December were widespread in Spain in the Douro and Tagus headwater and middle sectors. Some isolated spots occurred in Portugal on 27 and 28 De-cember in the lower sectors of the Minho, Lima and Cávado, and Tagus basins. Therefore, overall the temporal distribu-tion of DISASTER cases is consistent with an atmospheric circulation in the Iberian Peninsula coming from SW to NE. However, we must keep in mind that information flow at the time was considerably slower than today, particularly dur-ing disruptive events such as major natural hazards. In this regard, it is possible that some of these later dates can corre-spond to cases that were reported a few days after their real occurrence without correction of the reported timing.
4.1.3 Circumstances surrounding fatalities
Circumstances surrounding the fatalities by gender during the December 1909 event are presented in Fig. 8. Fatal-ities were dominant in rural areas, both inside buildings and outdoors (87.6 % of total fatalities). For the hydro-geomorphological cases where the gender of the victim is known, it is clear that male fatalities were dominant (81 % of total fatalities). Also male fatalities were prevalent in ru-ral areas. The predominance of male fatalities generated by floods and landslides is consistent with previous observations on mortality associated with hydro-geomorphologic disasters in Portugal (Pereira et al., 2015). The highest percentage of total fatalities with gender not reported that occurred inside buildings in rural areas (Fig. 8) correspond mostly to fatali-ties generated by landslides (81.3 %).
4.2 Precipitation event and hydrologic context
Daily long-term cumulative precipitation from 1 Septem-ber to 31 DecemSeptem-ber is shown in Fig. 9 (grey thin lines) for Oporto, Lisbon, Guarda, and Salamanca meteorological sta-tions. In addition, the long-term mean (magenta line) and the 95th percentile (black line) for 1909 (red line) are also high-lighted. It is clear that the December 1909 event was pre-ceded by an intense precipitation in late autumn, especially after 15 November where it surpasses the mean in all loca-tions and also a period of enhanced precipitation after the 17 December. These features are particularly notable at the Guarda station, where the cumulative precipitation between 17 and 31 December 1909 reached a total of 406.7 mm. Mean monthly precipitation for December at Guarda station is 141.8 mm, while the total precipitation registered in
! ! ! ! ! ! ! ! ! ! ! ! ! ! ! ! ! ! ! !! ! ! !!!!!!! ! ! ! ! ! ! ! ! ! ! ! ! ! ! ! ! ! ! ! ! !! ! ! !! ! ! ! ! ! ! ! ! ! ! ! ! ! ! ! ! ! ! ! ! ! ! ! ! ! ! ! ! ! ! ! ! ! ! ! ! ! ! ! ! ! ! ! ! ! !! ! ! ! ! ! ! ! ! ! ! ! ! ! ! ! ! ! # * # * # * # * # * # * # * # * # * # * # * # * # * # * "Peso da Régua Côa Rive r Tâmega
River Douro River
Esla Riv er Torm es River Pisue rga R iver Luna Rive r Ca rrió n R iver Tera River Valde radu ey R iver Huebra River Ague da Ri ver Sequ illo R iver Porm a Ri ver
Sources: Esri, USGS, NOAA 4°0'0"W 4°0'0"W 8°0'0"W 8°0'0"W 42 °0 '0 "N 42°0 '0 "N
´
" Flowmeter # * Rain gauges ! Landslides ! Floods Douro tributaries Douro basin Elevation (meters) High : 3312 Low : 0 SPAIN PORTUGAL 0 30 60 km Pyrenean Mountains Cantabrian MountainsCentral Mountains
Zamora Palencia Bragança Orense León Cuidad Rodrigo
Figure 4. Douro Basin and DISASTER cases of the December 1909 event.
cember 1909 was 451.1 mm (Table 2). In December 1909 a total of 80.7 mm was registered at Salamanca (although much lower than the value observed at Guarda, it corre-sponds to twice the amount of the mean monthly precipi-tation for December) (Table 2). It is important to mention that in November and December 1909 strong negative values of NAO (−1.9 and −2.5, respectively) were registered. The NAO plays an important role in shaping European precipita-tion variability (Trigo et al., 2008) especially in the Iberian Peninsula, where negative values of NAO are associated with above-normal precipitation in the region. This significant im-pact results from the displacement of the storm track further south of its normal position during months with negative NAO index, leading to a higher frequency of Atlantic low-pressure systems (mid-latitude cyclones) that travel into the region (Trigo et al., 2004, 2008). The impacts of the negative values of the NAO help to put into context the above-average precipitation that occurred in November and December.
After 22 December 1909 the cumulative precipitation (red line) was higher than the 95th percentile (black line) at Guarda and Salamanca stations, both located in the Douro Basin. The extreme rainy period is very clear at the Guarda station where a daily maximum precipitation of 185.2 mm was recorded on 22 December 1909, corresponding to a re-turn period of 141 years. Regarding Oporto and Lisbon, both stations recorded values of accumulated precipitation up to 22 December below the 95th percentile but still above the long-term mean. In addition, for Lisbon, two particular years with major floods are also highlighted for comparison: 1876 (blue line) and 1967 (green line).
The relevance of above-average precipitation before a ma-jor event depends on the temporal and spatial scales of the phenomenon being analysed. The December 1909 event
along with the 1876 event (Trigo et al., 2014) highlights the key role played by previous accumulated precipitation in the occurrence of floods during events lasting several days in the major river basins of the western Iberian Peninsula, particu-larly for the period prior to the construction of major dams (Trigo et al., 2014). In contrast, floods occurring after in-tense bursts of precipitation over relatively confined areas of western Iberia can induce flash floods, independently of the precipitation that occurred in previous weeks or months. That was the case of the sub-daily 1967 event which occurred during the night between 25 and 26 November 1967, which was confined to the Lisbon metropolitan area, i.e. without affecting large river basins. The 1967 event was the deadli-est storm affecting Portugal since at least the early 19th cen-tury with several flash floods in heavily constructed subur-ban areas around Lisbon causing more than 500 fatalities. In this case, the accumulated precipitation prior to 25 and 26 November 1967 was not relevant (being below average) and the flash floods occurred mainly as a result of very in-tense hourly precipitations, ranging in duration from 4 to 9 h, compatible with return periods of 100 years or more (Trigo et al., 2015).
As already mentioned, the precipitation record corre-sponding to the December 1909 event was particularly no-table at the Guarda station. Therefore, in order to further evaluate the time duration and magnitude of the event, the accumulated precipitation values (from 1, 2, 5, 10, 15, 30, and 45 days) for the Guarda station (88 years) were com-puted and all values were ranked, with the top 10 events being represented in Fig. 10. A similar methodology was applied in a previous analysis of an outstanding event, the record floods of 7 December 1876 in southern Iberia (Trigo et al., 2014). Figure 10 shows on the x axis the 10 highest
Beja Évora Faro Viseu Guarda Santarém Bragança Setúbal Leiria Portalegre Vila Real Coimbra Braga Aveiro Castelo Branco Lisbon Viana do Castelo León Jaén Badajoz Teruel Cáceres Toledo Cuenca Sevilla Huesca Lleida Burgos Soria Lugo Albacete Murcia Ávila Córdoba Ciudad Real Granada Huelva Asturias Zaragoza Zamora Navarra Valencia Madrid Almería Cádiz Salamanca Guadalajara Málaga Orense Palencia Girona Segovia A Coruña Valladolid Barcelona Alicante Castellón Tarragona La Rioja Álava Cantabria Pontevedra Illes Balears VizcayaGuipúzcoa Illes Balears Illes Balears
Sources: Esri, USGS, NOAA4°0'0"E 4°0'0"E 0°0'0" 0°0'0" 4°0'0"W 4°0'0"W 8°0'0"W 8°0'0"W 42 °0 '0 "N 42 °0 '0 "N 38 °0 '0 "N 38 °0 '0 "N
´
Beja Évora Faro Viseu Guarda Santarém Bragança Setúbal Leiria Portalegre Vila Real Coimbra Braga Aveiro Castelo Branco Lisbon Viana do Castelo León Jaén Badajoz Teruel Cáceres Toledo Cuenca Sevilla Huesca Lleida Burgos Soria Lugo Albacete Murcia Ávila Córdoba Ciudad Real Granada Huelva Asturias Zaragoza Zamora Navarra Valencia Madrid Almería Salamanca Cádiz Guadalajara Málaga Orense Palencia Girona Segovia A Coruña Valladolid Barcelona Alicante Castellón Tarragona La Rioja Álava Cantabria Pontevedra Illes Balears VizcayaGuipúzcoa Illes Balears Illes BalearsSources: Esri, USGS, NOAA4°0'0"E 4°0'0"E 0°0'0" 0°0'0" 4°0'0"W 4°0'0"W 8°0'0"W 8°0'0"W 42 °0 '0 "N 42 °0 '0 "N 38 °0 '0 "N 38 °0 '0 "N Beja Évora Faro Viseu Guarda Santarém Bragança Setúbal Leiria Portalegre Vila Real Coimbra Braga Aveiro Castelo Branco Lisbon Viana do Castelo León Jaén Badajoz Teruel Cáceres Toledo Cuenca Sevilla Huesca Lleida Burgos Soria Lugo Albacete Murcia Ávila Córdoba Ciudad Real Granada Huelva Asturias Zaragoza Zamora Navarra Valencia Madrid Almería Cádiz Salamanca Guadalajara Málaga Orense Palencia Girona Segovia A Coruña Valladolid Barcelona Alicante Castellón Tarragona La Rioja Álava Cantabria Pontevedra Illes Balears VizcayaGuipúzcoa Illes Balears Illes Balears
Sources: Esri, USGS, NOAA4°0'0"E 4°0'0"E 0°0'0" 0°0'0" 4°0'0"W 4°0'0"W 8°0'0"W 8°0'0"W 42 °0 '0 "N 42 °0 '0 "N 38 °0 '0 "N 38 °0 '0 "N A tl a n ti c O c e a n
´
A tl a n ti c O ce a n´
A tl a n ti c O c e a n b) a) c) No impacts 0 100 km No impacts No impacts 0 100 kmTotal affected Index Homeless Index Moderate [0.40 - 2.61[ High [2.61 - 13.21[ Very High [13.21 - 94.21[ Extreme [94.21 - 216.90] 0 100 km Fatalities Index Moderate [0.30 - 0.71[ High [0.71 - 1.21[ Very High [1.21 - 1.91[ Extreme [1.91 - 6.00] Low [0.70 - 4.41[ Moderate [4.41 - 9.41[ High [9.41 - 32.61[ Very High [32.61 - 115.51[ Extreme [115.51 - 260.70]
Figure 5. Fatalities index (a), homeless index (b), and total affected index (c) of the December 1909 event for affected regions over Iberia.
values of maximum accumulated precipitation for different temporal durations (y axis). The blue bars correspond to ac-cumulated precipitation (z axis) for different durations of the December 1909 event. For the complete precipitation series of Guarda station, the December 1909 event occupies the first position in the cumulated precipitation for 1 day (185.2 mm) and the second position for 2 days (279.8 mm) (Fig. 10).
Interestingly, the extreme precipitation values observed in Guarda and to a less extent in Salamanca were not observed
in most locations with pluviometers. Weather stations located near the Atlantic coast (Oporto and Lisbon) did not record extreme accumulated precipitation in the December 1909 event (Figs. 9 and 11) and the stations located in the east-ern part of Spain registered null or low precipitation (below 20 mm). Estimated precipitation of 22 and 20–28 Decem-ber 1909 was interpolated spatially using a co-kriging geo-statistical technique considering the precipitation measured in the stations (points) and the Iberia SRTM 90 m DEM’s
1 10 100 1000 10000 20 21 22 23 24 25 26 27 28 Num b er Days (b)
Number of disaster cases Number of fatalities Number of affected people
1 10 100 1000 20 21 22 23 24 25 26 27 28 Num b er Days ( c)
Number of Disaster cases Number of fatalities Number of affected people 1 10 100 1000 10000 20 21 22 23 24 25 26 27 28 Num b er Days (a)
Number of disaster cases Number of fatalities Number of affected people
Figure 6. Daily number of DISASTER cases, fatalities, and affected people generated by the December 1909 event (a), in the Douro Basin (b), and in the Tagus Basin (c). Notice the logarithmic scale used.
with 90 m resolution (Jarvis et al., 2008) (Fig. 11a and b). Estimated precipitation shows that the event entered in the Atlantic coast (south of Lisbon region and crossed the penin-sula in a SW–NE direction. In addition, the extreme precip-itation that occurred on 22 December in the Douro Basin, namely in the Guarda and Salamanca regions (Fig. 11a), is impressive.
According to Rodrigues et al. (2003) the flood of 1909 was referenced as the second historical flood measured at Peso da Régua, in the Portuguese sector of the Douro River (Fig. 4) in the last 300 years. In the historical flood of 1909 a flow rate of 16 700 m3s−1was reached, which was only surpassed by the flood of 1739 (18 000 m3s−1).
A graph with the evolution of sub-daily flow rate at Peso da Régua for the period of 18–30 December 1909 is shown in Fig. 12, using data from Rodrigues et al. (2003). At the beginning of this period a constant rise in the flow rate was recorded, from 2000 m3s−1on 18 December to 6000 m3s−1 in the early hours of 21 December. Then, the flow rate
sud-denly increased to 16 000 m3s−1 during the day of 23 De-cember, as a consequence of the extreme precipitation that was registered along the Douro Basin during the previous days, especially on 22 December. The maximum flow rate of 16 700 m3s−1corresponds to a return period of 80 years (Rodrigues et al., 2003). At Peso da Régua the river level rose 25 m during this flood (“Jornal de Notícias”, 24 Decem-ber 1909). It should be noticed that at Peso da Régua the flow rate of 6000 m3s−1has a 16-year return period and implies a 13 m river level rise, which is considered an extraordinary flood in the region (Rodrigues et al., 2003).
The flow rate starts to decrease at the end of 23 Decem-ber but a second peak was registered at the end of 24 De-cember with similar magnitude (16 200 m3s−1), following a secondary precipitation peak that is not evident in precipi-tation daily records. Only afterwards, i.e. after 25 Decem-ber, did the flow rate decrease progressively until the end of the month (2800 m3s−1on 30 December). It is important to note that the flow rate was higher than 6000 m3s−1between 21 and 28 December, coinciding with the Disaster event time interval.
4.3 Assessing atmospheric circulation
Here we intend to characterize the atmospheric circulation affecting western Iberia between 15 November and 28 De-cember. However, the main focus of this section will be on 22 December, in order to understand the occurrence of high-est precipitation values within this day.
The importance of the accumulated precipitation ob-served between mid-November and mid-December culmi-nating with the intense precipitation on 22 December has already been shown in Sect. 4.2. The 6-hourly sequence of SLP and corresponding accumulated precipitation (both ob-tained from the 20 CR) between 15 November at 00:00 UTC and 28 December at 18:00 UTC can be seen in the Supple-ment video V1. The week between the 16 and 21 November was characterized by a stationary low-pressure system that affected the Iberian Peninsula with precipitation occurring during these 6 days. The most intense precipitation over these days was recorded on 16 November at 18:00 UTC with high precipitation rates. According to the specific humidity and wind vectors at 900 hPa (shown in video V2 in the Supple-ment also between 15 November to 28 December) high mois-ture availability was present on 16 November at 18:00 UTC due to high moisture advection from the western African At-lantic coast as a consequence of intense southwest winds.
Between 22 November and 12 December the atmospheric circulation in the Iberian Peninsula was mainly of anticy-clonic nature with sporadic precipitation in the north Iberian Peninsula due to the passage of some low-pressure systems north of the domain (video V1 in the Supplement). On 13 De-cember a low-pressure system had its cyclogenesis west of the Azores and become stationary near the Azores until 21 December. From 17 December (video V1 in the Supplement)
! ! ! ! ! ! ! ! ! ! ! ! ! ! ! ! ! ! ! ! ! ! ! ! ! ! ! ! ! ! ! ! ! ! ! !!!!!!! ! ! ! ! !! ! ! ! ! ! ! ! ! ! ! ! ! ! ! ! !!! ! ! !! ! ! ! ! ! ! ! ! ! ! ! ! ! ! ! ! ! ! ! ! !! ! ! ! ! ! ! ! ! ! ! ! ! ! ! ! ! ! ! ! ! ! ! ! !! ! ! ! ! ! ! ! ! ! ! ! ! ! ! ! ! ! Beja Évora Faro Viseu Guarda Oporto Santarém Bragança Setúbal Leiria Portalegre Vila Real Coimbra Braga Aveiro Castelo Branco Lisbon Viana do Castelo León Jaén Badajoz Teruel Cáceres Toledo Cuenca Sevilla Huesca Lleida Burgos Soria Lugo Zaragoza Albacete Murcia Ávila Córdoba Ciudad Real Granada Huelva Zamora Asturias Navarra Valencia Cádiz Madrid Almería Salamanca Guadalajara Málaga Orense Segovia A Coruña Valladolid La Rioja Palencia Alicante Castellón Tarragona Barcelona Álava Cantabria Pontevedra VizcayaGuipúzcoa Girona Illes Balears Illes Balears Ebro Douro Tagus Guad iana Guad alqu ivir Mino Jucar Ad our Garo nne Sa do Zeze re Segura Aude
Sources: Esri, USGS, NOAA0°0'0" 0°0'0" 4°0'0"W 4°0'0"W 8°0'0"W 8°0'0"W 42 °0 '0 "N 42 °0 '0 "N 38 °0 '0 "N 38°0 '0 "N
´
SPAIN PORTUGAL 0 50 100 kmDay of the Disaster case
Hydrographic basins Large rivers ! 20 ! 21 ! 22 ! 23 ! 24 ! 25 ! 26 ! 27 ! 28 FRANCE Atl an tic O c e a n C a n t a br i a n S e a
Figure 7. DISASTER cases of the December 1909 event per day.
0 5 10 15 20 25 30 35 40 45 50
Inside a building - rural area
Inside a building - urban Outdoors - rural area Outdoors - urban area area % o f to ta l f ata litie s
Male Female Gender not reported
Figure 8. Circumstances surrounding the fatalities by gender during the December 1909 event in Iberia.
onwards it affected the western Iberian Peninsula with almost continuous precipitation every day until 22 December, when the most intense precipitation occurred (as seen in Fig. 13).
A thorough analysis is now provided covering the days of most intense precipitation, as seen by the sequential panels every 6 h of SLP and the corresponding accumulated precip-itation (both from the 20 CR) represented from 22 December at 00:00 UTC to 23 December at 00:00 UTC (Fig. 13). This figure reveals the presence of a large deep low-pressure sys-tem (966 hPa) located over the Atlantic Ocean, northwest of the Iberian Peninsula and extending from Iceland to south-ern Portugal and to Central France. This low-pressure sys-tem remained quasi-stationary from 22 December 00:00 until 12:00 UTC when it started to move east towards the British Isles and its central core began to increase pressure (Fig. 13d
and e). In addition, the frontal system associated with this low pressure struck the western Iberian Peninsula from a SW–NE direction. Although the 20th Century Reanalysis does not provide explicit front analysis, the precipitation pattern around the cyclone centre corresponds clearly to a frontal system when compared with a conceptual model of an extratropical cyclone (Shapiro and Keyser, 1990). In fact we must emphasize that the vast majority of the Atlantic mid-latitude cyclones that struck Iberia are characterized by the presence of frontal systems (sometimes already in the occlu-sion phase), that extend the precipitation impacts consider-ably to the south of the low-pressure system centre (Trigo et al., 2004).
With the aim of further analysing the upper- and lower-level dynamics of this event we computed the divergence fields simultaneously with the wind speeds for both the 900 and 250 hPa (Fig. 14). The wind speed and associated divergence at the 250 hPa level is shown in the upper panels of Fig. 14, for 00:00 and 12:00 UTC respectively. The most interesting feature for this event is associated with the pres-ence of an upper-level jet branch, oriented along a SW–NE direction towards the Iberian Peninsula but with its origin in the eastern coast of USA. This feature presents an area with strongest upper-level divergence over Portugal at 00:00 and 12:00 UTC, with values above 3 × 10⁻⁵s−1favouring deep convection. In addition, at lower levels (900 hPa), a very in-tense low-level jet (winds up to 30 m s−1 close to Portu-gal) associated with the frontal system embedded within the southern flank of the low-pressure system is also present with a similar SW–NE orientation. This intense advection of mass
(
( (
(
Figure 9. Cumulative precipitation from 1 September to 31 December using daily precipitation data from (a) Oporto, (b) Lisbon, (c) Guarda, and (d) Salamanca. Each year of cumulative precipitation is represented in grey. The mean and the 95th percentile of precipitation are represented in magenta and black respectively and accumulated precipitation in the year of 1909 is represented by the red line. In addition, the historical storm years of 1876 (blue) and 1967 (green) in Lisbon are also highlighted.
implies strong low-level convergence at the western coast of the Iberian Peninsula (−3 × 10⁻⁵s−1). In summary, we can state that the large-scale conditions in the area of the west-ern Iberian Peninsula were optimal for intense precipitation, i.e. frontal uplift associated with upper-level divergence and low-level convergence. The displacement of the jet stream so far south was also responsible for the stationary position of the low-pressure system for so long.
However, one should bear in mind that the presence of the low-pressure system and its associated frontal system and the favourable dynamical mechanisms for intense precipitation explained before cannot alone explain the intense precipita-tion that occurred on 22 December.
The analysis of Fig. 15 (upper panel, geopotential height and temperature at 500 hPa) shows that the geopotential height is characterized by a strong trough located south of the Azores thus favouring the southerly displaced position of the jet in the middle of the Atlantic (Fig. 14). Along with this trough there is a negative temperature gradient between 60 and 30◦N with dry and cold air aloft near the Iberian Peninsula which also could enhance the formation of con-vection within the frontal system.
1 day 2 days 5 days 10 days 15 days 30 days 45 days
Maximum accumulated rainfall (mm)
1.200 1.000 800 600 400 200 0 Rank 9 10 8 7 6 5 4 3 2 1
Figure 10. The 10 highest values (rank) of maximum accumulated precipitation from 1, 2, 5, 10, 15, 30, and 45 days in Guarda for the period 1906–1994. Blue bars correspond to the December 1909 event.
# # # # # # # # # # # # # # # # # # # # # # # # # # # Ebro Douro Tagus Guadiana
Guadalquivir Mino Jucar Ad our Aude Sado Zezere Segura Mondeg o El L lobre gat 0 0 0 0 0 0 32 17 53 84 51.5 25.9 36.3 36.4 15.5 53.2 16.9 13.1 22.6 27.5 51.3 57.3 85.8 83.9 58.9 158.6 343.9 4°0'0"E 4°0'0"E 0°0'0" 0°0'0" 4°0'0"W 4°0'0"W 8°0'0"W 8°0'0"W 42 °0 '0 "N 42 °0 '0 "N 38 °0 '0 "N 38 °0 '0 "N
´
FRANCE SPAIN PORTUGAL 0 50 100 km Estimated Rainfall (mm) Hydrographic basins Rain gauges (R mm) Large rivers (b) # 0 - 25 25 - 50 50 - 75 75 - 100 100 - 150 150 - 200 200 - 250 250 - 343.9 # # # # # # # # # # # # # # # # # # # # # # # # # # # Ebro Douro Tagus Guadiana Guadalq uivir Mino Jucar Adou r Aude Ga ronne Sado Zezere Segura Mondeg o El L lobre gat 0 0 0 0 6 0 0 0 2 0 18 13 10 63 7.5 0.5 5.7 9.1 0.9 1.5 19.2 20.6 12.8 23.2 60.9 31.3 185.2 4°0'0"E 4°0'0"E 0°0'0" 0°0'0" 4°0'0"W 4°0'0"W 8°0'0"W 8°0'0"W 42 °0 '0 "N 42 °0 '0 "N 38 °0 '0 "N 38 °0 '0 "N´
FRANCE SPAIN PORTUGAL 0 50 100 km Estimated Rainfall (mm) Hydrographic basins Rain gauges (R mm) Large rivers 0 - 25 25 - 50 50 - 75 75 - 100 100 - 150 150 - 185.2 (a) #Figure 11. Co-kriging interpolation of total precipitation of 22 December (a) and event cumulated precipitation in 20–28 December 1909 (b) in Iberia. 0 2000 4000 6000 8000 10000 12000 14000 16000 18000 18 -1 2-1909 19 -1 2-1909 20 -1 2-1909 21 -1 2-1909 22 -1 2-1909 23 -1 2-1909 24 -1 2-1909 25 -1 2-1909 26 -1 2-1909 27 -1 2-1909 28 -1 2-1909 29 -1 2-1909 30 -1 2-1909 Fl o w Rate (Q m 3/s )
Figure 12. Flow rate (m3s−1) at Peso da Régua from 18–30
De-cember 1909. Source: SNIHR (Rodrigues et al., 2003). The dashed line corresponds to an extraordinary flood at Peso da Régua (Portu-gal).
To analyse the moisture availability, which can enhance the precipitation intensity, the specific humidity and wind vectors at 900 hPa are also shown for the 00:00 and 12:00 UTC (Fig. 15, lower panels). In both time steps, a narrow and prolonged band of moisture being transported from sub-tropical latitudes can be seen, with origin close to the Caribbean islands. This narrow band presents an intense core with values above 9 g kg−1, over the Atlantic Ocean, and moves towards extratropical latitudes, by a southwest-ern low-level jet with wind speeds clearly above 24 m s−1 (Fig. 14). Therefore the two main criteria for the identifica-tion of AR are fulfilled (see Sect. 2) on 22 December, en-hancing the precipitation intensity during this particular day. On 23 December, the low-pressure system moves NW to-wards the British Isles and the Iberian Peninsula becomes less under the influence of this low pressure. Despite this,
Figure 13. The sea level pressure field (contour, hPa) and 6 h accumulated precipitation (shaded, mm) for 22 December 1909 at (a) 00:00 UTC, (b) 06:00 UTC, (c) 12:00 UTC, (d) 18:00 UTC, and (e) 23 December at 00:00 UTC.
some light precipitation continues to occur between 23 and 25 December as shown in video V1 in the Supplement.
Summarizing, the synoptic analysis shows that 22 Decem-ber was characterized by the presence of a deep low-pressure system located over the NW Iberian Peninsula with a sta-tionary frontal system striking the western Iberian Peninsula. The presence of an upper-level jet (250 hPa) and low-level jet (900 hPa) located on SW–NE oriented towards the Iberian Peninsula along with upper-level divergence and lower-level convergence favoured large-scale precipitation. Along with these two features, the presence of an AR (with high content of moisture) contributed to a large extent to enhanced precip-itation.
5 Discussion and conclusions
This study provides the first comprehensive assessment of a major hydro-geomorphologic event that occurred in Iberia in the last 150 years, including: (i) the spatial and temporal characteristics of the societal impacts based on newspapers analysis; (ii) the corresponding spatial distribution of precip-itation anomalies using recently digitized daily precipprecip-itation data; and (iii) the meteorological conditions that triggered the event using the 20 CR.
Data collection of human and societal disaster impacts on newspapers was very useful to obtain the spatial distribu-tion of the hydro-geomorphologic DISASTER cases in both countries and provided an important historical complement
Figure 14. Divergence (contours; 10−5s−1) at 22 December 1909 at 00:00 and 12:00 UTC for (a, b) the 250 Pa level, and (c, d) at the 900 Pa
level. Along with the divergence field, the respective wind speed (shaded, m s−1) is also shown.
Figure 15. The geopotential height (contour, m) and air temperature (shaded;◦C) at 500 hPa level for 22 December: (a) 00:00 UTC and
(b) 12:00 UTC. The wind vector (m s−1) and specific humidity (shaded, g kg−1) at 900 hPa level for the 22 December 1909 at (c) 00:00 UTC
useful to offset the lack of precipitation data in some of the affected areas. In this work new information concerning the event impacts in Spain was gathered with respect to the al-ready available DISASTER database for Portugal. According to newspapers, the December 1909 event generated 89 fa-talities, 4 injured, 1104 evacuated, and 2664 homeless peo-ple. However, the number of injured, evacuated, and home-less people is certainly underreported because the newspa-pers clearly highlighted flood and landslide cases that gener-ated fatalities.
Hydro-geomorphological event damage assessment is par-ticularly difficult to quantify due to the diversity of dam-age (human, economic, structural, or functional) and the scarce information reported in contemporary newspapers. This problem is more accentuated in the study of historical events like the December 1909 event because it is virtually impossible to reconstruct the level of loss verified in the dif-ferent affected regions. To help in tackling this caveat we have introduced three damage indices that allowed us to com-pare societal damages in the affected regions, because these indices are normalized by the resident population at the time of the event. In general terms damage indices were higher in Spanish regions than in Portuguese. Fatalities associated with this event were more abundant in rural areas. In addi-tion, this study demonstrates that males were more exposed to flood risk, which is explained by the more active role of males in agriculture activities and pasturing at that time.
The length of this event extending from 20 to 28 Decem-ber 1909 represents an extreme episode affecting most of the western and northwestern sector of the Iberian Peninsula from the impact perspective, particularly along the Douro Basin. In addition, the temporal distribution of DISASTER cases is consistent with a frontal system that crossed the Iberian Peninsula travelling on a SW to NE orientation and associated with a low pressure system located near the British Isles.
The December 1909 event was characterized by a period of enhanced precipitation after 17 December and was associ-ated with some outstanding precipitation records particularly notable at the Guarda station, where the cumulative precipi-tation between 17 and 31 December 1909 reached approxi-mately three times more than the mean monthly precipitation for December. Since 22 December 1909 the cumulative pre-cipitation was higher than the 95th percentile at Guarda and Salamanca stations, both located in the Douro Basin.
The extreme precipitation was not observed in most loca-tions of the Iberian Peninsula where pluviometers were avail-able. Weather stations of Oporto and Lisbon located near the Atlantic coast in the mouth of the Douro and Tagus rivers, re-spectively, did not record extreme accumulated precipitation in the December 1909 event. Nevertheless, these areas were also affected by floods as a result of the intense precipitation that occurred in the upper and middle sectors of the Douro and Tagus hydrographic basins.
The limited available daily precipitation data do not show the precipitation amount that may have occurred in the af-fected area of the event especially on higher mountain ranges such as Gerês or Cantabrian Mountains. Since the ARs are rich in water vapour and are associated with strong winds that force the water vapour up mountain sides, the atmospheric conditions at that time did not inhibit upward motions which were responsible for higher precipitation values in mountain areas than over flat coastal areas. This can only be seen at Guarda rain gauge (altitude of 1019 m) that registered a daily precipitation record, but we believe that equally extremely high precipitation values must have occurred also in other mountain ranges especially in the Cantabrian Mountains due to the nature of the floods that occurred in northern Spain.
The assessment of the large-scale atmospheric conditions suggests that the extreme precipitation event verified in De-cember 1909 resulted from the merging of unusual meteo-rological conditions. The presence of atmospheric instability due to the existence of a low-pressure system and its associ-ated frontal and post-frontal sectors and also the presence of an AR structure (with particularly high content of humidity) responsible for the advection of moisture towards the Iberian Peninsula contributed to enhance precipitation. It was shown by Ramos et al. (2015) that 60 % of the most anomalous pre-cipitation days are associated with the presence of an AR in the Iberian Peninsula. Since the average frequency of ARs during the extended winter (ONDJFM) over the Peninsula is around 10 % (although at different latitudes) we believe that more historical Douro floods (Rodrigues et al., 2003; Fragoso et al., 2015) could be associated also with the presence of ARs and deserve a specific assessment.
The DISASTER event of December 1909 took place at a time when the relationship between the precipitation and the river flow was more straightforward in the absence of dams. Nowadays, Douro and Tagus rivers have several dams that control flow rates and reduce flood peaks, thus reducing also the risk of flooding even when higher than normal precipita-tion occurs (Trigo et al., 2004). Nevertheless, there are some lessons to be learnt from the reconstruction of this major his-torical hydro-geomorphologic event.
First, data collection of societal disaster impacts based on local and national newspapers can be considered a good source of information to achieve temporal and spatial distri-bution of impacts, characteristics of circumstances surround-ing fatalities and gender of affected people. However, such a document-based disaster inventory is typically incomplete and, as a rule, the reliability of information is higher for the temporal distribution than for the spatial location of disaster cases.
Second, the characterization of the meteorological syn-optic forcing of the DISASTER event is crucial to under-stand the rainfall distribution in space and time, which is of paramount importance to explain the observed social im-pacts. In addition, in the case of floods the complete fluvial system has to be considered, as the flooding on the lower part