Repositório ISCTE-IUL
Deposited in Repositório ISCTE-IUL:
2018-01-17Deposited version:
Post-printPeer-review status of attached file:
Peer-reviewedCitation for published item:
Lagoa, S. (2017). Determinants of inflation differentials in the euro area: is the New Keynesian Phillips Curve enough?. Journal of Applied Economics. 20 (1), 75-103
Further information on publisher's website:
10.1016/S1514-0326(17)30004-1Publisher's copyright statement:
This is the peer reviewed version of the following article: Lagoa, S. (2017). Determinants of inflation differentials in the euro area: is the New Keynesian Phillips Curve enough?. Journal of Applied Economics. 20 (1), 75-103, which has been published in final form at
https://dx.doi.org/10.1016/S1514-0326(17)30004-1. This article may be used for non-commercial purposes in accordance with the Publisher's Terms and Conditions for self-archiving.
Use policy
Creative Commons CC BY 4.0
The full-text may be used and/or reproduced, and given to third parties in any format or medium, without prior permission or charge, for personal research or study, educational, or not-for-profit purposes provided that:
• a full bibliographic reference is made to the original source • a link is made to the metadata record in the Repository • the full-text is not changed in any way
The full-text must not be sold in any format or medium without the formal permission of the copyright holders.
Serviços de Informação e Documentação, Instituto Universitário de Lisboa (ISCTE-IUL) Av. das Forças Armadas, Edifício II, 1649-026 Lisboa Portugal
DETERMINANTS OF INFLATION DIFFERENTIALS IN THE EURO AREA:
IS THE NEW KEYNESIAN PHILLIPS CURVE ENOUGH?
S
ÉRGIOL
AGOA
Instituto Universitário de Lisboa (ISCTE-IUL), DINÂMIA’CET-IUL, Lisboa, Portugal
Submitted ; accepted May 2016
In the euro area, inflation rates diverged after the creation of the single currency, and started to converge again from mid-2002. It is against this background that the paper studies the determinants of inflation differentials in the euro area. We start by using the New Keynesian Phillips Curve (NKPC) to explain inflation differences for a panel of countries. Exchange rate movements and expected inflation in particular play an important part in bringing about diverging inflation dynamics, while lagged inflation does not. The Incomplete Competition Model (ICM) adds explanatory power to the NKPC in describing inflation dynamics across countries. The latter model does not encompass ICM, and the variables proposed by the ICM are statistically significant: the growth in nominal Unit Labour Cost and the long-run disequilibrium between prices and costs explain inflation differentials.
JEL classification codes: C23, E12, E31, F41
Keywords: Inflation, Business cycles, Convergence, New Keynesian Phillips Curve, Incomplete Competition
Model
I. Introduction
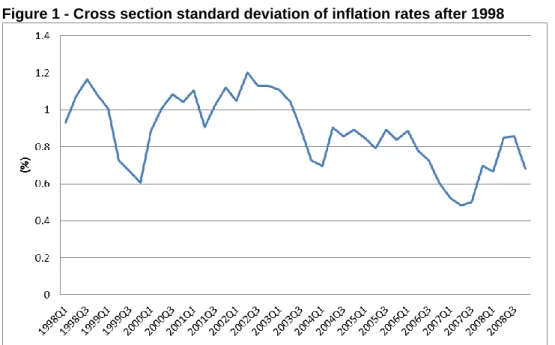
Since the creation of the European Exchange Rate Mechanism (ERM) in 1979, monetary and financial convergence in the euro area has been accompanied by inflation convergence. However, some inflation divergence did occur after the introduction of the euro (Lane, 2006; Busetti et al., 2007), as can be observed in Figure 1. Due to the nominal convergence effort before the creation of the euro, the cross section standard deviation of inflation rates in the euro area decreased to 0.6% in the fourth quarter of 1999. 1 Subsequently, inflation differentials increased to 1.2% in the second quarter of 2002. After this peak, inflation dispersion
ISCTE-Instituto Universitário de Lisboa, Avenida das Forças Armadas, 1649-026 Lisboa, Portugal; email [email protected]. I thank Stephen G. Hall, Jorge M. Streb (the Editor), and two anonymous referees for valuable comments. This paper has benefited from the financial support of Fundação para a Ciência e a Tecnologia, Ministério da Ciência e Tecnologia, Portugal.
1 In the empirical results of this paper, "euro area" only refers to 12 countries, the original 11 plus Greece: Austria, Belgium, Finland, France, Greece, Germany, Ireland, Italy, Luxembourg, the Netherlands, Portugal and Spain. Data: annual inflation rates based on quarterly CPIs: (𝑝𝑡/𝑝𝑡−4− 1) ∗ 100. For each quarter, we obtained the standard deviation for the group of 12 countries.
decreased again to the lowest level ever observed of 0.48% in the second quarter of 2007. In the first years of the euro (1999-2002), Greece, Ireland, the Netherlands, Portugal and Spain had the highest inflation rates.
[INSERT FIGURE 1]
As highlighted by the Optimum Currency Area literature, large inflation differentials may undermine the success of a monetary union. Differences in inflation rates can be caused by temporary asymmetric shocks, such as demand shocks, but the ability to deal with these impacts is limited in the absence of a national monetary policy. Inflation differentials cannot be corrected by nominal currency depreciation of high-inflation countries. Although countries may use expansionary fiscal policy to solve the problem of deflationary shocks, this can lead to a violation of the Stability and Growth Pact with negative effects on the euro area financial markets (Honohan and Lane, 2003).
Inflation differentials in the euro area are larger and more structural than in the US because the mechanisms for adjustments to asymmetric impacts are less effective (Zdárek and Aldasoro, 2009). It is well known that the euro area has less wage flexibility and wages are influenced by national labour market institutions, there is lower labour mobility across countries, and the EU budget does not permit significant transfers to countries in crisis. European Treaties also limit national fiscal policies when they try to act as effective adjustment mechanisms, and in some cases these policies even create inflation differentials (ECB, 2003). Households’ financial portfolios are poorly diversified across euro area countries, thus making financial markets a weak mechanism for adjusting to asymmetric shocks (Lane, 2006).
Persistent economic mechanisms put further restrictions of dealing with asymmetric shocks. If the labour market is not perfectly flexible, with current rather than future inflation determining wages growth, higher inflation may lead to higher wage growth and thus start an upward spiral of wage growth and inflation. Therefore, if inflation persists, temporary asymmetric shocks may produce persistent differences in inflation (Hofmann and Remsperger, 2005).
Additionally, the creation of the euro produced inflation differentials with destabilising macroeconomic consequences. Convergence to the euro meant a bigger decline in real interest rates in peripheral countries, causing faster growth in credit, house prices, aggregate demand, and therefore inflation. This one-off
expansionary shock dissipated over time, notably because higher inflation led to the real appreciation of currencies.
Higher than average inflation rates in a monetary union produce lower than average real interest rates, which may lead to both excessive debt accumulation and growth of property prices along with the subsequent painful adjustment process. This can then exacerbate the differences in business cycles among European countries, further widening inflation differentials in a cycle of divergence (Honohan and Lane, 2003; Dullien and Fritshe, 2008). Indeed, Vines, Kirsanova and Wren-Lewis (2006)’s theoretical model shows that when there is significant persistence of inflation, countries in a monetary union may be subject to large business cycles after asymmetric shocks.
Inflation differentials are sometimes the result of equilibrium mechanisms due to the convergence of long-run price levels. Inflation differences can also replace nominal exchange rate adjustments, as countries with low levels of economic growth, inflation and wage growth gain external competitiveness (Lane, 2006).
The euro area has two empirically relevant stabilising mechanisms (Hofmann and Remsperger, 2005). Firstly, GDP growth in one country has positive output spillover effects on the others, reducing inflation differentials. Secondly, the real exchange rate acts as a correcting mechanism: countries with higher than average inflation rates will face real appreciation of currencies that reduces demand and inflationary pressures. Summing up, despite equilibrium mechanisms, inflation differentials are potentially dangerous for a monetary union. This constitutes the motivation for studying the determinants of inflation differences and the respective correcting mechanism in the euro area before the Euro Sovereign Debt Crisis. We do not include this crisis period, which in some economies was dominated by strong financial constraints on private and public sectors, in order to study inflation adjustments outside a crisis situation. Our study presents two distinctive features. Firstly, we test how inflation and exchange rate expectations affect inflation divergence. Expectations have been ignored in the literature despite their importance in explaining national inflation rates. Next, the New Keynesian framework is tested to see whether it provides a complete description of inflation differentials, and is assessed against the Imperfect Competition Model (ICM). As a by-product of the convergence analysis, we estimate the New Keynesian Phillips Curve (NKPC) for the euro area using panel data. This contributes to the scarce literature on the NKPC using panel data (some examples are Bjørnstad and Nymoen, 2008; Paloviita, 2008).
Our empirical evidence shows that expectations of both inflation and exchange rates are statistically significant for inflation differences and their introduction changes the significance of other variables. Moreover, the only relevant business cycle indicator for the explanation of inflation divergence is labour cost growth. The equilibrium conditions for prices suggested by the ICM also help explain differences in inflation rates, and that model is not encompassed by the NKPC when explaining inflation differences. Lastly, our panel data evidence supports the NKPC for national inflation rates and the existence of the cost channel.
The remainder of the paper is organised as follows. In Section II we revise the main determinants of inflation differentials in the euro area. Section III estimates a model for inflation differentials using the NKPC. Section IV assesses whether the ICM can explain inflation differentials better than the NKPC. Finally, Section V concludes.
II. Literature on the determinants of inflation differentials in the euro area
There are several possible determinants of inflation differentials in a monetary union such as the euro area. Firstly, differences may emerge in countries' business cycles due to supply shocks (e.g. oil price) or domestic demand shocks, which can result from differences in fiscal policy, country-specific non-policy demand shocks (e.g. taste shocks), or asymmetric effects of common demand shocks. These demand shocks can be induced by monetary policy or exchange rate movements. In fact, the common policy interest rate may have different impacts on each country due to distinctions in financial and economic structures (Hofmann and Remsperger, 2005). Moreover, exchange rate evolution can cause inflation differentials even though countries share a common currency because differences in trade partners may mean that national effective exchange rates respond differently to the euro's evolution. The weight of imported consumption goods and inputs from outside the euro zone also differs from country to country.
It should be noted that the exchange rate not only affects inflation through aggregate demand, but also through its direct impact on import prices and inflation. The same could be said for the nominal interest when the cost channel is relevant: it has a direct and indirect impact on inflation (Ravenna and Walsh, 2006). The interest rate affects inflation both directly due to its effect on total wage costs, and indirectly because of its effect on the output gap.
Asymmetric demand shocks may occur due to differences in consumption patterns, which also imply that the weight of each sub-index of products in the Harmonized Index of Consumer Prices (HICP) differs across countries. As a result, symmetric changes in the prices of products across the monetary union imply different inflation rates measured by the HICP. However, this effect has not played a relevant role in explaining inflation differentials in the euro area (Hofmann and Remsperger, 2005; ECB, 2003).
On the structural side, a monetary union may have inflation differentials due to price level convergence resulting from both converging tradable and non-tradable prices (ECB, 2003; Hofmann and Remsperger, 2005). Prices of tradable goods converge because of the integration of markets, probably boosted by a single currency. In turn, the euro has raised GDP per capita (Conti, 2014) and fostered real income convergence, which may lead to the convergence of prices of non-tradable goods, as explained by the Balassa-Samuelson effect.
Turning now to empirical models of determinants of inflation differences in the euro area, Honohan and Lane (2003) found that output gap, the change in nominal effective exchange rate (NEER) and price level convergence were significant in explaining inflation differentials in the euro area for the period 1998-2001. Hofmann and Remsperger (2005) examined national inflation rates as opposed to inflation differentials and found that the real exchange rate may act as a correcting mechanism because of its direct effect on inflation. The currency in countries with high inflation experiences real appreciation that has the direct effect of lowering inflation.
In line with Honohan and Lane (2003), Rogers (2002) conclude for the EMU-11 that CPI inflation differentials in the 1997-2000 period were fundamentally explained by the lagged price level, output gap and trade openness2; price level had the expected negative coefficient and the two other variables had positive
coefficients. The lagged per capita GDP also had a negative effect on inflation differentials at a 10% level of significance. The significance of the price level was not sufficiently robust to withstand more substantive analyses and most inflation differences were accounted for by factors other than convergence of prices.
Data used by Angeloni and Ehrmann (2007) covered one year more than that of Honohan and Lane (2003); taking into account data revisions, they confirm that the exchange rate is a determinant of inflation differentials
albeit with a weak statistical significance. In contrast, the significance of the output gap and the lagged price level increases in their estimates.
An updated study by Honohan and Lane (2004) covering two additional years of annual data to obtain a sample for the 1999-2003 period is unable to confirm their previous result for the significance of the change in NEER to explain CPI inflation differentials, although the output gap remains significant. It seems that NEER affects inflation through the output gap in particular. To make evidence even more complex, when using
quarterly data for 1999Q1-2004Q1, they conclude that the level of NEER explains CPI inflation differentials,
but that output gap does not. Regarding exchange rates, they argue that in a monetary union national inflation rates act to correct misalignments in exchange rates: when the euro is under-valued, the increase in inflation acts as a correction mechanism, reducing external competitiveness, especially for countries more exposed to extra-euro trade.
It is clear from the above discussion that there is no consensus in the literature on the significance of output gap or NEER in explaining inflation differences in the euro area. To contribute to the clarification of the relationship between inflation and the business cycle, we will use real ULC as an alternative to output gap. The New Keynesian literature proposes that this is the correct driver of inflation; it also stresses that inflation is forward-looking, with lagged inflation playing a secondary role. Assessing the importance of lagged inflation is of relevance because if inflation is sufficiently persistent, temporary asymmetric shocks of demand and supply may cause persistent inflation differentials (Hofmann and Remsperger, 2005). Besides its contemporaneous value, we also use forward and lagged exchange rate terms to clarify the variable's impact on inflation differentials. The nominal interest rate may also play a direct role in inflation divergence if the cost channel is relevant.
Finally, although fiscal deficits and real interest rate may also have contributed to inflation differentials, this was probably due essentially to the output gap. Along this line, Honohan and Lane (2003) found that after controlling for output gap, fiscal positions did not have a statistically significant effect on inflation divergence in the euro area between 1999 and 2001.
In order to highlight the difference between factors influencing inflation and inflation differentials, we start by explaining national inflation rates and then analyse inflation differentials. The open economy NKPC to describe national inflation rates is:
𝜋𝑖,𝑡= 𝛾𝑓𝐸𝑡𝜋𝑖,𝑡+1+ 𝛾𝑏𝜋𝑖,𝑡−1+ 𝛾𝑚𝑐𝑚𝑐̂𝑖,𝑡+ 𝜸𝒆𝜟𝒆𝒊,𝒕+ 𝜸𝒆𝒇𝑬𝒕𝜟𝒆𝒊,𝒕+𝟏+ 𝜸𝒆𝒃𝜟𝒆𝒊,𝒕−𝟏+ 𝜺𝒊,𝒕 , (1)
where 𝜋𝑡= 𝑝𝑖,𝑡− 𝑝𝑖,𝑡−1 is CPI inflation in t, 𝑝𝑖,𝑡 the log of CPI, 𝑚𝑐̂𝑖,𝑡 is the marginal cost in percentage
deviation from the steady state, 𝑚𝑐𝑖𝑡− 𝑚𝑐𝑠𝑠 (with both marginal costs defined in logs), and Δ𝑒𝑖,𝑡 is the change
in the log of the nominal effective exchange rate. The marginal cost is 𝑚𝑐𝑖𝑡 = 𝑖𝑖,𝑡+ 𝑠𝑖,𝑡− log (𝛼𝑛), where 𝑖𝑖,𝑡 is
the log of the nominal interest rate of country i, 𝑠𝑖,𝑡 the log of labour income share, and 𝛼𝑛 is the elasticity of
labour in the Cobb-Douglas production function.
Expected inflation affect current inflation because agents are forward-looking and prices are rigid. In addition, previous studies (for example, Galí and Gertler, 1999; Galí, Gertler and López-Salido, 2001) have shown that a proportion of agents have backward-looking expectations, justifying the introduction of lagged inflation. The business cycle’s effect in inflation is captured by the labour share, which takes into account wages (𝑤𝑡) and labour productivity (𝑝𝑟𝑡): 𝑠𝑡= 𝑢𝑙𝑐𝑡− 𝑝𝑑𝑡= 𝑤𝑡− 𝑝𝑟𝑡− 𝑝𝑑𝑡, with 𝑝𝑑𝑡 as the GDP deflator. This
Phillips Curve also includes open-economy variables in the spirit of Batini, Jackson and Nickell (2005), with the change in the nominal exchange rate expressing the impact of import prices on CPI inflation. We expect that an appreciation of the euro, i.e., an increase in Δ𝑒𝑖,𝑡, to have a negative impact on inflation (𝛾𝑒< 0). The
expected and lagged values of change in the exchange rate are introduced due to the assumption that expected and lagged domestic inflation affect present domestic inflation (Kara and Nelson, 2003). The lag and lead exchange rates coefficients are expected to be positive (𝛾𝑒𝑓 and 𝛾𝑒𝑏 > 0). Finally, the variable 𝑖𝑖,𝑡 affects
inflation because it is assumed that firms have to pay wages before receiving the income from sales, and so they resort to credit (Barth and Ramey, 2001). As a result, the nominal interest rate affects the marginal cost, which is commonly called the cost channel (Ravenna and Walsh, 2006).
If marginal cost is not expressed in deviations from the steady state, the Phillips curve expressed by equation (1) can be written as:
𝜋𝑖,𝑡= 𝛼 + 𝛾𝑓𝐸𝑡𝜋𝑖,𝑡+1+ 𝛾𝑏𝜋𝑖,𝑡−1+ 𝛾𝑠𝑠𝑖,𝑡+ 𝛾𝑖𝑛𝑖𝑖,𝑡+ 𝛾𝑒𝛥𝑒𝑖,𝑡+ 𝛾𝑒𝑓𝐸𝑡𝛥𝑒𝑖,𝑡+1+ 𝛾𝑒𝑏𝛥𝑒𝑖,𝑡−1+ 𝜺𝑖,𝑡, (2)
with = −𝛾𝑚𝑐[𝑚𝑐𝑠𝑠+ log (𝛼𝑛)] . Then, the constant 𝛼 includes the common steady-state marginal cost. The
NKPC can also be defined using output gap, 𝑥𝑖,𝑡, to measure the business cycle’s impact on inflation: 3
𝜋𝑖,𝑡= 𝛼 + 𝛾𝑓𝐸𝑡𝜋𝑖,𝑡+1+ 𝛾𝑏𝜋𝑖,𝑡−1+ 𝛾𝑥𝑥𝑖,𝑡+ 𝛾𝑖𝑛𝑖𝑖,𝑡+ 𝛾𝑒𝛥𝑒𝑖,𝑡+ 𝛾𝑒𝑓𝐸𝑡𝛥𝑒𝑖,𝑡+1+ 𝛾𝑒𝑏𝛥𝑒𝑖,𝑡−1+ 𝜺𝑖,𝑡. (3)
When estimating equations (2) and (3), data poolability was assumed, i.e., that the equation's coefficients are the same for all countries; Bjørnstad and Nymoen (2008), stress that this has the advantage of bringing efficiency gains. In the euro area, the poolability assumption makes sense as countries are relatively homogeneous: they have been converging in nominal and real terms and share similar monetary and fiscal policy frameworks. The use of panel data with the poolability assumption is also advisable because inflation convergence is an aggregate phenomenon, simultaneously involving the dynamic evolution of a group of countries. In addition, there is no need to explicitly measure common factors when using a panel (which always involves some aggregation problems), because they can be captured by time dummies (as we will see below).
Turning now to inflation differentials, if equation (2) is valid for each country, it can also be applied to the euro area inflation rate, 𝜋𝑒𝑢𝑟𝑜,𝑡. The inflation differential for country i is simply the difference between its
inflation rate and the euro area inflation rate, 𝜋𝑖,𝑡− 𝜋𝑒𝑢𝑟𝑜,𝑡 . Taking into account the determinants of national
and euro area inflation rates suggested by equation (2), the inflation difference for country i can be expressed as: 𝜋𝑖,𝑡− 𝜋𝑒𝑢𝑟𝑜,𝑡= 𝛾′𝑝(𝑝𝑙𝑖,𝑡−1− 𝑝𝑙𝑒𝑢𝑟𝑜,𝑡−1) + 𝛾′𝑓𝐸𝑡(𝜋𝑖,𝑡+1− 𝜋𝑒𝑢𝑟𝑜,𝑡+1) + 𝛾′𝑏(𝜋𝑖,𝑡−1− 𝜋𝑒𝑢𝑟𝑜,𝑡−1) + 𝛾′𝑠(𝑠𝑖,𝑡− 𝑠𝑒𝑢𝑟𝑜,𝑡) + 𝛾′𝑖𝑛(𝑖𝑖,𝑡− 𝑖𝑒𝑢𝑟𝑜,𝑡) + 𝛾′𝑒(𝛥𝑒𝑖,𝑡− 𝛥𝑒𝑒𝑢𝑟𝑜,𝑡)
3 Rotemberg and Woodford (1997) conclude for 𝑚𝑐̂
𝑖,𝑡= 𝑥𝑖,𝑡 using sticky prices, complete nominal wages flexibility and absence of variable
capital. Ravenna and Walsh (2006) assume the existence of the cost channel and express the marginal cost as depending on output gap and the nominal interest rate: 𝑚𝑐̂𝑖,𝑡= 𝜃𝑥𝑖,𝑡+𝑖𝑖,𝑡, where 𝜃 is a parameter dependent on other structural parameters.
+𝛾′𝑒𝑓𝐸𝑡(𝛥𝑒𝑖,𝑡+1− 𝛥𝑒𝑒𝑢𝑟𝑜,𝑡+1) + 𝛾′𝑒𝑏(𝛥𝑒𝑖,𝑡−1− 𝛥𝑒𝑒𝑢𝑟𝑜,𝑡−1) + 𝑢𝑖,𝑡. (4)
Here, the price level 𝑝𝑙𝑡−1 is introduced to capture the price convergence effect (Honohan and Lane, 2003),
as countries with higher price levels are expected to have lower inflation (𝛾𝑝< 0).
The euro area variables can be combined linearly in a time dummy 𝜙𝑡 (Honohan and Lane, 2003). Thus,
inflation differentials can be expressed as:
𝜋𝑖,𝑡= 𝜙𝑡+ 𝛾′𝑝𝑝𝑙𝑖,𝑡−1+ 𝛾′𝑓𝐸𝑡𝜋𝑖,𝑡+1+ 𝛾′𝑏𝜋𝑖,𝑡−1+ 𝛾′𝑠𝑠𝑖,𝑡+ 𝛾′𝑖𝑛𝑖𝑖,𝑡
+𝛾′𝑒𝛥𝑒𝑖,𝑡+ 𝛾′𝑒𝑓𝐸𝑡𝛥𝑒𝑖,𝑡+1+ 𝛾′𝑒𝑏𝛥𝑒𝑖,𝑡−1+ 𝑢𝑖,𝑡. (5)
The model was estimated using a panel of 12 euro area countries: the 11 founders and Greece. The panel comprises the period 1999Q1-2008Q4 and is unbalanced only when interest rate on loans or the price of imports are used. 4 Data is described in the Appendix. It is worth noting that in the empirical application 𝑝𝑙
𝑖,𝑡−1 is a
dummy that takes value one when the price level is above one, in which case the country’s price level is above the European average. This procedure is justified by the fact that the price index is non-stationary.
The estimation was made using Panel GMM due to the presence of expectations. In order to estimate equation (2), expectations are replaced by observed values under the assumption of rational expectations. This assumption implies that agents' forecast errors are not correlated with information available when they form expectations. As a result, we obtain orthogonality conditions to apply GMM.
It is worth mentioning that we do not introduce country fixed effects for two reasons. First, expectations for inflation can accommodate differences in inflation rates that remain constant for the entire sample, without it being necessary to include a constant for this purpose. Second, fixed effects with a lagged dependent variable produce bias in the results.5
4 Before 2003Q1 there were no data available on the interest rate for Luxembourg and before 2000Q1 there were no data available on imports price for Ireland (see data description in the Appendix).
5 Omitting the unobserved fixed effects may also lead to bias. As a robustness check, we perform an estimation with fixed effects (Table 1, equation 4).
It is important to choose good instruments in GMM estimations. We follow the convention in the literature of using at least past information on the endogenous and forcing variables (Binder and Pesaran, 1995). Two additional reasons justify the use of lag variables as instruments. Firstly, as the exchange rate may be endogenous, only lags of this variable can be used as instruments, as the lags are exogenous to period t. Secondly, information for period t may not yet be available when agents form expectations. Therefore, we used two lags of inflation as instruments (t-1 and t-2), one lag of the change in exchange rate, output gap, interest rate and price level. 6 We added some further instruments that proved to have a strong explanatory power in the
first stage regression: CPI lagged two periods, one lag of both the change in import prices and real exchange rate, and a dummy variable for 1999Q1-2002Q4. 78
When choosing instruments, their weakness should be tested because weak instruments are common in forward-looking models with rational expectations (Mavroeidis, 2004). We performed this test using the first stage regression of t+1 inflation on the instruments. Then, we retained the F-statistic of the joint significance of instruments. The same was done for the variation of the exchange rate in t+1. The rule of thumb is that when the F-statistic is larger than 10, the existence of weak instruments can be ruled out (Stock, Wright and Yogo, 2002), which is almost always the case in our estimations.
As the models estimated are overidentified (i.e. the number of instruments is larger than the number of regressors), the correlation between the error term and the instruments can be tested with the J-test. When this test is applied in all of the following regressions, it indicates that instruments are not correlated with the error term.
Finally, we used a weighting matrix and standard deviations robust to arbitrary serial correlation and time-varying variances of the errors (White period method). 9
[INSERT TABLE 1]
6 The inclusion of an additional lag of inflation (t-2) is because lag t-1 is an explanatory variable in the hybrid NKPC.
7 The dummy variable was introduced to accommodate the fact that retail interest rates were not harmonised before 2003Q1 (see Appendix). 8 There are some small changes in instruments depending on the exact specification of the estimated equation. See notes to the tables. 9 The White estimator for the weighting matrix is based on the Panel Corrected Standard Error methodology (Beck and Katz, 1995; Eviews, 2007), where residuals are replaced by moment estimators of the unconditional variance.
Next, estimation results are analysed. Table 1, column (1), shows that we can replicate the traditional features of the hybrid NKPC. Coefficients of both lead and lag inflation are statistically different from zero, and their sum is less than one but not statistically different from one. Also, the forward component of inflation is larger than the backward component. Output gap has a positive but statistically insignificant effect on inflation. The cost channel is present due to the positive and significant effect of the nominal interest rate on inflation. 10
Finally, the coefficients of the change in the NEER have the right signs and the coefficient associated with the lagged rate is statistically significant. If we replace the change in NEER with changes in Real Effective Exchange Rate or in import price deflator, we do not obtain more significant results for these variables. 11
Lagoa (2014) suggests that the correct identification of the cost channel requires the introduction of the relative price of imports (𝑝𝑖𝑖,𝑡− 𝑝𝑑𝑖,𝑡) on the Phillips Curve. Even after introducing this variable, the cost
channel continues to be significant after 2002Q4, but it becomes insignificant before this date ( Table 1, column (3)). 12
The results including country fixed effects are presented for comparison purposes in Table 1, column (4). All the main results remain valid, confirming their robustness.
It can be seen that residuals of the models are autocorrelated. This is because replacing the expectations for variables with observed values induces a first order moving-average structure in the error term (Pesaran, 1987). We tackle this problem by using standard errors robust to autocorrelation.
As in the present paper, several studies confirm the statistical insignificance or the wrong sign of output gap in the NKPC (e.g. Galí and Gertler, 1999; Galí, Gertler and López-Salido, 2001); however, they obtain good results when using the real ULC. 13 When we use the real ULC instead of output gap, results remain unchanged
and real ULC does not have a statistically significant effect on inflation ( Table 1, column (2)); nevertheless, it should be mentioned that the statistical insignificance of the real ULC in the NKPC is not unusual in the literature. In Bjørnstad and Nymoen (2008), which uses panel data, the real ULC has a negative sign and is not
10 The p-value of the null hypothesis of "no interest rate effect on inflation between 1999Q1-2002Q4" is 0.0346. So we do not reject the null hypothesis at a 1% level of significance. The weaker evidence on the cost channel before 2003Q1 probably occurs because interest rate data before this quarter are not fully harmonised across countries.
11 These results are available upon request from the authors.
12 Before 2003Q1 the interest rate is only significant at a 10% level. The p-value of the null hypothesis of "no interest rate effect on inflation between 1999Q1-2002Q4" is 0.0776.
13 Using non-standard measures of output gap, studies by Neiss and Nelson (2005) and Garrat, Lee, and Shields (2009) are among the few that obtain good empirical results when using the output gap in the NKPC.
statistically significant. In a time series context, Bårdsen, Jansen and Nymoen (2004) show that the significance of wage share in Galí, Gertler and López-Salido (2001) for the euro area is not robust to small changes in the estimation methodology.
The fact that we are able to reproduce the basic characteristics of the Phillips curve found in estimations for individual countries constitutes evidence in favour of the poolability of the data.
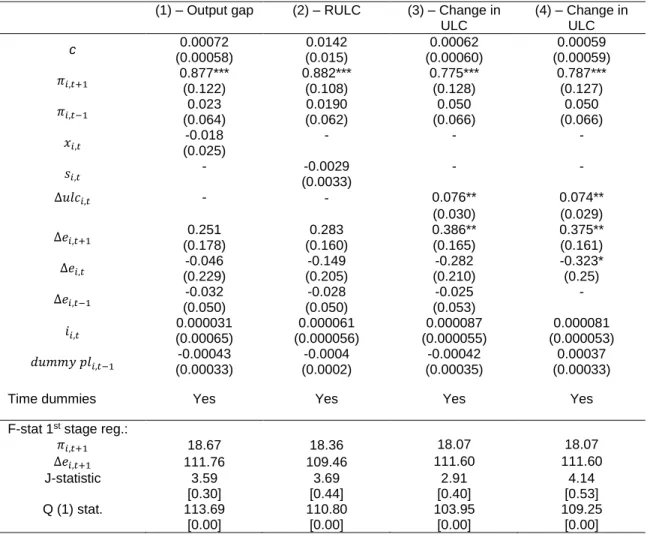
[INSERT TABLE 2]
Turning now to inflation differentials, estimating equation (5) shows that expected inflation is statistically significant and its coefficient is larger than in the equation for national inflation rates (Table 2, column (2)). In contrast, lagged inflation is not statistically significant. Even though the coefficients of exchange rate are also not statistically significant, they have the right signs in t and t+1. However, the coefficient of the lagged change in exchange rate has the wrong sign, confirming that past dynamics do not seem to explain differences in inflation. In turn, output gap has a positive effect but is not statistically significant. 14
Finally, nominal national interest rate and the lagged price level dummy are not statistically significant. In Hofmann and Remsperger (2005) proxies of price level convergence are also not significant in explaining national inflation rates. Likewise, in Rogers (2002), the lagged price level is insignificant in explaining inflation differences when the Arelano-Bond GMM estimator was used. The fact that this variable is also statistically insignificant in our estimates probably means that the level of price convergence in the euro area was already high enough over the sample period. Indeed, Rogers (2007) shows that much of the price level convergence in Europe took place close to the completion of the Single Market in January 1993.
From the above results, we can conclude that the lagged inflation rate and nominal interest rate play a role in explaining national inflation rates, but not in explaining inflation differences across countries.
It should be noted that expectations play a central role in our results. If they are ignored, our results are similar to Honohan and Lane (2003), with output gap, the level of the nominal exchange rate and the lagged price level having a statistically significant impact on inflation differentials (Table 3). The presence of the level
14 We also made an estimation (available upon request) with the relative price of imports, 𝑝𝑖
𝑖,𝑡− 𝑝𝑑𝑖,𝑡, which had a positive but insignificant
of exchange rate can be interpreted as national inflation rates acting to correct disequilibrium in the exchange rate. Another possible interpretation is that with imported inputs in production, the level of exchange rate directly affects marginal cost (Kara and Nelson, 2003).
Returning to the regressions with expectations, the statistical insignificance of output gap is an intriguing result, raising the question of whether the use of an alternative measure of business cycle would produce more significant results. We therefore replace output gap with real ULC, but this variable also proves statistically insignificant (Table 2, column (2)). Overall, inflation expectations is the only element of the New Keynesian approach that is valid for inflation differences, and no significant role is found for interest rate, exchange rate and business cycle indicators.
[INSERT TABLE 3]
There is some preliminary empirical evidence that wage growth is associated with different inflation dynamics in the euro area (ECB, 2003). In addition, Lown and Rich (1997) were able to track inflation in the 1990s using a traditional Phillips curve augmented with nominal ULC growth. Following this evidence, nominal ULC growth was used instead of output gap or real ULC, and a positive and statistically significant coefficient was obtained for that variable (Table 2, column (3)). Most other coefficients of variables remained roughly the same as when output gap was used; the expected change in the exchange rate is the exception as it becomes statistically significant. We can then conclude that the cyclical position influences inflation differentials if it affects the growth in nominal ULC; as this is not a proposed variable for the standard form of the NKPC, it is evidence of the curve's weakness in explaining inflation differences.
In the last estimation, the lagged change in NEER again has the wrong sign. When removed, the expected and current NEER become significant (Table 2, column (4)). As in Honohan and Lane (2003), a depreciation of the euro in t tends to increase inflation differentials. This can be explained by the fact that countries with more imports from outside the euro area suffer higher imported inflation when the exchange rate depreciates. Different velocities of exchange rate pass-through can also account for the temporary impact of movements in the euro on inflation differentials (Honohan and Lane, 2003). However, the exchange rate effect on inflation differentials will probably tend to decrease with time (Honohan and Lane, 2003).
IV. Inflation differentials, imperfect competition model and the NKPC
Given the empirical relevance of nominal ULC, let us look at the imperfect competition model (ICM) of inflation, which defines a role for nominal ULC. Here, we add the cost channel to the ICM presented by Bjørnstad and Nymoen (2008). This model assumes that the price of domestically produced goods, 𝑝𝑑𝑡, is set as a mark-up over nominal ULC and the nominal interest rate, and the mark-up depends on the
relative price of domestic goods in terms of foreign goods,
𝑝𝑖𝑡, (all variables are in logs):
𝑝𝑑𝑡= 𝑚0+ 𝑚1(𝑝𝑖𝑡− 𝑝𝑑𝑡) + 𝑖𝑡+ 𝑢𝑙𝑐𝑡, (6)
where 𝑖𝑡 is the gross nominal interest rate and 𝑚0 is the steady-state mark-up. In equilibrium, there is a
relationship between domestic prices on one hand, and ULC, nominal interest rate and import prices on the other hand. The nominal interest rate affects domestic prices because firms have to pay salaries in advance, i.e., due to the cost channel.
With a constant share of imports in consumption, 1 − 𝛾, the CPI is by definition:
𝑝𝑡= 𝛾𝑝𝑑𝑡+ (1 − 𝛾)𝑝𝑖𝑡. (7)
If we solve (7) for 𝑝𝑑𝑡 and replace the expression obtained in (6), after some manipulations we obtain:
𝑝𝑡= 𝜇0+ 𝜇1(𝑖𝑡+ 𝑢𝑙𝑐𝑡) + (1 − 𝜇1)𝑝𝑖𝑡,
with 𝜇0= 𝑚0𝜇1 and 𝜇1= 𝛾/(1 + 𝑚1). Given that prices are often not in equilibrium, the model should be
𝜋𝑡= 𝜇0𝛽1+ 𝛼𝑓𝐸𝑡𝜋𝑡+1+ 𝛼𝑏𝜋𝑡−1+ 𝛽1(𝑢𝑙𝑐𝑡−1+ 𝑖𝑡−1− 𝑝𝑡−1)
+𝛽2(𝑢𝑙𝑐𝑡−1+ 𝑖𝑡−1− 𝑝𝑖𝑡−1) + 𝛽3Δ𝑢𝑙𝑐𝑡+ 𝛽4Δ𝑝𝑖𝑡+ 𝛽5Δ𝑖𝑡, (8)
with all coefficients α and β positive, except β₂ that is negative. 15 When the last period ULC plus nominal
interest rate is larger than the consumer price index, 𝑢𝑙𝑐𝑡−1+ 𝑖𝑡−1> 𝑝𝑡−1, the disequilibrium is corrected with
an increase in inflation in the current period. This occurs because ULC and nominal interest rate are excessively high compared with prices charged by firms. In turn, if in t-1 the ULC plus nominal interest rate is larger than imports price, 𝑢𝑙𝑐𝑡−1+ 𝑖𝑡−1> 𝑝𝑖𝑡−1, then in t inflation decreases. 16 In the last equation, it was assumed that
the dynamic part of the NKPC is valid: 𝛼𝑓 and 𝛼𝑏 are different from zero.
The open economy NKPC can be expressed in an error correction model of the price level, similar to
(8). The initial equation is:
𝜋𝑡= 𝛼𝑓𝐸𝑡𝜋𝑡+1+ 𝛼𝑏𝜋𝑡−1+ 𝑏𝑚𝑐̂𝑡+ 𝑐𝑧𝑡, (9)
where 𝑚𝑐̂𝑡= (𝑠𝑡+ 𝑖𝑡− 𝑙𝑜𝑔(𝛼𝑛) − 𝑚𝑐𝑠𝑠), 𝑧𝑡is a vector containing open economy variables, like for example
the change in real price of imports, Δ(𝑝𝑖𝑡− 𝑝𝑡); and 𝑠𝑡 is the wage share, defined as
𝑠𝑡= 𝑢𝑙𝑐𝑡− 𝑝𝑑𝑡. (10)
Using (7), (9), and (10), after some manipulations, we obtain:
𝜋𝑡= 𝛼 + 𝛼𝑓 1 +𝑏𝛾 𝐸𝑡𝜋𝑡+1+ 𝛼𝑏 1 +𝑏𝛾 𝜋𝑡−1−𝛽1(𝑝𝑡−1− 𝛾𝑢𝑙𝑐𝑡−1− (1 − 𝛾)𝑝𝑖𝑡−1) +𝛽𝛾Δ𝑢𝑙𝑐𝑡+ 𝛽(1 − 𝛾)Δ𝑝𝑖𝑡+ 𝛽𝛾Δ𝑖𝑡+ 𝜓𝑧𝑡,
15 We do not test for cointegration for the two error correction terms due to the small number of years in the sample. 16 Intuitively, in this situation the import price is low and the mark-up decreases, leading to a fall in inflation.
with 𝛼 = −𝑏(log(𝛼𝑛) + 𝑚𝑐𝑠𝑠), 𝛽 = 𝑏/(𝛾 + 𝑏) and 𝜓 = (𝑐𝛾)/(𝛾 + 𝑏). The last equation can be expressed as 𝜋𝑡= 𝛼 + 𝑤𝑓𝐸𝑡𝜋𝑡+1+ 𝑤𝑏𝜋𝑡−1+𝛽1(𝑢𝑙𝑐𝑡−1+ 𝑖𝑡−1− 𝑝𝑡−1)+𝛽2(𝑢𝑙𝑐𝑡−1+ 𝑖𝑡−1− 𝑝𝑖𝑡−1) +𝛽3Δ𝑢𝑙𝑐𝑡+ 𝛽4(1 − 𝛾)Δ𝑝𝑖𝑡+ 𝛽5Δ𝑖𝑡+ 𝜓𝑧𝑡, with 𝑤𝑓 = 𝛼𝑓 1+𝑏𝛾 and 𝑤 𝑏= 𝛼𝑏 1+𝑏𝛾, 𝛽1= 𝛽 , 𝛽2= −𝛽(1 − 𝛾) , 𝛽3= 𝛽𝛾 , 𝛽4= 𝛽(1 − 𝛾) , and 𝛽5= 𝛽𝛾 . This
equation imposes three restrictions on the ICM: 𝐻0𝑎: 𝛽1+ 𝛽2= 𝛽3, 𝐻0𝑏: 𝛽4= −𝛽2 and 𝐻0𝑐: 𝛽5= 𝛽3. If 𝑧𝑡
includes the change in imports price, then 𝐻0𝑏 is no longer an imposition arising from the NKPC. The
significance of expected inflation is also fundamental for the validity of the NKPC.
In relation to national inflation rates, Bjørnstad and Nymoen (2008) show with an annual panel of 20 OECD countries, from 1960 to 2004, that: (1) the ICM model encompasses the NKPC (𝐻0𝑎 is rejected), and (2) the
expected rate of inflation serves as a replacement for the ICM specific equilibrium correction terms. In other words, when equilibrium terms are included, the coefficient of expected inflation is no longer significant. This means that the omission of equilibrium correction terms creates an upwards bias in the estimate of 𝛼𝑓,
explaining why the lead coefficient of inflation is significant in many estimates of the Phillips curve. Also, for the UK, Bårdsen, Jansen and Nymoen (2004) show that the introduction of two equilibrium correction terms, deviations from a long-run wage curve and an open economy price mark-up, makes forward inflation insignificant.
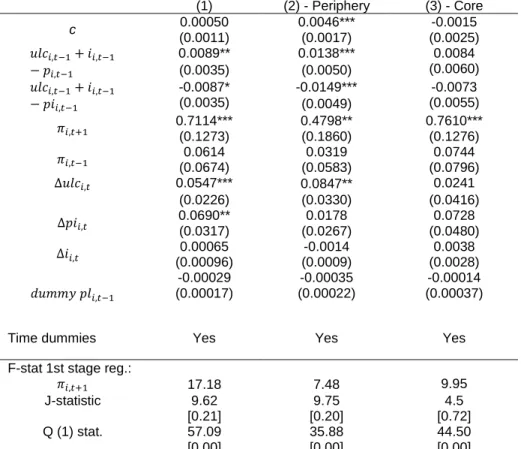
[INSERT TABLE 4]
Based on the previous discussion, ICM is an alternative to the NKPC to explain inflation differentials. Therefore, for this purpose, we augmented the ICM in equation
(8) with the lagged price level dummy and estimated it (Table 4, column (1)). The null hypothesis 𝐻0𝑎 is
rejected, 17 which means that the ICM model is not encompassed by the NKPC. In other words, it is better to
use the ICM model than the NKPC because the former is an unrestricted version of the latter; moreover, the error correction variables are significant.
In addition, previous results obtained in this paper are confirmed: the relevance of expected inflation, the change in the nominal ULC, and change in import prices. We observe that even though the coefficient of expected inflation decreases with the introduction of the error correction variables, it continues to be statistically significant. This confirms the importance of forward inflation in explaining differences in inflation dynamics, a result that to some extent contradicts Bjørnstad and Nymoen (2008).
Although we found above that national inflation rates are persistent, lagged inflation does not explain inflation differentials. However, inflation depends on past economic conditions via the two error correction terms, notably when it includes the CPI (𝑢𝑙𝑐𝑖,𝑡−1+ 𝑖𝑖,𝑡−1− 𝑝𝑖,𝑡−1); additionally, inflation differentials are
explained by the variation in ULC, and if this is persistent (and it is well know that wages in Europe are sticky), then inflation depends on past economic evolution.
It should also be noted that even though the change in nominal interest rate does not have a significant effect on inflation differentials, its level is present in the long term marginal cost, which has a significant impact on inflation. In addition, note that in the regression of Table 2, column 3 and 4, expected change of the exchange rate is statistically significant. Nevertheless, if by analogy we introduce the expected change in import prices in equation (8), this term is statistically non-significant. 18
In order to analyse the impact of countries with a specific and crisis prone evolution, namely Greece, Portugal and Ireland, we removed each from the sample one at a time and re-estimated equation
(8), and found that results basically remain unchanged. 19
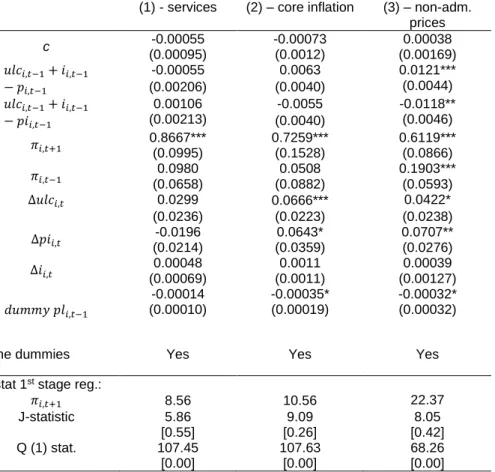
[INSERT TABLE 5]
As the first years of the euro were a transition period, it is interesting to test whether our results hold if we exclude these years; in fact, estimating equation
18 Results available upon request. 19 Results available upon request.
(8) starting in 2001Q1 does not change the main results. 20
Next, we make separate regressions for the peripheral countries more pressured by the sovereign debt crisis (Greece, Portugal, Spain, Ireland and Italy) and for the others (the core countries) – Table 4, columns (2) and (3). The results of both regressions have less statistical significance, which may be explained by the smaller samples, but the signs of the coefficients are broadly similar. It is worth mentioning that for peripheral countries the coefficient of expected inflation decreases relative to the regression including all countries, and the coefficients of the error correction terms increase. Expected inflation is the only statistically significant determinant of inflation for the core countries. These countries have a history of lower and more stable inflation, which may explain why expected inflation is more important and the error correction terms are not statistically significant (see Hofmann and Remsperger, 2005, for a similar result).
In addition, we apply equation
(8) to three sub-indexes of the HICP: index excluding fully administered prices, index excluding energy prices and unprocessed food (used to compute core inflation), and the index for services. For the first index, the existence of administered prices that do not respond to market mechanisms is a source of inflation differentials in Europe (ECB, 2003; Égert, 2007). In turn, core inflation removes the most volatile components of HICP. Energy prices are also an important source of inflation differentials as a result of different levels of oil dependence across European countries (ECB, 2003). Regarding the index for services, differences across countries in inflation for non-traded goods (notably services) are larger than for traded goods (Zdárek and Aldasoro, 2009).
The main determinant of inflation differences in services is expected inflation, and this has a large coefficient - 0.85 (Table 5, column (1)). Core inflation’s differentials are explained by a larger number of variables, notably expected inflation, variation in unit labour costs, variation in import prices and lagged dummy for the price level (Table 5, column (2)). This is one of the few regressions where price convergence is statistically significant, albeit with a small coefficient. We do not find complete support for the ICM in
explaining core inflation convergence because the error correction terms are statistically insignificant; however, the New Keynesian framework is not enough to explain inflation differences due to the significance of the change in the nominal ULC.
Divergence in inflation excluding fully administered prices is essentially explained by the same factors as divergence in overall inflation, with one major exception: lagged inflation is statistically significant (Table 5, column (3)).
Estimating the equation exclusively based on the NKPC for national inflation rates (equation (2)) – i.e. excluding the ICM elements - for services, core inflation and inflation without the administrative prices yields very similar results to those obtained in Table 2: statistical significance of expected inflation and the irrelevance of the other variables, notably of both real ULC and output gap. 21 There is however one difference: the lagged
inflation is relevant for both inflation in services and excluding the administered prices.
In sum, robustness checks essentially confirm our previous analysis, supporting the importance of expectations as a driver of inflation differentials. However, the robustness analysis does not confirm the relevance of the ICM to understand divergence in inflation dynamics in some cases, namely for core countries and inflation in services.
The identified relevance of the nominal ULC for inflation differentials may create destabilising macroeconomic effects because inflation differentials can lead to differences in wage growths that will have a further effect on inflation differentials. This feedback effect may not have a significant impact because, as suggested by Hofmann and Remsperger (2005), the euro area has mechanisms to correct inflation differentials.
V. Conclusion
The main goal of this paper was to identify the determinants of inflation differences in the euro area. For a panel of twelve euro area countries, the estimation of the NKPC with quarterly data for the period 1998Q1-2008Q4 produces similar results to other studies with time-series and panel data. Inflation has both forward- and backward-looking components, but the former is more important. Exchange rates also play a role in price
changes, with lagged exchange rate having a statistically significant impact. The cost channel is present and output gap or real ULC has a positive effect on inflation though it is not statistically significant.
Regarding inflation differentials, we observe that the expected inflation rate and exchange rate movements are important determinants of differences in inflation rates. On the other hand, past dynamic of inflation does not play a very relevant role. The usual measures of business cycle (output gap and real ULC) and interest rate are not statistically significant in causing differences in inflation dynamics. Price convergence is only statistically significant in some estimations, and its economic significance is small. Finally, our results indicate that there is not a direct correspondence between determinants of national inflation rates and determinants of inflation differentials.
It should be noted that expected inflation plays a fundamental role in the results. When this variable was introduced, lagged price level and output gap lost their statistical significance, suggesting they were only significant because they forecast inflation.
The growth in nominal ULC also plays a significant role in explaining inflation differentials. This means that the business cycle affects inflation differentials when it causes differences in wages evolution across countries, as predicted by the ICM. Inflation rate differences are also affected by the lagged disequilibrium in the long-run relationship proposed by the ICM, which involves domestic prices on one hand, and the ULC, nominal interest rate and imports price on the other. Furthermore, the introduction of the error correction terms proposed by the ICM reduced the coefficient of expected inflation but did not eliminate its statistical significance. Also, the ICM model is not encompassed by the NKPC when explaining inflation differences. In sum, our results show that the NKPC is an insufficient framework to explain inflation differentials: its greatest strength is the key role given to expectations. Inflation divergence is explained better using central aspects of the ICM together with expected inflation.
This paper contributes to a better understanding of the functioning of a monetary area, notably to the origin of the euro area sovereign debt crisis. The inflation differentials in the euro area is one of the explanatory factors for the crisis. The inception of the euro meant a significant reduction in interest rates in peripheral economies and thus a marked increase in debt accumulation (Higgins and Klitgaard, 2011). As a result, these economies had positive inflation differentials that weakened their external competitiveness and economic growth. Divergences in inflation rates are linked to differences in the growth in unit labour costs, which according to
Barbosa and Alves (2011) explain dissimilar real exchange rates growth rates. Competitive wage restraint in Germany was also responsible for differences in wage evolution and created balance of payment imbalances (Bibow 2013). In addition, inflation differentials result from the lack of policy coordination and of mechanisms to address asymmetric shocks.
It is clear that inflation differentials present a challenge for the ECB because a common monetary policy becomes sub-optimal and national economies with positive inflation differentials lose external competitiveness. In this context, our results show that managing expectations and controlling labour costs are fundamental to ensure inflation convergence. The ECB should also take the impact of the exchange rate on inflation differentials into account. Given the relevance of labour costs, further work is necessary to assess the empirical relevance of a diverging inflationary cycle arising from the interaction between labour costs and inflation.
Turning now to the immediate response to the euro area debt crisis, peripheral countries and indeed almost all countries followed contractionary fiscal policies to improve fiscal fundamentals. Similarly, wage growth was contained to reduce public expenses and regain external competitiveness.
According to our results, depressed inflation expectations and reduction in unit labour costs led to a decline in inflation and inflation differentials, which reached an all-time low in the euro area. The ECB cut interest rates and resorted to unconventional monetary policy measures due to a scenario of deflation, the approaching of the liquidity trap, a dysfunctional monetary policy transmission mechanism, and the need to finance countries affected by the crisis. This policy included buying covered bonds to banks, conducting longer-term refinancing operations (LTROs) with three years' maturity, the increase of collateral accepted to lend money to banks, buying securities issued by governments (quantitative easing), and forward guidance that will maintain interest rates at low levels for a long period. Forward guidance is an attempt to influence inflation expectations due to its importance for inflation as we have seen above.
The depreciation of the euro caused by the monetary policy measures helped boost aggregate demand and inflation prospects. Although the ECB policy has fostered growth and inflation has regained momentum, more needs to be done in light of the risks of deflation, especially in high-debt countries.
Fiscal policy is known to be an effective tool near the zero lower bound interest rate, when monetary policy becomes less effective. However, peripheral countries cannot use expansionary fiscal policy due to strong market pressures. It should be the central economies that implement this policy as they can afford it and it would
create positive spillovers in the more depressed economies. Higher inflation and wage growth in some countries (notably in the countries with a trade surplus such as Germany) would therefore be beneficial (Moro, 2014). In other words, inflation differentials in the short term are useful as they help reduce the balance of payment imbalances within the euro area. In the current architecture of this area, Germany cannot permanently have a trade surplus (Bibow, 2013).
In order to reduce debt in some countries, Antzoulatos (2012) argues for the need of a higher long term inflation target for the ECB. Likewise, Caraballo and Dabús (2013) claim that the optimal annual inflation rate for Spain would be 4%. Other measures are required to tackle the problems in the euro area and some are already being implemented: banking union (Shambaugh, 2012), structural reforms targeting non-price components of external competitiveness (Estrada, Galí and López-Salido, 2013), and monitoring macroeconomic imbalances (including credit growth and external imbalances) to avoid future crisis (Lane, 2012).
Appendix: Data Description
Data used are described below.
Quarterly inflation (log(𝑝𝑖,𝑡)-log(𝑝𝑖,𝑡−1)) was measured using the seasonally adjusted Harmonized Index of
Consumer Prices (HICP) from Eurostat (𝑝𝑖,𝑡).
Difference of CPI indexes (𝑑𝑖𝑓𝑝𝑖,𝑡}): log(𝑝𝑖,𝑡)-log(𝑝𝑒𝑢𝑟𝑜12,𝑡). HICP for euro area 12 (𝑝𝑒𝑢𝑟𝑜12,𝑡) was obtained
from Eurostat. Both indexes are seasonally adjusted and have value 100 in 2005.
The price level (𝑝𝑙𝑖,𝑡) is a dummy variable computed based on the price level index of household final
consumption expenditure from Eurostat (Honohan and Lane, 2003, also uses this price index). The dummy takes value one if that price level is above one, in which case the country’s price level is above the European average. The price index is obtained by Eurostat as the purchasing power parity of consumption over current nominal exchange rate, with the initial 12 members of euro area as a reference. The quarterly data was obtained interpolating the original annual data with local quadratic polynomial.
Real seasonally adjusted GDP was obtained from OECD Quarterly National Accounts and from International Financial Statistics of IMF (IFS/IMF) for Ireland, Luxembourg and Portugal. The output gap (𝑥𝑖,𝑡)
for each country was calculated as the difference between the log of output and the log of the output trend, with series starting in 1979Q1 or 1980Q1. To calculate the output trend, we used the HP filter with lambda fixed at 1600.
Real ULC (𝑠𝑖,𝑡), or wage share, was obtained dividing the nominal ULC (2005=100) by the GDP deflator
(2005=100).
Nominal unit labour costs (𝑢𝑙𝑐𝑖,𝑡) refer to the trend-cycle series for the entire economy obtained from Main
Economic Indicators/OECD. As ULC for the entire economy for Portugal were not available, we used ULC for the business sector.
Seasonally adjusted GDP deflator (𝑝𝑑𝑖,𝑡) was obtained from OECD National Accounts, except in the cases
of Portugal, Ireland and Luxembourg, for which IFS/IMF data was used.
Nominal effective exchange rate (𝑒𝑖,𝑡) was obtained from IFS/IMF, base year 2005. This measure uses
weights from the trade of manufactured goods. An increase in 𝑒𝑖,𝑡 corresponds to an appreciation of the euro.
Real effective exchange rate (𝑞𝑖,𝑡) is based on relative Consumer Prices, 2005=100, and is from IFS/IMF.
Imports price (𝑝𝑖𝑖,𝑡) seasonally adjusted are measured by import price deflator from Quarterly National
Accounts OECD (Imports of goods and services, 2005=100).
Retail interest rate (𝑖𝑖,𝑡): loans to corporations up to one year from Eurostat. Before 2003Q1, data are not
harmonised. To accommodate this, we used a dummy for the period 1998Q1-2002Q4. Note that as there was no data available for Luxembourg and Finland before 2003Q1, we used the interest rate of loans to firms above one year.
References
Angeloni, Ignazio, and Ehrmann, Michael (2007). Euro area inflation differentials, The B.E. Journal of Macroeconomics 7 (1): 1935-1690. Antzoulatos, Angelos A. (2012). Policy responses to the European Debt Crisis: Treating the ‘symptoms” or the “Disease?, Panoeconomicus
59 (5): 529-552.
Barbosa, João R., and Alves, Rui H. (2011). The Euro area ten years after its creation: (Divergent) competitiveness and the Optimum Currency Area Theory, Panoeconomicus 5, Special Issue: 605-629.
Bårdsen, Gunnar, Jansen, Eilev, and Nymoen, Ragnar (2004). Econometric evaluation of the New Keynesian Phillips curve, Oxford Bulletin of Economics and Statistics 66: 671-686.
Barth, Marvin, and Ramey, Valerie (2001). The cost channel of monetary transmission, NBER Macroeconomic Annual 16: 199-240. Batini, Nicoletta, Jackson, Brian, and Nickell, Stephen (2005). An open-economy New Keynesian Phillips Curve for the UK, Journal of
Monetary Economics 52: 1061-1071.
Beck, Nathaniel, and Katz, Jonathan (1995). What to do (and not to do) with time-series cross-section data, American Political Science Review 89 (3): 634-647.
Binder, Michael, and Pesaran, M. Hashem (1995). Multivariate rational expectations models: a review and some new results. In M. Hashem Pesaran and Michael R. Wickens, editors, Handbook of Applied Econometrics Volume Macroeconomics. Oxford, Blackwell Publishing.
Bjørnstad, Roger, and Nymoen, Ragnar (2008). The New Keynesian Phillips Curve tested on OECD panel data, Economics E-Journal 2: 1-18.
Busetti, Fabio, Forni, Lorenzo, Harvey, Andrew, and Venditti, Fabrizio (2007). Inflation convergence and divergence within the European Monetary Union. International Journal of Central Banking 3 (2): 95-121.
Caraballo, Ma A., and Dabús, Carlos (2013). Price dispersion and optimal inflation: The Spanish case. Journal of Applied Economics 16 (1): 49-70.
Conti, Maurizio (2014). The introduction of the euro and economic growth: Some panel data evidence. Journal of Applied Economics 16 (2): 199-212.
Dullien, Sebastian, and Fritshe, Ulrich (2008). Does the dispersion of unit labor cost dynamics in the EMU imply long-run divergence?. International Economics and Economic Policy 5: 269-295.
ECB (2003). Inflation differentials in the Euro Area: Potential causes and policy implications. Frankfurt, ECB.
Égert, Balázs (2007). Real convergence, price level convergence and inflation differentials in Europe. William Davidson Institute Working Paper No. 895. Michigan.
Estrada, Ángel, Galí, Jordi, and López-Salido, David (2013). Patterns of convergence and divergence in the Euro area. IMF Economic Review 61: 601-630.
Eviews (2007). User's Guide. California, Quantitative Micro Software.
Galí, Jordi, and Gertler, Mark (1999). Inflation dynamics: A structural econometric analysis. Journal of Monetary Economics 44: 195-222. Galí, Jordi, Gertler, Mark, and López-Salido, Jordi D. (2001). European inflation dynamics. European Economic Review 45 (7):
1237-1270.
Galí, Jordi, and López-Salido, J. David (2001). A New Phillips Curve for Spain. BIS Papers No 3. Basel.
Garrat, Anthony, Lee, Kevin, and Shields, Kalvinder (2009). Measuring the natural output gap using actual and expected output gap. University of Leicester Department of Economics Working Papers 09/21. Leicester.
Higgins, Matthew, and Klitgaard, Thomas (2011). Saving Imbalances and the Euro Area Sovereign Debt Crisis. Current Issues in Economics and Finance 17(5): 1-11.
Hofmann, Boris, and Remsperger, Hermann (2005). Inflation differentials among the Euro area countries: Potential causes and consequences. Journal of Asian Economics 16: 403-419.
Honohan, Patrick, and Lane, Philip R. (2003). Divergent inflation rates in EMU. Economic Policy 18 (37): 357-394.
Honohan, Patrick, and Lane, Philip R. (2004). Exchange rates and inflation under EMU: An update. IIIS Discussion Paper No. 31, Dublin Kara, Amit, and Nelson, Edward (2003). The exchange rate and inflation in the UK, Scottish Journal of Political Economy 50 (5):
585-608.
Lagoa, Sérgio (2014). Inflation dynamics in open economies: Empirical evidence for G7 countries on the role of import prices and the cost channel. Research in Economics, 68(4): 354-371.
Lane, Philip R. (2006). The Real Effects of European Monetary Union. Journal of Economic Perspectives 20: 47-66. Lane, Philip R. (2012). The European Sovereign Debt Crisis. Journal of Economic Perspectives 26 (3): 49-68.
Lown, Cara S., and Rich, Robert W. (1997). Is there an inflation puzzle?. Federal Reserve Bank of New York Economic Policy Review December: 51-69.
Mavroeidis, Sophocles (2004). Weak identification of forward-looking models in monetary economics. Oxford Bulletin of Economics and Statistics 66: 609- 632.
Moro, Beniamino (2014). Lessons from the European economic and financial great crisis: a survey. European Journal of Political Economy 34: S9-S24.
Neiss, Katharine S., and Nelson, Edward (2005). Inflation dynamics, marginal cost, and the output gap: evidence from three countries. Journal of Money, Credit, and Banking 37 (6): 1019-1045.
Paloviita, Maritta (2008). Comparing alternative Phillips curve specifications: European results with survey-based expectations. Applied Economics 40 (17): 2259-2270.
Pesaran, M. Hashem (1987). The Limits of Rational Expectations. Oxford, UK, Basil Blackwell.
Ravenna, Federico, and Walsh, Carl E. (2006). Optimal monetary policy with the cost channel. Journal of Monetary Economics 53 (2): 199-216.
Rogers, John H. (2002). Monetary union, price level convergence, and inflation: How close is Europe to the United States?. International Finance Discussion Papers No. 740. Washington, Board of Governors of the Federal Reserve System.
Rogers, John H. (2007). Monetary union, price level convergence, and inflation: How close is Europe to the USA?. Journal of Monetary Economics 54: 785-796.
Rotemberg, Julio, and Woodford, Michael (1997). An Optimization-based econometric framework for the evolution of monetary policy. NBER Macroeconomic Annual 1997 12: 297-346.
Shambaugh, Jay C. (2012). The Euro’s three crises. Brookings Papers on Economic Activity Spring: 157-211.
Stock, James H., Wright, Jonathan H., and Yogo, Motohiro (2002). A survey of weak instruments and weak identification in Generalized Method of Moments, Journal of Business and Economic Statistics 20: 518-529.
Vines, David, Kirsanova, Tatiana, and Wren-Lewis, Simon (2006). Fiscal Policy and Macroeconomic Stability within a Currency Union. CEPR Discussion Paper No. 5584, London.
Zdárek, Václav, and Aldasoro, Juan I. (2009). Inflation Differentials in the Euro area and their determinants – an empirical view. Kiel Advanced Studies Working Paper No. 450, Kiel, Kiel Institute for the World Economy.
Figure 1 - Cross section standard deviation of inflation rates after 1998
Table 1 - GMM estimation of the NKPC for a panel of 12 euro area countries (1) (2) (3) (4) c -0.00088 -0.010 -0.00033 -0.011 (0.00057) (0.023) (0.00063) (0.037) 𝜋𝑖,𝑡+1 (0.014) 0.83*** (0.098) 0.89*** 0.68*** (0.111) (0.121) 0.84*** 𝜋𝑖,𝑡−1 (0.073) 0.13* (0.070) 0.092 (0.068) 0.14** (0.080) 0.117 𝑥𝑖,𝑡 (0.014) 0.013 - (0.015) 0.011 - 𝑠𝑖,𝑡 - (0.0050) 0.0020 - (0.0079) 0.0021 Δ𝑒𝑖,𝑡+1 (0.058) 0.057 (0.057) 0.044 (0.060) 0.059 (0.058) 0.062 Δ𝑒𝑖,𝑡 (0.007) -0.045 (0.066) -0.017 (0.075) -0.057 (0.072) -0.041 Δ𝑒𝑖,𝑡−1 0.051*** (0.018) 0.049*** (0.018) 0.049** (0.017) 0.049** (0.019) 𝑖𝑖,𝑡 0.00026** 0.00022** 0.00030** 0.00044** (0.00010) (0.00010) (0.00012) (0.00018) 𝑖𝑖,𝑡∙ 𝐷𝑡 -0.00014** -0.00011* -0.00020** -0.00017 (0.000065) (0.000064) (0.000088) (0.00011) 𝑝𝑖𝑖,𝑡− 𝑝𝑑𝑖,𝑡 - - 0.0084** (0.0034) - Country fixed effect No No No Yes F-stat 1st stage reg.: 𝜋𝑖,𝑡+1 11.72 11.53 12.37 6.85 Δ𝑒𝑖,𝑡+1 18.33 16.63 18.46 8.87 J-statistic 2.48 3.45 3.78 3.25 [0.28] [0.32] [0.15] [0.35] Q (1) stat. 80.678 78.809 82.857 78.808 [0.00] [0.00] [0.00] [0.00]
Note: Panel GMM with period SUR weights and robust standard deviations. Instruments: Eq. (1): constant, 𝜋𝑖,𝑡−1, 𝜋𝑖,𝑡−2, 𝑥𝑖,𝑡−1,
Δ𝑒𝑖,𝑡−1, Δ𝑝𝑖𝑖,𝑡−1, 𝑞𝑖,𝑡−1, 𝑖𝑖,𝑡−1, 𝑝𝑙𝑖,𝑡−1, 𝑝𝑖,𝑡−2 and one dummy, 𝐷𝑡, that takes the value one for the period 1999Q1-2002Q4. The
variable q is the real exchange rate. Eq. (2): the same as eq. (1) plus 𝑠𝑖,𝑡−1.Eq. (3): the same as eq. (1) plus 𝑝𝑖𝑖,𝑡−1−𝑝𝑑𝑖,𝑡−1. Eq.
(4): the same as eq. (1) plus country dummies. (...) contain standard errors robust to arbitrary serial correlation and time-varying variances of the errors. [...] contain p-values. "***" means significance at 1%, "**" at 5%, and "*" at 10%. Q(1) is the Ljung-Box statistics to test zero autocorrelation in the residuals up to lag 1.
Table 2 - Determinants of inflation differentials for a panel of 12 euro area countries. GMM estimation
(1) – Output gap (2) – RULC (3) – Change in ULC (4) – Change in ULC c 0.00072 0.0142 0.00062 0.00059 (0.00058) (0.015) (0.00060) (0.00059) 𝜋𝑖,𝑡+1 0.877*** (0.122) 0.882*** (0.108) 0.775*** (0.128) 0.787*** (0.127) 𝜋𝑖,𝑡−1 (0.064) 0.023 (0.062) 0.0190 (0.066) 0.050 (0.066) 0.050 𝑥𝑖,𝑡 (0.025) -0.018 - - - 𝑠𝑖,𝑡 - (0.0033) -0.0029 - - Δ𝑢𝑙𝑐𝑖,𝑡 - - 0.076** 0.074** (0.030) (0.029) Δ𝑒𝑖,𝑡+1 (0.178) 0.251 (0.160) 0.283 0.386** (0.165) 0.375** (0.161) Δ𝑒𝑖,𝑡 (0.229) -0.046 (0.205) -0.149 (0.210) -0.282 -0.323* (0.25) Δ𝑒𝑖,𝑡−1 (0.050) -0.032 (0.050) -0.028 (0.053) -0.025 - 𝑖𝑖,𝑡 0.000031 0.000061 0.000087 0.000081 (0.00065) (0.000056) (0.000055) (0.000053) 𝑑𝑢𝑚𝑚𝑦 𝑝𝑙𝑖,𝑡−1 -0.00043 -0.0004 -0.00042 0.00037 (0.00033) (0.0002) (0.00035) (0.00033)
Time dummies Yes Yes Yes Yes
F-stat 1st stage reg.:
𝜋𝑖,𝑡+1 18.67 18.36 18.07 18.07 Δ𝑒𝑖,𝑡+1 111.76 109.46 111.60 111.60 J-statistic 3.59 3.69 2.91 4.14 [0.30] [0.44] [0.40] [0.53] Q (1) stat. 113.69 110.80 103.95 109.25 [0.00] [0.00] [0.00] [0.00]
Notes: See notes to Table 1. Instruments: eq. (1): constant, 𝜋𝑖,𝑡−2, Δ𝑒𝑖,𝑡−1, Δ𝑝𝑖𝑖,𝑡−1, 𝑞𝑖,𝑡−1, 𝑖𝑖,𝑡−1, 𝑝𝑙𝑖,𝑡−1, 𝑑𝑢𝑚𝑚𝑦 𝑝𝑙𝑖,𝑡−1
,
𝑝𝑖,𝑡−2,𝑝𝑖,𝑡−3, 𝑑𝑖𝑓𝑝𝑖,𝑡−1 and time dummies. Eq. (2): the same as eq. (1) plus 𝑠𝑖,𝑡−1. Eq. (3) and (4): the same as eq. (1) plus Δ𝑢𝑙𝑐𝑖,𝑡−1.
Table 3 - Determinants of inflation differentials ignoring expectations. GMM estimations for a panel of 12 euro area countries.
c 𝑥𝑖,𝑡 𝑒𝑖,𝑡 𝑝𝑙𝑖,𝑡−1
Coeff. 0.54*** 0.11*** -0.117*** -0.031***
s.e. (0.18) (0.04) (0.039) (0.0082)
Time dummies: Yes
J-statistic: 2.59 Q (2) stat.: 291.12
[0.62] [0.00]