0 ECONOMIC DECISION TO USE TELEDERMATOLOGY – AN APPLICATION TO
PORTUGUESE NATIONAL HEALTH SYSTEM
João Furtado Severino Pinto
Dissertation submitted as a partial requirement for the conferral of
Master in Economics
Supervisor:
Felipa de Mello-Sampayo, Assistant Professor, ISCTE Business School, Department of Economics
1 ECONO MIC DECISIO N T O U S E TE LED ERM AT OL OG Y – AN APP LI C AT IO N T O POR TU G UE S E N AT IO N AL HE A LTH S YSTEM João Fu rtado S eve rin o Pin to
2 Abstract
The modeling strategy is designed to highlight the impact of health level’s uncertainty on using teledermatology in dermatology treatment. The option-pricing theory is followed very closely to develop a dynamic stochastic model for the optimal timing to use teledermatology. Its main value-added consists in the concrete application to a problem in medical decision taking, i.e. to patients with skin-care diseases. In the period from January 2017 to June 2017, a total of 152 patients were sent by 24 PCCs of the public health system to the Portuguese Dermatology Department of Hospital Garcia d’Orta (HGO). Patients were subjected to conventional care or teledermatology. The aim is to analyze the rate of treatment for their skin-diseases, under both lines of treatment. The empirical results support the findings of the analytical model. The results indicate that if the line of treatment is teledermatology, ceteris paribus, the rate of treatment increases around three-fold comparing to conventional care. The main policy implication of this thesis’ results is that there are strong advantages in terms of time and treatment rate of using and implementing teledermatology in the Portuguese NHS.
Keywords: health economics, decision analysis, survival analysis, teledermatology.
3 Resumo
A estratégia de modelização é delineada de forma a destacar a incerteza do estado de saúde de pacientes associada à utilização da teledermatologia no tratamento de doenças dermatológicas. A teoria “option-pricing” é seguida de forma a desenvolver-se um modelo estocástico dinâmico para a calendarização óptima da utilização da teledermatologia. A sua mais-valia consiste na aplicação empírica à tomada de decisão clínica, isto é, a pacientes do Serviço Nacional de Saúde (SNS) diagnosticados com doenças dermatológicas. No período entre Janeiro e Junho de 2017, 152 pacientes foram encaminhados de 24 centros de saúde do sistema público de saúde para o Serviço de Dermatologia do Hospital Garcia d’Orta (HGO) em Almada, Portugal. Os pacientes foram sujeitos a diferentes metodologias de tratamento, isto é, consultas convencionais ou teledermatologia. O objectivo da tese é analisar a taxa de sucesso do tratamento de doenças dermatológicas sob as duas metodologias de tratamento. A aplicação empírica confirma os resultados da modelização. A aplicação indica que, se a metodologia de tratamento for a teledermatologia, ceteris paribus, a taxa de sucesso no tratamento de doenças dermatológicas triplica, aproximadamente, comparada com as consultas convencionais. A principal implicação política dos resultados da tese é que existem vantagens, relativamente ao tempo e taxa de sucesso do tratamento, que advêm da implementação e utilização da teledermatologia no SNS.
Keywords: economia da saúde, análise de decisão, análise de sobrevivência, teledermatologia.
4 Acknowledgments
We are grateful to the Dermatology Department of Hospital Garcia d’Orta (HGO) at Almada, Portugal for making available the data used on this master-thesis. The author gratefully acknowledges support from Felipa de Mello-Sampayo for her relevant contribution, namely both adapting her option-pricing theoretical model to the dermatology decision and its empirical set-up.
I Table of Contents
List of Tables ... II List of Figures ... III
1. Introduction ... 1
2. Literature Review ... 4
3. Dermatology Department of Hospital Garcia d’Orta (HGO) ... 11
3.1. Clinical characteristics of patients ... 11
3.2. Geographic locations ... 12
3.3. Waiting times ... 14
3.4. Steps from request to treatment ... 14
4. Theoretical Framework... 18 4.1. The model ... 19 5. Survival Analysis ... 25 5.1. Univariate analysis ... 26 5.2. Results ... 28 5.3. Survival functions ... 33 6. Conclusion ... 36 7. References ... 38
II List of Tables
Table 1. Log-rank test and Cox regression for Predictors ... 27
Table 2. Results for the Survival Analysis ... 29
Table 3. Hazard Ratios for SF=f(TD, σ, DIST. PCC TO HGO, AGE) ... 30
Table 4. Test of the Proportionality Assumption ... 31
III List of Figures
Figure 1. Patients of HGO subjected to different lines of treatment ... 11
Figure 2. Gender and Age of patients of HGO ... 12
Figure 3. Skin-diseases diagnosed on patients of HGO ... 12
Figure 4. Distribution of requests to HGO by PCC ... 13
Figure 5. Distribution by Zip-Codes and Average distance (in minutes) from home to PCC ... 14
Figure 6. Average distance (in minutes) from home to PCC and HGO ... 14
Figure 7. Waiting time (in days) from request to first doctor visit at HGO under different lines of treatment ... 15
Figure 8. Waiting time (in days) from request to surgery at HGO under different lines of treatment ... 15
Figure 9. Patients subjected to CC: Steps from request to treatment (%) ... 16
Figure 10. Patients subjected to TD: Steps from request to treatment (%) ... 16
Figure 11. Activity Map – Steps of Treatment ... 19
Figure 12. Kaplan-Meier curve for TD, DV and Gender ... 28
Figure 13. Graphs of Scaled Schoenfeld Assumption ... 33
Figure 14. SF for a patient with TD=0, Age=68, DIST PCC to HGO=16 and Sigma=43 ... 34
Figure 15. SF of CC versus TD ... 34
1 1. Introduction
The main objective of this thesis is to analyze the economic decision to use teledermatology versus the conventional care in the treatment of skin diseases in the Portuguese National Healthcare System (NHS). The application of teledermatology to remote consultations can be categorized in two main groups: store-and-forward-system (SFS) that consists in a system of store-and-forward data regarding requests of remote consultations, in which data, after forwarded, is stored in a database and it is acceded over a variable period of time, i.e. communication between parties involved in process is asynchronous; and real-time that consists in a system in which data and communication between intervening parties is synchronic. This thesis is focused on SFS, because it is the category available to users of the Portuguese NHS.
According to Diário da República Electrónico (2017), maximum response times (in Portuguese: tempos máximos de resposta garantidos (TMRG)) for a non-urgent doctor visit at primary care centers by initiative of patients is 15 workdays and by request of hospitals is 30 workdays. TMRG for normal first doctor visits at hospitals by request of primary care centers is 120 days and for normal surgeries at hospitals is 180 days. Maximum response times for priority and high priority doctor visits and surgeries at hospitals are not defined on Diário da República. According to Tribunal de Contas (2017), TMRG were violated on 29% of cases in 2016. In response, the dermatology departments of Portuguese hospitals are increasingly making available the service of teledermatology; according to Administração Regional de Saúde Lisboa e Vale do Tejo (ARS LVT, 2017), it amounted to 17 in 2016.
In this thesis, it is analyzed the particular case of a total of 152 patients treated by the Dermatology Department of Hospital Garcia d’Orta (HGO) and 24 Primary Care Centers (PCC) of that geographical area for the period from January 2017 to June 2017. It is concluded that patients that were subject to Conventional Care (CC) and did need a surgery (i.e. 53 patients representing 84,1% of the patients subjected to CC) had to wait more time to get their treatments than patients subjected to teledermatology (TD). Patients that were subjected to CC and did not need a second visit nor a surgery (i.e. 10 patients representing 15,9% of the patients subjected to CC) went to an unnecessary first visit at HGO; if these patients were subjected to TD and there was no need to visit the hospital, then they could treat their diseases using a cheaper solution, i.e. visiting PCCs. Assuming that distance and waiting time have an opportunity cost, the cost of visiting PCC is lower than visiting the hospital and the cost of TD is lower than CC.
2 There are several advantages to the adoption of teledermatology, one of which is that an adequate response to patients is provided in short-run (e.g. early diagnosis of serious skin-diseases, like melanoma) and this would help prevent worsening of clinical situation of patients in long-run. Demographic phenomena like ageing of the population and the desertification of rural and interior areas could emphasize the role of teledermatology in preventing the development of skin-related diseases. In regard to the disadvantages to the adoption of teledermatology in clinical practice, good quality dermoscopic images requires skills, appropriate material and time. Bad imaging can lead to diagnosis errors.
The economic evaluation of teledermatology has, traditionally, relied upon cost-analysis and cost-effectiveness cost-analysis. The cost cost-analysis compares costs of a line of treatment provisioning teledermatology versus a line of treatment provisioning conventional care. A cost-effectiveness analysis compares not only costs but also effectiveness of a line of treatment provisioning teledermatology versus a line of treatment provisioning conventional care. Both methods usually apply a sensitivity-analysis i.e. change the variables selected across an expected range of values in order to find how variance of data-assumptions would influence costs or outcomes.
The decision to adopt a particular treatment should be based on expected net benefit (NB) so that, when comparing mutually exclusive treatment strategies for a particular disease, the optimal strategy is simply the one with the highest expected NB. Nevertheless, decisions based on expected NB are only appropriate if there is also some consideration of whether current evidence is sufficient for allocating health-care resources, based on an assessment of the consequences of decision uncertainty. If the decision uncertainty and the consequences of adopting a suboptimal treatment strategy are large, the decision-maker may require further evidence on which to base the adoption decision (Claxton et al., 2005).
This thesis follows the option-pricing theory very closely to develop a dynamic stochastic model for the optimal timing of a treatment switch. Its main value-added consists in the concrete application to a problem in medical decision taking, i.e. to Portuguese patients with skin-care diseases. In the stochastic model, we assume two types of treatment in treating a skin-care disease and we consider the problem of a patient that is using the conventional care and the decision maker is contemplating switching to teledermatology that consists of SFS. The patient will use the teledermatology only if such a move is deemed beneficial in the medium and long term. That, in turn, will depend
3 on the perceived evolution of health level. The higher the uncertainty, the more likely it is that a favorable situation will turn into an unfavorable one, and the more the decision maker will gain from waiting for more information before committing to the new treatment.
The theoretical model presented gives clear indications regarding the decision to use TD under health level uncertainty. It predicts that the higher the volatility of the patient's particular characteristic, the less probable is to use TD, the higher the cost of TD, the more valuable the option of using TD will be, and so the fewer TD will be observed. Conversely, the higher the trend of the patient's particular characteristics, the higher the discount factor and the higher the cost of CC, the more use of TD one would expect to observe. These results were tested using the survival analysis. The main empirical result indicates that if the line of treatment is TD, and all other variables are held constant (ceteris paribus), the rate of treatment increased three-fold. This result combined with the negative effect of age, distance and health level uncertainty strongly suggest the use of TD.
This thesis is structured as follows. First, the related literature is reviewed. In Chapter 3 the data of Portuguese Dermatology Department of Hospital Garcia d’Orta (HGO) is discussed. The theoretical model is derived using the option-pricing theory in Chapter 4. Then, in Chapter 5, the theoretical model results are tested using the data of the Dermatology Department of HGO with the survival analysis. Finally, conclusions and future research are presented in Chapter 6.
4 2. Literature Review
This literature review intends to review the research related to teledermatology, economic analysis of teledermatology and option-pricing theory applied to health economics. First, different approaches are compared, highlight different assumptions, and present main empirical results in teledermatology and the economic analysis of teledermatology. Then, the application of the option-pricing theory applied to health economics is discussed.
It is important to research how accurate and reliable is teledermatology compared to in-person diagnosis and what are the key advantages and disadvantages to the adoption of teledermatology in clinical practice (Finnane et al., 2016) in order to maximize the benefits to patients and minimize costs. The application of teledermatology to remote consultations can be categorized in two main groups: store-and-forward-system (SFS) that consists in a system of store-and-forward data relative to requests of remote consultations, in which data, after forwarded, is stored in a database and is acceded on a variable period of time, i.e. communication between parties involved in process is asynchronous; and real-time that consists in a system in which data and communication between intervening parties is synchronic and on real time (Massone et al., 2013).
Regarding the accuracy and reliability of teledermatology compared to in-person diagnosis, van der Heijden et al. (2013) calculate, using Cohen’s Kappa statistics (κ), that the 108 teledermoscopy consultations have an accuracy of κ 0.61 on diagnostic group - that is interpreted as substantial agreement - and of κ 0.23 on management plan (i.e. “proposed course of (...) treatment regimens linking the patient (...) diagnosis to the resolution of patient’s presenting condition…” (Medical dictionary, 2018)) - interpreted as fair agreement; also, van der Heijden et al. (2013) show an inter-observer reliability (i.e. concordance between diagnosis using teledermatology and in vivo consultation) of κ 0.65 on diagnostic group - interpreted as substantial agreement - and of κ 0.36 on management plan - interpreted as fair agreement. Authors conclude that teledermoscopy used in general practice has a lower accuracy and reliability compared to in vivo consultation. In turn, Massone et al. (2013) calculate that the diagnostic sensitivity (i.e. “the conditional probability that a person having a disease will be correctly identified by a clinical test (...)” (Medical dictionary, 2018)) is 100%, the diagnostic specificity (i.e. “the probability that a person not having a disease will be correctly identified by a clinical test (...)” (Medical dictionary, 2018)) is 95,8%, and the diagnostic accuracy using teledermatology is 94%; this study was performed on 690 patients in which 962
5 dermoscopic and 123 clinical images from 962 lesions were sent. Massone et al. (2013) conclude that teledermatology is suitable to triage skin-cancer.
An important factor to be taken into consideration is the image quality: in cases in which the diagnosis is based on good quality images (36,1% of cases), research by van der Heijden et al. (2013) prove that, not only there is a substantial agreement on accuracy (κ 0.68) and reliability using teledermatology compared to in vivo consultations (κ 0.66) on diagnostic group, but also that the agreement on accuracy (κ 0.42) and reliability using teledermatology compared to in vivo consultations (κ 0.42) on management plan is moderate. In turn, research by Massone et al. (2013) show that teleconsultants judged 88% of dermoscopic images of excellent quality. Therefore, it becomes clear that it is fundamental to emphasize the importance of good quality images of skin-diseases of patients captured by general practitioners (GP) in order to dermatologists diagnose with great degree of accuracy and reliability.
One of the most substantial differences between van der Heijden et al. (2013) and Massone et al. (2013) is their assumptions. In van der Heijden et al. (2013), teledermoscopy images were taken by GP during regular practice. In Massone et al. (2013) teledermoscopy images were taken by previously trained GP and the diagnosis was made by teleconsultants highly experienced, thus data confirm the value of teledermatology when performed by experts. It is clear that GP should be trained in order to get good quality images and dermatologists should be experienced in teledermatology in order to provide more accurate and reliable diagnoses; if both conditions described are met, teledermatology is a very accurate tool.
In regard to the disadvantages to the adoption of teledermatology in clinical practice, van der Heijden et al. (2013) mention that taking good quality images of skin-diseases of patients (note that it is generally considered the main barrier) could be difficult for GP during everyday practice, because GP were overloaded, thus taking the time to take good quality dermoscopic images could have been difficult; even though GP were trained to use teledermatology, these skills were lost in the sense that suitable patients for inclusion did not present themselves on a daily basis; and equipment problems (e.g. low battery of the cameras) often hamper taking good quality images.
In turn, there are some strong advantages to the adoption of teledermatology, one of which is that an adequate response to patients is provided in short-run (e.g. early diagnosis of serious skin-diseases, like melanoma) and this would help prevent worsening of clinical situation of patients in long-run; van der Heijden et al. (2013) mention that
6 “Since the therapeutic options for metastatic melanoma are still very poor, methods for early diagnosis, which will have a positive effect on the prognosis, are needed” (van der Heijden et al., 2013, p. 50). Massone et al. (2013) anticipate that “The World Health Organization estimates that between 2 and 3 million non-melanoma skin cancers (NMSCs) and 132 000 melanomas occur each year worldwide. Moreover, due to the progressive increase growth and ageing of population also an increase in skin cancer in the next years is expected” (Massone et al., 2013, p. 4), and Finnane et al. (2016) note that teledermatology could be a very useful tool “(...) particularly important for countries with high rates of skin cancers and geographically dispersed populations (...)” (Finnane et al., 2016, p. 8). To conclude, demographic phenomena like the ageing of the Portuguese population and the desertification of rural and interior areas could make the role of teledermatology even more important in Portugal.
It is key to analyze to determine whether or not teledermatology saves time and money to both patients and health care system compared to in-person diagnosis (Finnane et al., 2016). Based on further studies, van der Heijden et al. (2013) state that teledermatology contributes to more efficient and cheaper healthcare, Massone et al. (2013) claim that the rationale of teledermatology is to reduce waiting lists times for a dermatologic consultation, and Finnane et al. (2016) assert that teledermatology reduces waiting times to assessment and diagnosis. Thus, it becomes fundamental to analyze those further studies.
The economic analysis of teledermatology consists of a analysis and cost-effectiveness analysis. The cost-analysis compares costs of a line of treatment provisioning teledermatology versus a line of treatment provisioning conventional care. A cost-effectiveness analysis compares not only costs but also effectiveness of a line of treatment provisioning teledermatology versus a line of treatment provisioning conventional care. Both methods usually apply a sensitivity-analysis i.e. change the variables selected across an expected range of values in order to find how variance of data-assumptions would influence costs or outcomes.
Whited et al. (2003) present cost and cost-effectiveness analyses with the aim of assessing the economic impact of teledermatology of SFS type in a study with 275 patients referred from the Primary Care Clinics to the Dermatology Consult Service at the Durham, North Carolina Veterans Affairs (VA) Medical Center; 135 patients were randomly assigned to teledermatology and 140 to conventional care. For the purpose of performing a cost-analysis, Whited et al. (2003) implement a micro-costing approach in
7 order to identify and collect costs, which are inputs consumed in a clinical intervention, and to calculate cost-estimates. Fixed costs borne by the VA health care system were considered (e.g. teledermatology equipment, maintenance and communication commodities) as well as variable costs incurred by the VA health care system (e.g. labor costs of dermatologists and nursing care); thus, the economic perspective chosen to analyze the impact of teledermatology is the perspective of the VA health care system. Moreno-Ramirez et al. (2009) present similar cost-analyses in a study with 2009 teledermatology referrals conducted at the Skin Cancer Clinic of the Hospital Universitario Virgen Macarena and twelve primary care centers (PCCs), however there is an important addition to the methodology compared to Whited et al. (2003): it takes into cost-analysis the costs paid by patients, i.e. travel to the skin cancer clinic and working time lost; thus, the economic perspective chosen to analyze the impact of teledermatology is the societal perspective, i.e. all costs and outcomes that affect society are considered. It is important to emphasize that the economic perspective chosen to analyze the impact of teledermatology is key, because what may have more costs to a single entity (e.g.VA) may also represent a cost-saving result to all society.
Based on the cost-analysis, Whited et al. (2003) conclude that teledermatology is not cost-saving compared to conventional care, i.e. there is an incremental cost per patient ($15) using teledermatology; based on the cost-effectiveness analysis, authors add that effectiveness (measured in terms of days to clinical intervention) improves, i.e. there is an incremental effectiveness (87,5 days) using teledermatology, and the incremental cost-effectiveness ratio is obtained by dividing the incremental cost by the incremental effectiveness, i.e. there is a cost of $0,17 per patient per day saved (Whited et al., 2003, p. 355); thus, teledermatology has greater effectiveness but incurs in higher cost. Based on the teledermatology references, we think that this is an acceptable cost in order to provide early diagnosis, particularly in the case of serious skin-diseases like skin-cancer. In turn, Moreno-Ramirez et al. (2009) conclude that teledermatology is cost-saving compared to usual care (-€49.59 per patient), effectiveness (measured in terms of average waiting interval) also improves (76.31 days of waiting time avoided) and the incremental cost-effectiveness ratio shows that there is a saving of €0.65 per waiting day avoided (Moreno-Ramirez et al., 2009, p. 44); thus, teledermatology demonstrates dominance (i.e. less cost and more effectiveness) compared to usual care.
Whited et al. (2003) perform sensitivity analyses of cost (assuming different conditions) and determine that the cost per patient per day saved decreases from $0,17
8 (base-case analysis) to $0,12 (assuming “intention to treat probability of a patient presenting for a clinic visit, if scheduled, with the use of VISTA Imaging”) (Whited et al., 2003, p. 356). Then, the authors perform sensitivity-analysis of cost-saving thresholds and show that the reimbursement (from VA) of clinic visit costs were required to be much higher and, simultaneous, the probability that a teledermatology patient is scheduled for a clinic visit had to be much lower in order to teledermatology to be cost-saving; or the reimbursement of travel costs would have to be much higher in order to achieve the same purpose. Moreno-Ramirez et al. (2009) also present sensitivity analysis: assuming a lower proportion of clinic visits avoided, teledermatology is still a dominant strategy; assuming a communication network for the exclusive use of teledermatology, teledermatology is not cost-saving but it is cost-effective (i.e. there is a cost of $0,16 per patient per day of waiting time avoided).
The measures of effectiveness selected by Whited et al. (2003) and Moreno-Ramirez et al. (2009) (respectively: days to clinical intervention and average waiting interval) are intermediate outcomes, i.e. an outcome that should occur in order to achieve a definitive outcome. In an innovative way, Datta et al. (2015) select a definitive outcome as the measure of effectiveness: utility, using the time trade-off method (i.e. a method to determine “(...) the quality of life one experiences in a given health state by assessing the equivalence point between living a longer life with the medical condition of interest vs a shorter life in perfect health” (Datta et al., 2015, p. 1326); to briefly summarize, authors conclude that teledermatology is cost-saving compared to conventional care by the societal perspective and there is no evidence of differences in utility.
The decision to adopt a particular treatment should be based on expected net benefit so that, when comparing mutually exclusive treatment strategies for a particular disease, the optimal strategy is simply the one with the highest expected NB (Claxton, 1999). Nevertheless, decisions based on expected NB are only appropriate if there is also some consideration of whether current evidence is sufficient for allocating health-care resources, based on an assessment of the consequences of decision uncertainty (Sculpher and Claxton, 2005). If the decision uncertainty and the consequences of adopting a suboptimal treatment strategy are large, the decision-maker may require further evidence on which to base the adoption decision (Claxton et al., 2005).
Using the “option-pricing” approach (Dixit and Pindyck, 1994) to the analysis of irreversible treatment choices under uncertainty is important since the health sector is one in which there is tremendous uncertainty about the demand for future medical
9 technologies. When we begin treating a population of individuals, we do not know what additional conditions they will develop in the future. Since new diseases are constantly emerging, we do not even necessarily know the nature of these future conditions. Higher life expectancy prospects for new conditions to arise, especially those associated with skin care such as cancer, make the option value of the interventions a key variable of the valuation equation. Finally, unlike many private investment decisions, decisions taken by national health systems may be effectively irreversible for political reasons.
Palmer and Smith (2011) focus on the timing of health investments and whether it makes sense to delay adoption of a new technology in anticipation of the exogenous arrival of new information about its value. While the prospects for delaying investments has potentially important implications for decision making, delay is often not feasible in this setting, especially on the time scale under which we expect new information to arrive. When analyzing situations where current treatment decisions have irreversible implications for the treatment of future diseases, and decision makers are choosing between competing interventions with differing temporal consequences, Zivin and Neideill (2009) find that irreversibility raises the value of treatment modalities that preserve future treatment options. However, introducing some reversibility can either increase or decrease the option value, depending on the distribution of patient types. These authors also examine the relationship between these values and the biological and economic parameters that characterize any given set of technologies. Meyer and Rees (2012) analyze the treatment decision at a general level. They determine optimal threshold values for initiating the intervention, and derive comparative statics results with respect to the model parameters. In particular, an increase in the degree of uncertainty over the patient’s health state, in most cases, makes waiting more attractive. However, this may not hold if the patient’s health state tends to improve. In an application of a dynamic stochastic model for the optimal timing of a treatment switch to patients with unresectable gastrointestinal stromal tumor (GIST), de Mello-Sampayo (2014) finds that cost uncertainty and cost volatility reduce expected net benefit and the probability of switching to other line of treatment, respectively; also, cost uncertainty becomes more dominant as technologies become less cost competitive, and the demand for technologies increase with respect to quality assuming limited substitutability and no cost uncertainty. When applying to patients with HIV in India, de Mello-Sampayo (2012) finds the switching effectiveness to second-line treatment depends on the efficacy of the treatments, on the treatment risk, and degree of irreversibility.
10 This thesis follows the theory very closely to develop a dynamic stochastic model for the optimal timing of a treatment switch. Its main value-added consists in the concrete application to a problem in medical decision taking, i.e. to patients with skin-care diseases. In the stochastic model, we assume two types of treatment in treating a skin-care disease and we consider the problem of a patient that is using the conventional skin-care and the decision maker is contemplating switching to teledermatology that consists of “telemedicine applied to the field of dermatology” (van der Heijden et al., 2013, p. 51). The patient will use the teledermatology only if such a move is deemed beneficial in the medium and long term. That, in turn, will depend on the perceived evolution of health level. The higher the uncertainty, the more likely it is that a favorable situation will turn into an unfavorable one, and the more the decision maker will gain from waiting for more information before committing to the new treatment.
11 3. Dermatology Department of Hospital Garcia d’Orta (HGO)
In this Chapter, it is presented and analyzed, the Dermatology Department of Hospital Garcia d’Orta (HGO) and 24 Primary Care Centers (PCCs) of that geographical area. The data source is the Dermatology Department of HGO at Almada (Portugal).
In the period from January 2017 to June 2017, a total of 152 patients (n = 152) were sent by 24 PCCs of the public health system to the Dermatology Department of HGO. Patients were subjected to conventional care (CC) or teledermatology (TD). As observed in Figure 1, 63 patients (41,4% of the total) were subjected to CC, and 89 patients (58,6%) were subjected to TD.
Figure 1. Patients of HGO subjected to different lines of treatment
Source: Author
3.1. Clinical characteristics of patients
Figure 2 shows that the majority of participants was male, i.e. 77 patients (50,7% of the total), and 75 participants were females (49,3%). The mean age is 68 years and the range are from 22 to 94 years.
Conventional care Teledermatology
63
12 Figure 2. Gender and Age of patients of HGO
Source: Author
As observed in Figure 3, Basal cell carcinoma, in the case of 44 patients (29% of the total), and actinic keratosis, in the case of 35 patients (23%), are the most frequent skin-diseases. Squamous cell carcinoma, in the case of 11 patients (7% of the total), and malignant melanoma, in the case of 3 patients (2%), are considered to be the most serious skin-diseases. Note that the orange line on Figure 3 indicates the cumulative percentage.
Figure 3. Skin-diseases diagnosed on patients of HGO
Source: Author
Female Male
75 77
Youngest patient
Mean age Oldest patient 22
68
13 3.2. Geographic locations
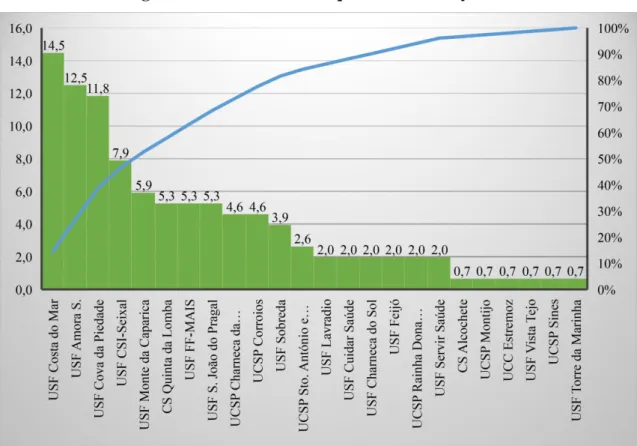
In Figure 4, the total of 152 requests to HGO are distributed by 24 PCCs. The requests are as follow: 22 made by USF Costa do Mar (14,5% of the total), 19 from USF Amora S. (12,5%), 18 from USF Cova da Piedade (11,8%), 12 from USF CSI-Seixal (7,9%) and 9 from USF Monte da Caparica (5,9%); together, these 5 PCCs represent 52,6% of total requests. Note that the blue line on Figure 4 indicates the cumulative percentage.
Figure 4. Distribution of requests to HGO by PCC
Source: Author
In order to calculate the distances by car - measured in kilometers (km) and in minutes (min) - from home addresses of patients (HA) to both PCCs and HGO, zip-codes of HA, PCCs and HGO were collected; the coordinates from all were obtained using Google Maps (GM). In the case of 81 patients (53,3% of the total), zip-codes from HA and from PCCs are the same; thus, it is assumed that the distance between HA and PCCs is 1 km and 5 min. by car. Figure 5 shows that zip-codes from HA and PCCs are different in the case of 71 patients (46,7%); thus, the distance is calculated using GM. The average distance from HA to PCCs is 11 min in the last case.
14 Figure 5. Distribution by Zip-Codes and Average distance (in minutes) from home
to PCC
Source: Author
Figure 6 shows that the average distance from HA to PCCs is 8 min. (all cases considered). The distances from HA to HGO were also calculated using GM; the average distance between HA and HGO is 16 min.
Figure 6. Average distance (in minutes) from home to PCC and HGO
Source: Author
3.3. Waiting times
The request dates from PCCs to HGO and the dates of the first doctor visit at HGO, the dates of the second doctor visit at HGO and the dates of surgeries were obtained from the Dermatology Department of HGO. A second doctor visit was needed in the case of 25 patients (16,4% of the total); and a surgery was needed by 123 patients (80,9%), however 14 users (11,4% of those that, in fact, needed a surgery) failed it.
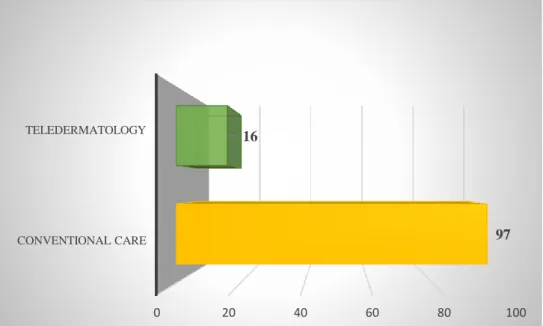
The waiting times were calculated for the first doctor visit at HGO that averaged 97 days in the case of patients subjected to CC, and it averaged 16 days in the case of patients
Same Zip-Codes 53% Different Zip-Codes 47% 0 5 10 15 Same Different
5
11
0 2 4 6 8 10 12 14 16 From home to PCC From home to HGO8
15 subjected to TD (see Figure 7). Also, the average for patients subjected to CC waiting to have a surgery was 124 days, otherwise the average was 93 days (see Figure 8).
Figure 7. Waiting time (in days) from request to first doctor visit at HGO under different lines of treatment
Source: Author
Figure 8. Waiting time (in days) from request to surgery at HGO under different lines of treatment
Source: Author
3.4. Steps from request to treatment
All patients, i.e. subjected to both CC or TD, needed a request from PCCs to HGO and a first doctor visit at HGO, however not all of them needed a second visit and/or a surgery.
0 20 40 60 80 100 CONVENTIONAL CARE TELEDERMATOLOGY 97 16 0 20 40 60 80 100 120 140 CONVENTIONAL CARE TELEDERMATOLOGY 124 93
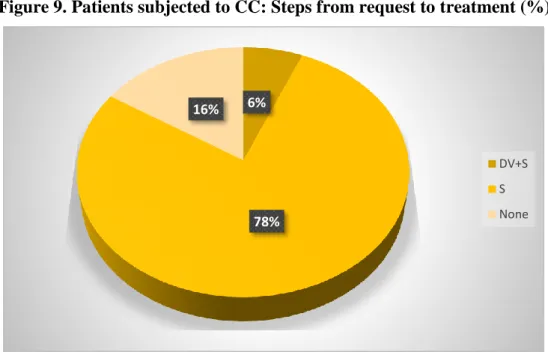
16 As shown in Figure 9, in a total of 63 patients subjected to CC, 4 patients (6,3% of the patients subjected to CC) needed both a second doctor visit at HGO (DV) and a surgery (S), 49 patients (77,8%) only needed a surgery, and 10 patients (15,9%) did not need none.
Figure 9. Patients subjected to CC: Steps from request to treatment (%)
Source: Author
In a total of 89 patients subjected to TD, 15 patients (16,9% of the patients subjected to TD) needed a second visit (DV) and a surgery (S), 55 patients (61,8%) only needed a surgery, 6 patients (6,7%), in turn, only needed a second visit, and 13 patients (14,6%) did not need a second visit nor a surgery (see Figure 10).
Figure 10. Patients subjected to TD: Steps from request to treatment (%)
Source: Author 6% 78% 16% DV+S S None 17% 62% 7% 14% DV+S S DV None
17 From the above data description, we may conclude that patients that were subjected to CC and did need a surgery (i.e. 53 patients representing 84,1% of the patients subjected to CC) had to wait more time to get their treatments than patients subjected to TD. Patients that were subjected to CC and did not need a second visit nor a surgery (i.e. 10 patients representing 15,9% of the patients subjected to CC) went to an unnecessary first visit at HGO; if these patients were subjected to TD, there was no need to visit the hospital and they could treat their diseases using a cheaper solution, i.e. visiting PCCs. Assuming that distance and waiting time have an opportunity cost, the cost of visiting PCCs is lower than visiting the hospital and the cost of TD is lower than CC.
18 4. Theoretical Framework
We design a theoretical framework to illustrate the switch from the conventional care (CC) to teledermatology (TD) under health level uncertainty. It is assumed two clinical cases (see Figure 11). In the first case, a patient using CC visits a general practitioner (GP) at a primary care center (PCC), and the GP recommends a visit to a dermatologist at a hospital where the patient gets his treatment. According to Portal do SNS (2017), waiting times for doctor visits at hospitals are substantially longer than for visits at PCC. Thus, an adequate treatment for this patient is not provided in short-run, which can lead to worsening of clinical situation in long-run depending on waiting time, and that might require more expensive treatments in the future (see van der Heijden et al., 2013). In this case, if authorized by the patient, the GP can photograph his skin-disease and send it to a dermatologist, using the required camera and software. Thus, in a second visit to PCC and after the GP received the diagnosis and the indicated treatment from the dermatologist, the GP gives the treatment. Another advantage of TD is that the cost of visiting a PCC (basic fee of 4,5€) is lower than visiting a hospital (basic fee of 7,5€), according to Portal do SNS (2017).
In the second case, a patient using CC visits a GP at a PCC, and the GP recommends a visit to a dermatologist at a hospital. The dermatologist diagnoses his disease but cannot treat him immediately, e.g. the patient needs a surgery. Then, in a second visit to the dermatologist, the patient gets his treatment. If TD is used, the GP at a PCC photographs his skin-disease and sends it to a dermatologist. Then, GP is informed that treatment must be provided by the dermatologist and the patient is appointed to visit the hospital for treatment. Using TD, a patient does not need to visit the hospital twice because the dermatologist, according to a description plus images sent by GP, is already prepared to treat him at first visit, and to give an accurate degree of priority that will determine waiting time: normal, priority and high priority (see Massone et al., 2013).
19 Figure 11. Activity Map – Steps of Treatment
Source: Author
4.1. The model
The modelling strategy is designed to highlight, in the simplest way, the impact of health level’s uncertainty on deciding to use conventional care (CC) or teledermatology (TD). Here dermatology treatment (T) consists in two stages and the intermediate stage, T1, can
be done in two different ways: CC or TD. The second stage, T2, is a face-to-face hospital
visit. We assume that intermediate treatment needs the same amount of labor whether it is done by a local dermatologist or through teledermatology. Furthermore, we assume that there is a regulated-price for dermatology treatment in the sense that it is done in a public national health system (i.e. prices of CC, TD and face-to-face hospital visit are established by the Portuguese State). Since prices are regulated and all patients are in NHS, we do not use prices in our modelling strategy.
The intermediate treatment, T1t, and final treatment, T2t, are made at time t using
a Cobb-Douglas technology:
𝑇1𝑡= 𝑏√𝐿𝑡and 𝑇2𝑡 = 𝑏√𝐿𝑡, (1)
where Lt is the labour employed, b is labour productivity of dermatologists. The final treatment stage combines both treatments using a Leontief technology, where:
𝑓(𝑇𝑡) = 𝑀𝑖𝑛[𝑇1𝑡; 𝑇2𝑡], (2)
CC
GP recommends dermatologist's visit at hospital
2ndThe patient gets his treatment at Hospital 2nd The dermatologist diagnoses: patient needs surgery 3rdThe patient
gets his treatment at Hospital. GP uses TD to access Hospital's dermatologist 2ndGP receives the diagnosis The patient gets his
treatment at PCC
2ndGP receives the diagnosis Patient gets treatment
at Hospital TD 1stPatient visits GP at PCC First case Second case
20 However, if it is used TD, the final treatment stage continues to be done at hospital but now using the outcome of teledermatology that offers the most cost-effective treatment (ωTD < ω). Teledermatology results in a total set-up cost of I. Teledermatology, 𝑇1𝑡𝑇𝐷, can be made at time t using a Cobb-Douglas technology:
𝑇1𝑡𝑇𝐷= 𝑏𝑇𝐷√𝐿
𝑡, (3)
Lt is the labour employed, 𝑏𝑇𝐷 is labour productivity in teledermatology. The decision maker’s benefit from dermatology treatment is given by:
T𝑡 = 𝐻 [𝑃1 𝑡] 𝜂 and 𝜂 = 1 1− 𝛿> 1, (4)
where Tt is the dermatology treatment at time t, Pt is the opportunity cost of treatment proxied by treatment time and travel time at time t, η is the parameter for the time and travel price-elasticity1, and H is the level of the state variable that represents the random shock of the patient's health level at time t. For analytical tractability, the state variable is assumed to evolve according to a geometric Brownian motion:
𝑑𝐻 = 𝛼𝐻𝑑𝑡 + 𝜎𝐻𝑑𝑧, (5)
where dz = εt√dt is the increment of a Wiener process and: εt →N(0,1), E(εt,εs) = 0 for s≠ t
Equation (5) implies that the current value of the random shock is known, but the future values are log-normally distributed with a variance growing linearly with the time horizon.
We calculate employment and net benefit2 of dermatology treatment when using CC. Applying Equations (1) and (2), it follows that employment in intermediate and final stages is:
𝐿1𝑡 = (𝑇𝑡)2
𝑏2 , 𝐿2𝑡 =
(𝑇𝑡)2
𝑏2 , (6)
By maximizing the net benefit at time t, NBCC can be derived as: 𝑃 = 𝐻1𝜂 [𝑇]−1𝜂 , 𝑁𝐵 = 𝑃 × 𝑇 − 𝜔 × (𝐿 1𝑡+𝐿2𝑡) = 𝐻 1 𝜂 [𝑇]𝜂−1𝜂 − 2 𝜔 𝑏2𝑇2 𝑎𝑛𝑑 𝜕 (𝐻𝜂1 [𝑇]𝜂−1𝜂 − 2 𝜔 𝑏2𝑇2) 𝜕𝑇 = − 1 𝑇1𝜂𝑏2 𝜂 (𝐻𝜂1𝑏2− 𝐻𝜂 1𝑏2𝜂 + 4𝑇𝑇1𝜂𝜔𝜂)
1 Since the demand is downward-sloping and the net benefit is non-negative, we require that 0 <δ < 1, so η > 1. The reason for this is that if both the waiting time for dermatology treatment (T) and the cost of
travel increases, the patient tends to quit the treatment either because he forgets the dermatology appointment or he cannot afford the cost of travel, i.e. the demand for treatment decreases more than proportionally to prices’ increase.
2 The net benefit of dermatology treatment is given by value derived from the treatment minus its cost: NB = PtTt −W(L1 + L2)
21 𝐻1𝜂𝑏2− 𝐻𝜂1𝑏2𝜂 + 4𝑇𝜂−1𝜂 𝜔𝜂 = 0 ⟺ 𝑇 = (( 𝜂 − 1)𝐻 1 𝜂 𝑏2 4𝜔𝜂 ) 𝜂 (𝜂+1) 𝑎𝑛𝑑 𝑁𝐵𝑡 = 𝐻 1 𝜂 [ ((𝜂 − 1)𝐻 1 𝜂𝑏2 4𝜔𝜂 ) 𝜂 2𝜂+1 ] 𝜂−1 𝜂 − 2 𝜔 𝑏2 [ ((𝜂 − 1)𝐻 1 𝜂 𝑏2 4𝜔𝜂 ) 𝜂 2𝜂+1 ] 2 = 𝐻𝜂+12 𝜔−(𝜂−1)𝜂+1 𝑏2(𝜂−1)𝜂+1 ((𝜂 − 1) 4𝜂 ) 𝜂−1 𝜂+1 (1 − 2 ((𝜂 − 1) 4𝜂 )) = 𝐻𝜃𝜔−𝜙𝑏2𝜙𝛿𝜙4−𝜙(1 −𝛿 2) 𝑁𝐵𝐶𝐶= 𝐻𝜃 (1 −𝛿2) 𝛿𝜙 (4𝜔𝑏2) −𝜙 , (7)
where 𝜃 = 2(𝛿−1)𝛿−2 = 𝜂+12 and 𝜙 = 2− 𝛿𝛿 . Using Ito’s lemma, it can be confirmed that Hθ also follows a geometric Brownian motion: 𝑑𝐴𝜃 = (𝛼𝜃 − 𝜃𝜙
2 𝜎2) 𝐴𝜃𝑑𝑡 + 𝜃𝜎𝐴𝜃𝑑𝑧.
Now we calculate employment and net benefit for the treatment using teledermatology. Applying Equations (2) and (3), it follows that:
𝐿1𝑡𝑇𝐷= (𝑇𝑡𝑇𝐷) 2 (𝑏𝑇𝐷)2 , 𝐿2𝑡 = (𝑇𝑡)2 𝑏2 , (8)
By maximizing the net benefit at time t, 𝑁𝐵𝑇𝐷can be derived as: 𝑃 = 𝐻1𝜂[𝑇]−1𝜂, 𝑁𝐵 = 𝐻𝜂1[𝑇]−1𝜂 − (𝜔 𝑏2+ 𝜔𝑇𝐷 (𝑏𝑇𝐷)2) 𝑇2 𝑎𝑛𝑑 𝜋 = 𝜔 𝑏2+ 𝜔𝑇𝐷 (𝑏𝑇𝐷)2 𝜕 (𝐻𝜂1[𝑇]𝜂−1𝜂 − 𝜋𝑇2) 𝜕𝑇 = − 1 𝑇𝜂1𝜂 (𝐻1𝜂 − 𝐻𝜂 1𝜂 + 2𝑇𝑇𝜂1𝜋𝜂) 𝐻𝜂1− 𝐻 1 𝜂𝜂 + 2𝑇𝑇 1 𝜂𝜋𝜂 = 0 ⟺ 𝑇 = (( 𝜂−1)𝐻 1 𝜂 2𝜋𝜂 ) 𝜂 (𝜂+1) and 𝑁𝐵𝑡= 𝐻 1 𝜂 [ ((𝜂 − 1)𝐻 1 𝜂 2𝜋𝜂 ) 𝜂 𝜂+1 ] 𝜂−1 𝜂 − 𝜋 [ ((𝜂 − 1)𝐻 1 𝜂 2𝜋𝜂 ) 𝜂 𝜂+1 ] 2 = Hη+12 π(η−1)η+1 ((η − 1) 2η ) η−1 η+1 (1 − ((η − 1) 2η )) = = Hθ(ω b2+ 𝜔𝑇𝐷 (𝑏𝑇𝐷)2) −ϕ δϕ2−ϕ(1 −δ 2)
22 𝑁𝐵𝑇𝐷 = 𝐻𝜃 (1 −𝛿 2) ( 𝛿 2) 𝜙 (𝑏𝜔2+ (𝑏𝜔𝑇𝐷𝑇𝐷)2)−𝜙, (9) Proposition 1: Higher volatility of health shocks reduces the expected net benefit associated with both CC and TD.
Proof:
Comparing the state variables in Equations (13) and (14) in Appendix - Proof of Propositions, it follows that expected benefits are proportional to Hθ under both treatment stages. Recalling that a decision maker operates where time and travel price-elasticity: η > 1, it follows that θ = 2/(1 + η) < 1. Hence, expected net benefits are concave with respect to the global health shock.
Consequently, health uncertainty reduces expected net benefit under both intermediate treatments’ modes3.
When the decision maker is using exclusively CC its decision as to whether or not to engage in teledermatology constitutes an optimal stopping problem for which the relevant Bellman equation is:
𝑉𝐶𝐶(𝐻, 𝑡) = 𝑀𝑎𝑥{𝑉𝑇𝐷− 𝐼; 𝑁𝐵
𝐶𝐶+ 1𝑡𝐸[𝑑𝑉𝐶𝐶]}, (10)
where 𝑉𝐶𝐶(𝐻, 𝑡) is the value of the option to use TD, 𝑉𝑇𝐷− 𝐼 accounts for the expected
decision maker’s value gain that results from opting for teledermatology, and the second term in curly brackets yields the time-discounted expected increment in the value of the option that arises from keeping the option unexercised for an additional lapse of time, dt. The range of values for which the second term in curly brackets is greater than the first defines the continuation region, where it is optimal not to exercise the option.
Proposition 2: The decision maker will only choose teledermatology if the decision maker´s value associated with TD exceeds that of a situation of CC, i.e.
𝐻 ≤ Ĥ = [ 𝛽1 𝛽1−1 × 𝜇− 𝛼𝜃+ 𝜃𝜙2 𝜎2 1− 𝛿2 × 𝜃(𝛿2)−𝜙 (1−𝑟)[(𝑏2𝜔+ 𝜔𝑇𝐷 (𝑏𝑇𝐷)2) −𝜙 − (2𝜔𝑏2)−𝜙] × 𝐼] 1 𝜃 , (11)
Proof: See Appendix - Proof of Propositions.
It follows from Equation (11) and the previous assumptions on the parameters that the value of Ĥ is greater than zero, implying that the decision maker will only invest in
3 Under our set up model, the magnitude of this adverse effect is identical for both treatments’ modes (CC
and teledermatology). For general values of the labour supply elasticities, as long as labour is subject to diminishing marginal productivity, health uncertainty adversely affects both intermediate treatment modes, but the magnitudes of these adverse effects depend on the precise values of the labour supply elasticities.
23 teledermatology if the decision maker’s value associated with teledermatology exceeds that of a situation of local dermatology, and that is due to uncertainty of the future path of health level.
Moreover, since:
𝜕Ĥ
𝜕𝜎2> 0 and limσ→∞ Ĥ= ∞,
the greater the volatility of the health level (i.e. the higher σ2) the higher the critical value has to be to make it optimal for the decision maker to use TD. The economic intuition for this is that, if the volatility in dermatological-diseases is high, the decision maker tends to prefer to diagnose these skin-lesions in-vivo (i.e. CC) than to use TD in order to avoid diagnosis’ errors.
The higher the expected trend of health level, the less the teledermatology option is worth, and thus the lower the value that triggers using teledermatology, i.e.:
𝜕Ĥ 𝜕𝛼 < 0,
The reason for this is that the higher the expected trend of health level, the lower the uncertainty that results from the switch from a situation where decision makers uses CC to one where uses TD. The theoretical explanation for this is that, if the expected trend of patient’s health level is high, the doctor tends to prefer to use an innovative line of treatment (i.e. TD) than to diagnose these skin-lesions in-vivo (i.e. CC).
In regard to the discount rate, the greater the decision maker’s time discount rate, the less it values the teledermatology option and thus the lower the value H that triggers optimal entry; i.e.:
𝜕Ĥ 𝜕𝜇 < 0,
This result stems from the fact that a higher time preference increases the decision maker’s opportunity cost of not immediately using teledermatology. The economic intuition for this is that, if the doctor cares more about the future (low μ), he wants to use an innovative line of treatment (i.e. TD) instead of diagnosis in-vivo (i.e. CC); and if he cares more about the present, he wants to diagnose in-vivo instead of using teledermatology. In the extreme case where the decision maker cares only about the present moment, so that µ →∞, then 𝑙𝑖𝑚
𝜇→∞( 𝛽1
𝛽1−1)
1
= 0 and Ĥ = 0, so that uncertainty is disregarded and the value of the teledermatology option collapses to zero.
24
𝜕Ĥ
𝜕𝜔< 0 and 𝜕Ĥ 𝜕𝜔𝑇𝐷 > 0,
the lower the wage in TD and the higher the wage of CC, the lower the threshold for teledermatology. Thus, if the cost of CC increases, the doctor tends to use TD in the sense that he is concerned with his patients; and if the cost of TD decreases, the doctor tends to use TD.
The model presented gives clear indications regarding the decision to use TD under health level uncertainty. It predicts that the higher the volatility of the patient's particular characteristic, the less probable is to use 𝑇𝐷, the higher the cost of 𝑇𝐷, the more valuable the option of using TD will be, and so the fewer TD will be observed. Conversely, the higher the trend of the patient's particular characteristics, the higher the discount factor and the higher the cost of CC, the more use of TD one would expect to observe. Thus, for empirical testing purposes, the reduced form of equation (11) can be written as follows:
𝑇𝐷 = 𝑓 (𝜎2 𝛼 𝜇 𝑤 𝑤𝑇𝐷
25 5. Survival Analysis
Survival analysis is similar to time-to-event analysis. Time-to-event data describe the length of time from a time origin to an endpoint of interest. Here, the time origin is the date of request from the general practitioner (GP) at the primary care center (PCC) to the dermatologist at the Hospital Garcia d’Orta (HGO); the endpoint of interest is the date of treatment. Thus, the length of time from the request to the treatment is calculated. “The objectives of survival analysis include the analysis of patterns of event times, the comparison of distributions of survival times in different groups of individuals and examining whether and by how much some factors affect the risk of an event of interest.” (Kartsonaki, 2016, p. 263). Here, the main point is to observe time to treatment under different lines of treatment, i.e. conventional care (CC) versus teledermatology (TD).
There are some aspects of survival analysis data that have to be considered, e.g. censoring and non-normality, that generate difficulty when trying to analyze the data using traditional statistical models such as multiple linear regression (MLR), and it requires other techniques. Censoring consists in the possibility of not observing the event of interest for some individuals during the censoring time. Here, censoring consists on having some patients that did not complete the treatment during the period from January 2017 to June 2017. We will focus exclusively on right censoring, i.e. the patient is followed up from the date of request up to the date of treatment but he fails the treatment. This may occur, for example, if a patient fails his treatment at HGO because instead he visits a doctor in the private health system. The normality assumption of most commonly used statistical model, such as regression, is violated by the non-normality aspect of the survival data; it is often skewed (asymmetric).
The survival function (SF) is the probability that an individual survives beyond the endpoint of interest. The hazard function is the instantaneous rate at which events occur for individuals which are surviving at any given time. The higher the hazard, the lower the survival (see Kartsonaki, 2016). The hazard rate (HR) is considered the fundamental dependent variable in survival analysis. We can get an intuitive idea of the HR from looking at data with discrete time, i.e. time measured in intervals such as days, months and years. For discrete time, the HR is the probability that an individual will experience an event at any given time while that individual is at risk for having an event. Thus, the HR is the unobserved rate at which events occur, controlling both the occurrence (the censor variable) and the timing of the events (the time variable). The other important aspect of the hazard function is to determine how its shape will influence the
26 other variables of interest such as the survival function. The indicators of interest, such as the survival function, are derived from the HR.
The aim of this study is to model time until a patient gets treatment for his skin-disease, for patients enrolled in two different treatments’ care: TD or CC. If the patient was subjected to TD (TD = 1) or if he was subjected to CC (TD = 0). During the treatment, patients needed a second doctor visit (DV = 1) or otherwise (DV = 0). To analyze how uncertainty affected the HR, we proxy SIGMA (σ) by the standard deviation of waiting time for doctors’ visits4, ALPHA (𝛼) by the mean of waiting time and MU (μ) as the
discount rate by 5%. We also tested how other variables affected the HR, such as: age at enrollment (AGE), the distance in minutes between PCC and HGO (DIST. PCC TO HGO) and GENDER (GENDER =1 indicates if the patient is male and GENDER =0 indicates if the patient is female). In the survival model, the Censor variable indicates whether the patient finished the treatment (CENSOR = 1 indicates end of skin-disease treatment and CENSOR = 0 otherwise) and the time variable contains the TIME until skin treatment ended (i.e. number of days until skin-disease is treated). In summary, SF=f(TD, DV, σ, μ, DIST. PCC TO HGO, AGE, GENDER) censored by CENSOR and TIME.
5.1. Univariate analysis
Before proceeding to survival analysis of the model, a univariate analysis to the data is done. We will use the log-rank or Mantel-Haenzel test of equality across strata, which is a non-parametric test, for the categorical variables. “It can be used to test whether the survival of individuals in two or more groups is significantly different and it is similar to the χ2 (chi-squared) test for association.” (Kartsonaki, 2016, p. 265).
In addition, we will use a univariate Cox proportional hazard regression, which is a semi-parametric method, for the continuous variables. “One of the objectives of the analysis of survival data might be to examine whether survival times are related to other features. Regression models can be used to assess the effect of covariates on the outcome.” (Kartsonaki, 2016, p. 266). Although we assume that survival times are related to the explanatory variable in a specific way, we make no assumptions on the overall shape of
4 If an adequate treatment is not provided in short-run, can lead to worsening of clinical situation in the
long-run depending on waiting time, and that might require more expensive treatments in the future (see van der Heijden et al., 2013). Since health levels are closely related with waiting times, we proxy health level uncertainty with the standard deviation of waiting time.
27 the survival times – that’s why the Cox proportional hazard model is considered a semi-parametric model -, then the shape of the hazard function need not be specified.
In order to estimate and plot the survival function given our set of data, we calculate and plot a Kaplan-Meier curve. “This is a non-parametric method of estimating the survival function. Non-parametric methods are rather simple methods which do not make any distributional assumptions, in this context about the distribution of survival times observed in a study.” (Kartsonaki, 2016, p. 264). Kaplan-Meier curves are generated for the categorical predictors in order to provide an insight into the shape of the survival function for each group and to determine whether or not the groups are proportional.
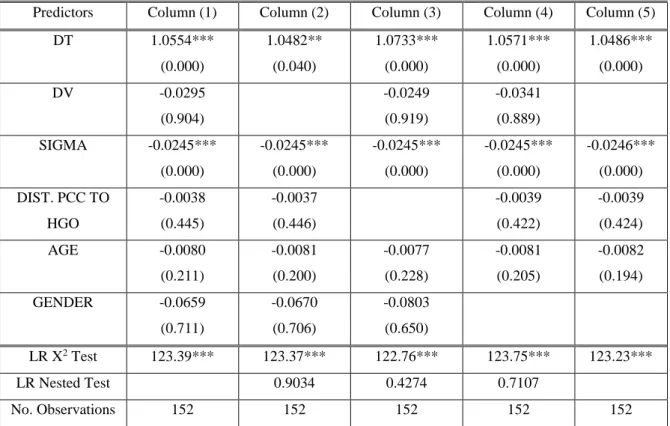
Table 1. Log-rank test and Cox regression for Predictors
Predictors Log-rank test
TD 14.05*** (0.0002) DV 0.44 (0.5067) GENDER 0.16 (0.6897)
Predictors Cox regression
AGE -0.0118** (0.042) DIST. PCC TO HGO -0.0031 (0.523) SIGMA -0.0203*** (0.000) No. Observations 152
Note: ***, **, * Statistically significant at 1%, 5% and 10%, respectively. P-values in brackets. Source: Author
Table 1 shows the log-rank test for the categorical variables and the univariate Cox proportional hazard regression for the continuous variables. According to Table 1, the log-rank test of equality across strata for the predictor TD is statistically significant, thus it is a potential candidate for the final model. The log-rank tests for the predictors DV and GENDER are not significant, however we know that they are important variables to have
28 in the model (see Moreno-Ramirez et al., 2009); thus, we will not eliminate them from our model.
In Table 1, the Chi-squared test of SIGMA is statistically significant and so it is a potential candidate for the final model. The Chi-squared tests of AGE and DIST. PCC TO HGO are not significant at 1%, however we know that they are important variables to have in the model from prior research (see Moreno-Ramirez et al., 2009); thus, we will not eliminate them from our model. The discount rate discount, MU (μ) and the trend of health level, ALPHA (𝛼) are constants during the period, thus they will not be included in the survival model.
Figure 12. Kaplan-Meier curve for TD, DV and GENDER
Source: Author
In Figure 12 the survival functions for TD and DV are shown. We observe that the survival functions for TD are, approximately, parallel. That is, a smaller proportion of patients using TD did not get treatment for their skin-diseases. However, the curves for DV and GENDER are not parallel, what corroborates the result of log-rank test that rejected equality across strata for the predictors DV and GENDER.
Though the univariate analyses suggest dropping DV, GENDER, and DIST. PCC TO HGO, we choose to include them to test the overall significance in the survival function estimation.
5.2. Results
The results for the survival analysis of our model are presented in Table 2. Table 2 is organized in 5 columns. In the first column the results for SF=f(TD, DV, σ, DIST. PCC TO HGO, AGE, GENDER) censored by CENSOR and TIME. In Column (2) it is tested the overall significance of the model without DV with the likelihood ratio (LR) Nested test. In Column (3) it is tested the overall significance of the model without DIST. PCC TO HGO with the LR Nested test. In Column (4) it is tested the overall significance of the model without GENDER with the likelihood ratio test (LR). First, it is observed that
29 the overall significance of the models is not rejected by the LR test. The LR Nested tests in Columns (2), (3) and (4) indicate that we do not reject the null hypotheses that the models fit the data equally well and conclude that the model without those variables fits data better. However, we know that DIST. PCC TO HGO is an important variable to have in the final model from prior research (see Moreno-Ramirez et al., 2009); thus, we will include it in our model. In Column (5) it is presented the model used in this study as: SF=f(TD, SIGMA, DIST. PCC TO HGO, AGE)
Table 2. Results for the Survival Analysis
Predictors Column (1) Column (2) Column (3) Column (4) Column (5) DT 1.0554*** (0.000) 1.0482** (0.040) 1.0733*** (0.000) 1.0571*** (0.000) 1.0486*** (0.000) DV -0.0295 (0.904) -0.0249 (0.919) -0.0341 (0.889) SIGMA -0.0245*** (0.000) -0.0245*** (0.000) -0.0245*** (0.000) -0.0245*** (0.000) -0.0246*** (0.000) DIST. PCC TO HGO -0.0038 (0.445) -0.0037 (0.446) -0.0039 (0.422) -0.0039 (0.424) AGE -0.0080 (0.211) -0.0081 (0.200) -0.0077 (0.228) -0.0081 (0.205) -0.0082 (0.194) GENDER -0.0659 (0.711) -0.0670 (0.706) -0.0803 (0.650) LR X2 Test 123.39*** 123.37*** 122.76*** 123.75*** 123.23*** LR Nested Test 0.9034 0.4274 0.7107 No. Observations 152 152 152 152 152
Note: ***, **, * Statistically significant at 1%, 5% and 10%, respectively. P-values in brackets. Source: Author
In table 3 it is presented the HR for the model as given in Column (5) of Table 2. Analyzing the HR (also called relative risks), the model indicates that if the line of treatment is TD, and all other variables are held constant (ceteris paribus), the rate of treatment increases by, approximately, 185,38% (around three-fold increase). As the health level uncertainty (SIGMA) increases by one unit, ceteris paribus, the rate of treatment decreases by, approximately, 2,43%. If DIST. PCC TO HGO increases by one minute, ceteris paribus, the rate of treatment for his skin-disease decreases by, approximately, 0,39%. Finally, as the AGE increases by one year, ceteris paribus, the rate of treatment for his skin-disease decreases by, approximately, 0,82%.
30 Table 3. Hazard Ratios for SF=f(TD, σ, DIST. PCC TO HGO, AGE)
Final Model HR TD 2.8538*** (0.000) SIGMA 0.9757*** (0.000) DIST. PCC TO HGO 0.9961 (0.424) AGE 0.9918 (0.194) LR X2 TEST 123.23*** No. Observations 152
Note: ***, **, * Statistically significant at 1%, 5% and 10%, respectively. P-values in brackets. Source: Author
To analyze two individuals using the predictors AGE and TD in our model, we use the raw coefficients shown in Column (5) of Table 2. Comparing two patients with an average age of 68 years old (AGE=68). One patient is using the CC (TD=0), while all other variables are held constant yields a hazard ratio equal to exp(-0,0082*(68))= 0.573. Thus, the rate of treatment decreases 42.7% (100% – 57.3%). The other patient is using the TD (TD=1), while all other variables are held constant yields a hazard ratio equal to exp(-0,0082*(68)+1.0486)= 1.634. Thus, the rate of treatment increases by 63,4% (163,4% – 100%) Thus, for a 68 years old individual, the results clearly suggest the use of TD.
One of the main assumptions of the Cox proportional hazard model is proportionality; thus, we must check proportionality by including time-dependent covariates, i.e. interactions of the predictors and time, in the model. If a time-dependent covariate (TVC) is significant, the proportionality assumption for that predictor is violated. According to the results presented in Table 4, the conclusion is that the predictors TD, DIST. PCC TO HGO and AGE are not statistically significant, thus supporting the assumption of proportional hazard. In turn, the predictor SIGMA is significant, thus suggesting that SIGMA is time-dependent.
31 Table 4. Test of the Proportionality Assumption
Final Model MAIN Model TVC Model
TD 0.5788 (0.542) 0.0893 (0.684) SIGMA -0.1174*** (0.000) 0.0192*** (0.000) DIST. PCC TO HGO 0.0057 (0.809) -0.0024 (0.648) AGE -0.0206 (0.341) 0.0033 (0.545) LR X2 TEST 144.08*** 144.08*** No. Observations 152 152
Note: ***, **, * Statistically significant at 1%, 5% and 10%, respectively. P-values in brackets. Source: Author
Another method to test the proportionality assumption is by testing the Schoenfeld and scaled Schoenfeld residuals. If the Schoenfeld test is not significant, i.e. p-values bigger than 0,05, then we cannot reject proportionality and we assume that there is no violation of the proportional assumption.
In Table 5 the results for the Schoenfeld Tests are presented, since the tests for TD, DIST. PCC TO HGO and AGE are not statistically significant, there is no violation of the proportionality assumption. In turn, for SIGMA it is significant, suggesting it is time dependent.
32 Table 5. Schoenfeld Test
Final Model Schoenfeld Test
TD 0.06 (0.8072) SIGMA 6.25** (0.0124) DIST. PCC TO HGO 0.12 (0.7310) AGE 0.05 (0.8193) Global Test 7.85* (0.10) No. Observations 152
Note: ***, **, * Statistically significant at 1%, 5% and 10%, respectively. P-values in brackets. Source: Author
As a robustness test for the proportionality assumption is presented in Table 4 and 5, we analyze the graphs of the scaled Schoenfeld residuals. It shows whether the effect of the parameter, as a function of time, varies with time. If there is no violation of the proportionality assumption, a horizontal line is shown in the graph. In turn, it suggests that the proportional hazards assumption might not be plausible if the effect varies a lot with time. The graphs of the scaled Schoenfeld residuals for the predictors TD, SIGMA, DIST. PCC TO HGO and AGE are shown in Figure 13. The graphs show that the lines are approximately horizontal for all covariates. This result suggests leaving SIGMA in the model unaltered.