Influence of Distributed Generation in Energy
Distribution Networks
∗J. N. Fidalgo1, Dalila B. M. M. Fontes2†, and Susana Silva3
1 INESC Porto and Faculdade de Engenharia, Universidade do Porto
Rua Dr. Roberto Frias, 4200-465 Porto, Portugal. [email protected]
2 LIAAD - INESC Porto L.A. and Faculdade de Economia, Universidade do Porto
Rua Dr. Roberto Frias, 4200-464 Porto, Portugal. [email protected]
3 ALERT - Life Sciences Computing, S.A.
Rua Ant´onio Bessa Leite, 1430, 2o 4150-074 Porto, Portugal.
Abstract
Recent changes in electric network infrastructure and government policies have cre-ated opportunities for the employment of distributed generation to achieve a variety of benefits. In this paper we propose a decisions support system to assess some of the technical benefits, namely: 1) voltage profile improvement; 2) power losses reduction; and 3) network capacity investment deferral, brought through branches congestion reduction. The simulation platform incorporates the classical Newton-Raphson algorithm to solve the power flow equations. Simulation results are given for a real Semi-Urban medium voltage network, considering different load scenarios (Summer, Winter, Valley, Peak and In Between Hours), different levels of micro-generation penetration, and different location distributions for the micromicro-generation units.
Key words: Distributed generation; distribution systems; voltage profile; losses; simulation
1 Introduction
Several benefits can be achieve by integrating Distributed Generation (DG) with utility networks. These benefits should be clearly understood, analyzed, and quan-tified in order to increase the potential and value of DG penetration. The benefits
∗Research partially supported by FCT/POCI 2010/FEDER through project
POCTI/EGE/61823/2004.
150 J.N. Fidalgo, D.B.M.M. Fontes, S. Silva
of DG have been evaluated and quantified in terms of capacity credit, energy value, and energy cost saving [17, 20]. DG is expected to play a major role in future power systems, since it is able to reduce transmission losses, improve power quality to end users, and smooth peaks in demand patterns.
Besides that, another main driver for DG penetration growth is the development of new renewable DG (wind turbines, photovoltaic, biomass, etc.) and some fossil DG that have combined heat and power capabilities. The European Union (EU) Commission has set a target of 12% by 2010 for microgeneration integration in Low Voltage (LV) and Medium Voltage (MV) networks. Proliferation of renewable en-ergy sources is being encouraged in order to progress towards the Kyoto agreement. Bearing in mind this agreement and considering each country specificities, EU pro-posed in September 2001 the Directive 077/CE/2001 [19], concerning the electricity production based on renewables. This directive sets the goal of renewable energy production by 2010 to 22%. The same directive has set a goal of 39% for Portugal. These renewable energy targets are supposed to be partially fulfilled by DG.
Employment of DG in existing systems can cause several potential operating conflicts such as voltage flicker, misoperation of protection, and reverse power flow [2, 8, 13]. These affect network operation and planning practices with economic implications [15, 14]. However, many benefits, both economic and technical, can be achieved [3, 4]. Research has shown that DG has generally a beneficial impact in the power networks, contributing positively to losses decrease, enhanced voltage profiles, and retarding branches congestion [6, 7, 9, 16, 23]. Active power losses de-crease significantly with the growth of DG penetration. The same applies to network congestion issues - load can be notably reduced in the branches with microgenera-tion4. Another advantage of DG is the capture of intermittent and peaking loads in
residential and commercial co-generation [18].
Recently, it has been shown that DG units location can have a significant impact on power systems performance [1, 10]. In fact, the location of DG plays a vital role in improvement the voltage profile and in reducing power losses [7]. Results have also shown a higher improvement in voltage profiles when DG is installed closer to the higher loads [6]. However, when DG is distributed, in LV networks the voltage and power flow constraints are more relieved than when DG is concentrated in a few number of buses [23].
The impact of DG on investment deferral has not yet been the subject of much research. For a discussion on the potential of DG to defer investments, see e.g. [24]. In a recent work, Gil and J¨oos [11] proposed an approach to quantify the value of the capability to defer planned or required investments in wires and transformers for the distribution network.
The present work was developed within the framework of a research project that intends to analyze the interaction dynamics of the DG actors, whose actions are mo-tivated by their own profit but also subjected to the regulatory directives. Diverse exploring situations have been simulated and the effects of the different parameters were evaluated (the DG location was one of them). Under this perspective, this work is better seen as a decision aid tool, i.e. a Decision Support System (DSS), to analyze some technical benefits of DG. The DSS is supported by a simulation platform that allows for the simulation of different exploration scenarios, different DG locations, and different levels of DG penetration. The impact on network
formance is evaluated by assessing three major technical benefits, namely voltage profile improvement, power losses reduction, and branch congestion reduction. The investment deferral is evaluated through the branch congestion reduction.
The paper is organized as follows: Section 2 presents the proposed methodology. In Section 3 the simulation parameters and the distribution system are given. Results and conclusions are presented in Sections 4 and 5, respectively.
2 Methodology
Technical benefits of introducing DG can be divided in two broad categories: • Improvement of a certain attribute such as voltage profile, reliability, power
quality, etc.
• Reduction of an attribute such as power losses, emissions, congestion, etc. In this work we are concerned with the benefits obtained from voltage profile improvements, reduction in power losses, and reduction in branches congestion. We also study the impact of DG locations on these benefits.
One of the justifications for introducing DG is to improve the voltage profile. This happens since DG can provide a portion of the real and reactive power to the load, thus helping to decrease current along a section of the distribution line, which in turn, will result in a boost in the voltage magnitude at the customer site [5]. In this study, the voltage profile analysis is performed through the calculus of the mean voltage in the network buses.
Other major potential benefit offered by DG is the reduction in power losses. The losses can be significant under heavy load conditions. The utility is forced to pass the cost of power losses to all customers in terms of higher energy costs. With the inclusion of DG, power flows are reduced leading to a power loss reduction in the distribution system. However, depending on the ratings and locations of DG units, it is possible to have an increase in power losses at very high (and unrealistic) penetration levels, also shown in our results. For the purpose of this study we consider the active power losses and also the total energy losses.
Another benefit is brought through the reduction in branches congestion since this, typically, allows to defer investment in network capacity. For the purpose of this study we analyze the DG impact on the most loaded branch (relatively to its capacity), in order to pinpoint the most sensitive section. The analysis is completed by estimating by how many years lines upgrade may be postponed due to the load reduction accomplished.
A Decision Support System was developed within the scope of a project called GENEDIS (acronym of distributed generation). This DSS was developed and im-plemented on an AMD AthlonT M 208 GHz (1.6 GB Ram DDR 400 MHz) PC. The JAVA programming language (JDK 1.2) was used for creating a customized, user-friendly graphical interface.
The user interface has three main parts, corresponding to the three major func-tionalities of GENEDIS:
• Network Data - through which we can load the network from a file. We can also edit the network and change some of its parameters. In particular, we can add, drop, or replace injectors, see Fig. 1.
152 J.N. Fidalgo, D.B.M.M. Fontes, S. Silva
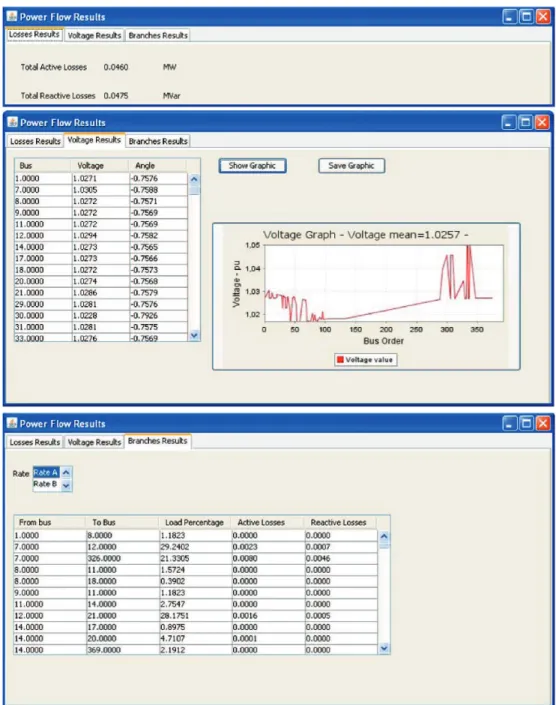
• Power Flow - where we can open a file with results previously obtained, get the solution of the power equations, and visualize the power flow results, as depicted in Fig. 2.
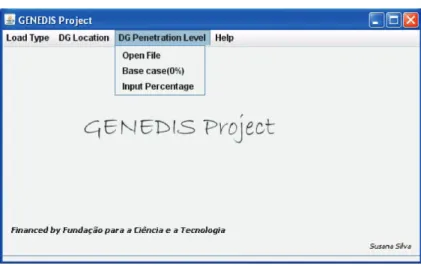
• Simulation - where we choose the simulation parameters, that is load type, DG locations, and DG penetration levels, see Fig. 3.
The power flow module, that has been implemented in JAVA, uses a library that has been built by using MatLab. The Newton-Raphson algorithm [12, 21] is a classical and well known method, at least within the power system community, for solving the power flow problem, a set of simultaneous non-linear equations). This algorithm was implemented in MatLab and then by using Matlab Builder for Java deploytool, the library jar was built.
3 Simulation study
The present study is based on the data of a real near-urban MV network. The simulation study considers several DG penetration levels. In order to achieved this we first select a set of buses to be the connection points for the DG machines. Then, in these buses the active power is decreased to several different values in order to simulate different penetration levels.
The simulation was performed for the following load scenarios: 1. Peak Hours of Winter (PHW);
2. Peak Hours of Summer (PHS); 3. In Between Values of Summer (BVS); 4. In Between Values of Winter (BVW); 5. Valley Hours of Summer (VHS).
As previously said we also study the impact of DG location, this is accomplished by considering four types of DG location distribution, as follows:
1. Near - DG machines are located close to the substation; 2. Far - DG machines are located far away from the substation; 3. Random - DG machine locations are randomly selected;
Regarding the random location distribution we have generated two such scenarios since, as it can be seen in the results section, the power quality indexes may be rather different.
The network data is organized under a node-to-node scheme in order to allow a proper identification of every branch in the pathn connecting each pair of nodes. This data is, by default, read from a text file that contains all the information required for a full characterization of the entire network under simulation, such as network topology, lines and loads data, etc. Alternatively, the user may change manually any parameter using the DSS graphical interface.
For each exploration state, several settings for the power factor were considered (tg = 0.0, 0.1ˇE 0.6), although the results reported in this paper refer only to the nominal case tg = 0.4. For full results the reader is referred to [22].
The DG production effect is simulated through the reduction of the value of the load (active power) in the corresponding bus bar. The value of the reduction of the active power, for the four DG location distributions, was chosen such that the
154 J.N. Fidalgo, D.B.M.M. Fontes, S. Silva
Fig. 3. Main simulation menu.
percentage penetration of DG ranges from 0% up to 100%. For the lower limit no DG exists, while for the upper limit all loads are fed by DG machines and no power is supplied to by the substations. Although very high penetration levels are highly improbable, for the sake of completeness we also include them.
The percentage penetration value is computed as the ratio between the variation on the total load value, implied by the reduction in active power, and the value of the total load before the active power reduction.
3.1 Network General Characterization
The Semi-Urban MV network used in this study has 372 load nodes and three injectors of 15 kV that feed three (usually) independent sectors. The areas fed by the different injectors were denominated by Area 1 (fed by the node 332), Area 2 (fed by the node 158) and Area 3 (fed by the node 267), see Fig. 4.
3.2 Algorithm
As referred to previously, the impact of DG is simulated by performing a reduction on the active power consumption in the load nodes where micro generators are con-nected. Network simulation and analysis is then performed throughout the following steps, which have been implemented by using PSS/E. Set initial conditions:
(Base case: DG penetration is zero.)
For each typical scenario (PHS, PHW, BVS, BVW and VHS): For each type of DG location (Near, Far, Random1, Random2)
Repeat until DG penetration ratio reaches 100% 1. Run load flow (Newton-Raphson algorithm)
obtaining network voltage profile;
156 J.N. Fidalgo, D.B.M.M. Fontes, S. Silva
Fig. 4. Semi-Urban Medium Voltage Network.
3. Increase DG penetration ratio.
This set of conditions provides an implicit characterization impact of DG in the network for the four different location distribution possibilities, parameterized in terms of DG penetration, for the exploration scenarios considered.
4 Computational results
In this section we report on the results obtained in the simulations performed. As referred to previously, the objective is to characterize the technical influence of DG in the distribution network in terms of power losses, voltage profiles, and branches congestion.
4.1 Active power losses
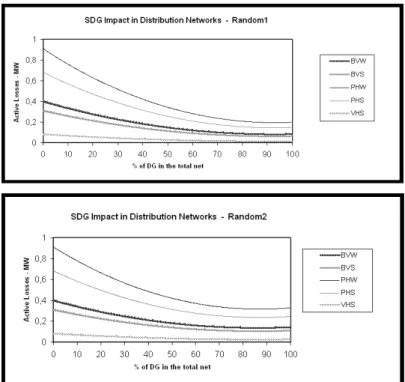
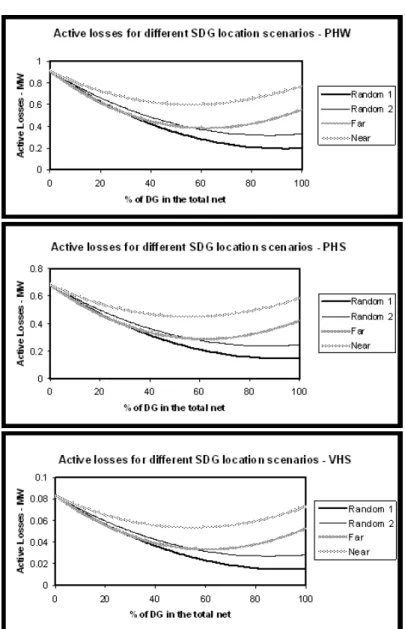
Figures 5 and 6 summarize the DG impact on the active power losses of the stud-ied network. From these figures it can be seen that DG generally contributes to a decrease in reactive power losses. In fact, the power losses decrease with DG pen-etration for all the cases, at least for a penpen-etration level of about 50%. For higher penetration level values, in the Near case, the losses start to increase, indicating power flow reverse in some branches.
Regarding the DG location distributions Random1 and Random2 the power losses always decrease. A possible interpretation for the difference in losses behavior may be that in the random cases, the nodes with DG are spread along the network while in the other cases the DG locations is constrained to be near to or far from the feeders. This way, the nodes with DG are obviously close to each other, therefore
Fig. 5. Active power losses for cases Random1 and Random2, respectively.
concentrated in just a few network branches. So for high DG penetration levels, the microgeneration production will have a thorough impact in the branches close to the DG nodes.
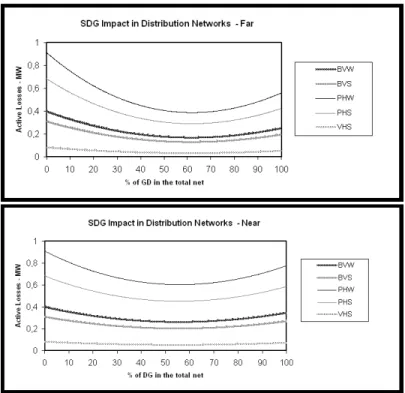
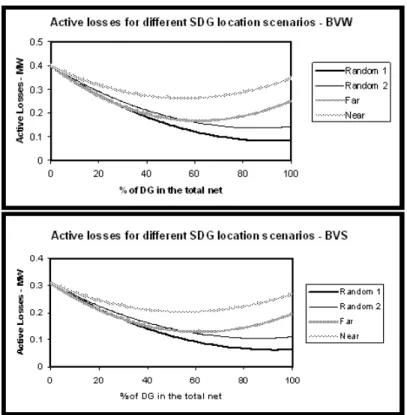
Figures 7 and 8 show the active power losses for the different load scenarios considered. Although these figures contain the same information than previous ones, in this case the effect of location is much more obvious. The main conclusion to be drawn from these results, is that for penetration levels up to approximately 30%, the further away the micro generators are from the substations, the larger is the power loss reduction compared to the base case (DG penetration of 0%).
158 J.N. Fidalgo, D.B.M.M. Fontes, S. Silva
Fig. 6. Active power losses for the Far case and the Near case, respectively.
Table 1 provides a summary of the annual energetic losses, while Table 2 reports on the percentage gains5 achieved on energy losses.
Table 1. Annual energy losses, in MWh. DG Random1 Random2 Near Far Average 0% 2577,6 2577,6 2577,6 2577,6 2577,6 10% 2145,7 2198,1 2280,2 2117,6 2185,4 20% 1773,1 1869,4 2118,4 1750,0 1877,7
Table 2. Percentage annual energy loss gains. DG Random1 Random2 Near Far Average 10% 16.8 14.7 11.5 17.9 15.2 20% 31.2 27.5 17.8 32.1 27.2
5These values have been computed as 1 − loss(0%GD) loss(10/20%GD).
Fig. 7. Active power losses for scenarios BVW and BVS, respectively.
4.2 Voltage profile
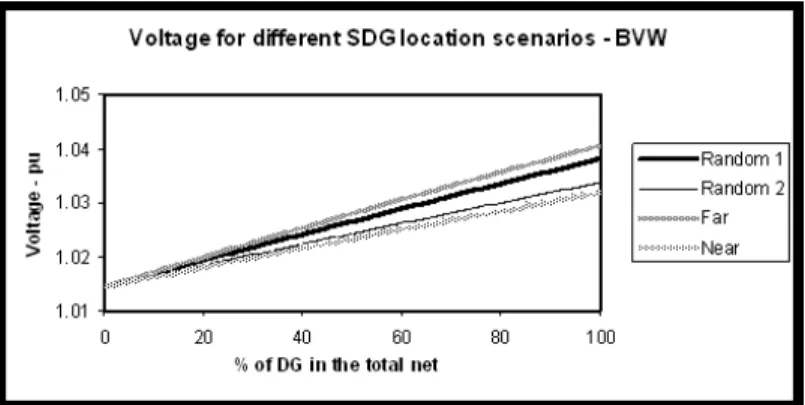
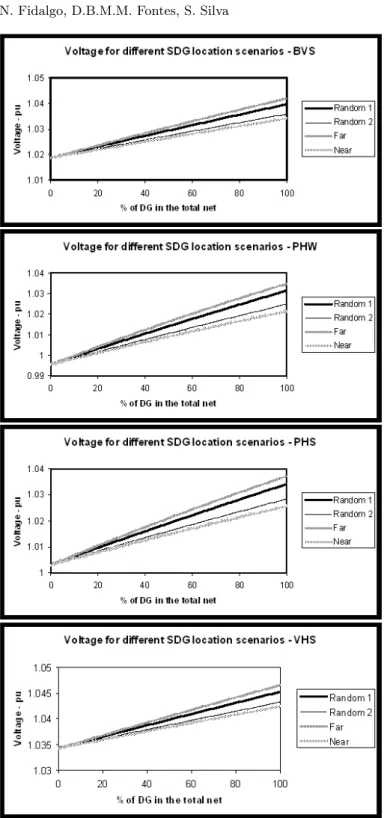
In this study, voltage values were computed for all nodes and for each load scenario and each DG location distribution. For the sake of simplicity and paper readability, we have decided to calculated and report only on the mean bus voltage. Fig. 9 shows the variation of the mean bus voltage, for scenario BVW, as a function of DG penetration for each of the four DG location distributions considered. Fig. 10 replicates this study for the other load scenarios.
The analysis of figures 9 and 10 shows that:
1. The mean voltage increases with DG penetration, as expected since DG pro-duction corresponds to a load decrease in the DG nodes;
2. Mean voltage values are higher when the DG location distribution is far from the feeding nodes.
Therefore, it may be conclude that, generally, DG producers located further away from the network substations have a shaper contribution towards voltage preserva-tion. This is an important feature, especially for heavily loaded networks susceptible to the voltage collapse phenomenon.
160 J.N. Fidalgo, D.B.M.M. Fontes, S. Silva
Fig. 9. Mean bus voltage vs DG penetration for scenario BVW.
4.3 Branches congestion
Power distribution networks are usually planned according to a given forecasted load evolution scenario. However, evidence shows that the spatial growth of loads often mismatches the expected development. In such cases, some network branches may be operating close to capacity, resulting in high power losses or, in the worst case, in the actuation of protective overload relays and consequently in load shedding.
In this work, we have started by detecting, for each load scenario, the heaviest loaded branch, see Table 3. DG may or not contribute to relieve the most loaded branches depending on whether the flows of these branches are feeding the nodes where DG machines are connected to or not.
Table 3. The most loaded branch for each loading scenario. Scenario Branch BVW 36-57 PHW 36-57 BVS 15-338 PHS 15-338 VHS 15-338
For the Near case, the most loaded branch is not “in the way” of any DG gen-erator. Therefore, as it can be seen in figures 11 to 15 , no effect is outputted for the Near case. Hence, in this case, the load remains constant regardless of the DG penetration. For the other DG locations, it can be conclude that higher levels of DG penetration lead to higher distress levels of the most loaded branch. It is not possible to draw general conclusions on the eventual benefits of DG generators location being close to or far from the feeding nodes. In fact, the changes on load flows in specific branches convey an absolute dependency on the electrical location of both items: DG machines and most loaded branch.
162 J.N. Fidalgo, D.B.M.M. Fontes, S. Silva
Fig. 10. Mean bus voltage vs DG penetration for scenarios BVS, PHW, PHS and VHS, respectively.
Fig. 11. Load charge of branches 36-57 and 15-338, respectively, for scenario BVW.
164 J.N. Fidalgo, D.B.M.M. Fontes, S. Silva
Fig. 13. Load charge of branches 36-57 and 15-338, respectively, for scenario PHW.
Fig. 15. Load charge of branches 36-57 and 15-338, respectively, for scenario VHS.
Table 4 shows by how many years the investment in branches reinforcement can be deferred. The years reported are for the worst case scenario (PHS) and assume a 5% annual load increase. With the exception of the Near case, it is obvious that DG is economically attractive, since it allows for the postponement of lines reinforcement investment.
Table 4. Years of branch reinforcement investment deferral. DG Random1 Random2 Far Near
10% 1 1 1 0
166 J.N. Fidalgo, D.B.M.M. Fontes, S. Silva
5 Conclusions
This paper has proposed a decision support system to quantify some of the technical benefits of introducing DG. The application, which may be perceived as a decision aid tool, is supported by a simulation platform that uses the classical Newton-Raphson algorithm to solve the power flow equations.
The application proposed is very robust and simple to use by as a decision aid toll. Besides that, it also has the advantage of providing the results very quickly. It should be noticed that it only takes about 5 seconds, in an AMD AthlonT M 208 GHz PC, to output all the results required to plot each of the graphs shown in Fig. 5 through to Fig. 15
Simulation results obtained using a real Semi-Urban MV network clearly show that DG can improve system voltage profile, reduce power losses, and reduce branches congestion. As expected, DG penetration level plays a vital role in de-termining the amount of voltage profile improvement, power losses, and branches congestion reduction. In general, voltage profile improvement, power losses reduc-tion, and branches congestion reduction increase with DG penetration level. How-ever, this trend is not always seen in the power loss reduction since for very high levels of penetration the power losses, typically start increasing. It should be notice, however, that this happens for penetration levels above 50%, which are very unlikely to occur.
The DG units’ location distribution is an important factor in determining the benefits. The results clearly indicate that introducing DG units close to the substa-tions (scenario Near) is the worst, since for any of the factors under analysis it is the least beneficial location. Regarding the random location distribution and the far from substation location distribution, the results indicate that Far is the location leading to the best improvements in the network. Nevertheless, for very high DG penetration levels the voltage profiles are better for the random locations. The ef-fects of the distance in branches congestion is not so clear as it depends not only on the specific location of the DG machines but also on the location of the most loaded branches.
References
1. A. R. Abdelaziz and W. M. Ali. Dispersed generation planning using a new evo-lutionary approach. In IEEE Power Tech Conference Proceedings, 2003 IEEE Bologna, volume 2, page 5, 2003.
2. P. P. Barker. Determining the impact of distributed generation on power sys-tems: Part i-radial distributed systems. In IEEE Power Engineering Society Summer Meeting, volume 3, pages 1645–1656, 2000.
3. R. E. Brown and L. A. A. Freeman. Analyzing the reliability impact on dis-tributed generation. In IEEE Power Engineering Society Summer Meeting, vol-ume 2, pages 1013–1018, 2001.
4. R. E. Brown, X. Feng J. Pan, and K. Koutlev. Siting distributed generation to defer t&d expansion. In Transmission and Distribution Conference and Expo, volume 2, pages 622–627, 2001.
5. P. Chiradeja and R. Ramakumar. A probabilistic approach to the analysis of voltage profile improvement with distributed wind electric generation. In IEEE Frontiers of Power Conference, pages XII 1–XII 10, 2001.
6. P. Chiradeja and R. Ramakumar. Voltage profile improvement with distributed wind turbine generation - a case study. In IEEE Power Engineering Society General Meeting, volume 4, page 236, 2003.
7. P. Chiradeja and R. Ramakumar. An approach to quantify the technical benefits of distributed generation. IEEE Transactions On Energy Conversion, 19(4):764– 773, 2004.
8. L. Dale. Distributed generation transmission. In IEEE Power Engineering Society Winter Meeting, volume 1, pages 132–134, 2002.
9. J. Dolezal, P. Santarius, J. Tlusty, V. Valouch, and F. Vybiralik. The effect of dispersed generation on power quality in distribution system. In Q Qual-ity and SecurQual-ity of Electric Power Delivery Systems, 2003. CIGRE/PES 2003. CIGRE/IEEE PES International Symposium, pages 204–207, 2003.
10. M. Gandomkar, M. Vakilian, and M. Ehsan. Optimal distributed generation allocation in distribution network using hereford ranch algorithm. In IEEE Electrical Machines and Systems, 2005. ICEMS 2005. Proceedings of the Eighth International Conference on, volume 2, pages 916–918, 2005.
11. H. A. Gil and G. J¨oos. On the quantification of the network capacity deferral value of distributed generation. IEEE Transactions on Power Systems, 21:1592– 1599, 2006.
12. J. J. Grainger and W. D. Stevenson. Power Systems Analysis. McGraw-Hill, New York, 1994.
13. N. Hadjsaid, J. F. Canard, and F. Dumas. Dispersed generation impact on distribution networks. IEEE Computer Applications in Power, 12:22–28, 1999. 14. T. Hoff and D. S. Shugar. The value of grid-support photovoltaics in reducing distribution system losses. IEEE Transactions on Energy Conversion, 10:569– 576, 1995.
15. G. J´oos, B.T. Ooi, D. McGillis, F.D. Galiana, and R. Marceau. The potential of distributed generation to provide ancillary services. In IEEE Power Engineering Society Summer Meeting, 2000.
16. J.A.P Lopes. Integration of dispersed generation on distribution networks-impact studies. In IEEE Power Engineering Society Winter Meeting, volume 1, pages 323–328, 2002.
17. M. R. Milligan and M. S. Graham. An enumerated probabilistic simulation technique and case study: Integrating wind power into utility production cost models. In National Renewable Energy Lab. for Wind Energy Program, 1996. 18. J. Oyarzabal, N. Hatziargyriou, J. Pe¸cas Lopes, A. Madureira, C. Moreira,
and Aris Androutsos. Di3 - report on socio-economic evaluation of microgrids. Project Consortium European Commission, 2005.
19. European Parliament and Council of the European Union. Directive /77/ec of the european parliament and of the council of 27 september 2001 on the promotion of electricity produced from renewable energy sources in the internal electricity market. Official Journal of the European Communities, 44:33–40, 2001.
20. S. Rahman. Fuel cell as a distributed generation technology. In IEEE Power Engineering Society Summer Meeting, volume 1, pages 551–552, 2001.
168 J.N. Fidalgo, D.B.M.M. Fontes, S. Silva
22. S. Silva. An´alise do impacto da pequena gera¸c˜ao dispersa sob diferentes direc-tivas de regula¸c˜ao. Master’s thesis, Faculdade de Economia da Universidade do Porto, 2007.
23. T. Tran-Quoc, C. Andrieu, and N. Hadjsaid. Technical impacts of small dis-tributed generation units on lv networks. In IEEE Power Engineering Society General Meeting, volume 4, page 2464, 2003.
24. H.L. Willis and W.G. Scott. Distributed power generation. Planning and evalu-ation. Marcel Dekker, New York, 2000.