AR
TICLE
Sexism against women among primary healthcare workers
Abstract The objective of this study was to rese-arch the existence of sexism against women among primary healthcare (PHC) workers and to identify associated factors. This was a cross-sectional study in which 163 PHC professionals of both sexes par-ticipated, all of whom were aged over 18 and had completed their primary or secondary education. The Gender Stereotyping and Ambivalent Sexism Inventory questionnaires were used. The average scores were more than 50% of the maximum score: Gender Stereotyping – 53.8%, hostile sexism – 58.2%, benevolent sexism – 64.1%. The average scores stratified by sociodemographic variables were higher. Significant differences in the hostile sexism score were found for sex (men scored higher than women), religion (higher scores for evangelical Christians) and among those who drank alcohol. For benevolent sexism, differences were found for schooling (greater scores for those who had only completed their primary education), religion (hi-gher scores for evangelical Christians and Catho-lics) and area of work (greater for those working in general services). The stratification of the Gender Stereotyping scores did not point to significant diffe-rences. Sexist prejudice was found to exist for hostile sexism, benevolent sexism and gender stereotyping. This finding could have a negative influence on the service-user relationship, leading to greater inequi-ties in health as a result of gender inequality. Key words Women’s health, Sexism, Health ine-quality, Healthcare staff, Health services
Marcos Mesquita Filho 1
Thaline Figueiredo Marques 2
Ana Beatriz Cavalcanti Rocha 2
Suellen Ramos de Oliveira 2
Maíra Barbosa Brito 2
Camila Claudiano Quina Pereira 1
1 Mestrado em Bioética,
Universidade do Vale do Sapucaí (Univas). Av. Pref. Tuany Toledo 470, Fátima. 37554-210 Pouso Alegre MG Brasil.
mesquita.filho@uol.com.br
2 Faculdade de Ciências da
M
esq
uita Filho M Introduction
Violence against women is considered to be a sig-nificant public health problem for a wide range of reasons: the seriousness of the physical, mental and social consequences; the high rates of mor-bidity and mortality that, according to the WHO, reach epidemic proportions1; the great suffering
that is caused; and the high costs incurred by the health system. Violence is largely motivated by gender prejudice and discrimination, which im-pede the drawing up and execution of effective strategies for addressing it2. These factors can
lead to undesirable situations in the health ser-vice practices. The Brazilian National Policy for Integral Care to Women’s Health even highlights that “questions of gender should be considered as one of the determinants of health when it comes to drawing up public policies”3.
Gender identity impacts on the perception of being a man or woman or how the person iden-tifies, based on the social roles that are attributed to the masculine and feminine gender. It is a so-cial and cultural construct that is different to sex, which relates to a biological condition, whereby the anatomy of the body will define masculine or feminine sex4.
A stereotype is understood to be “a process in which an impression is formed, made up of a collection of emotional, moral and instrumen-tal evaluations that are established with regard to an individual. This collection has the capacity to influence the perceiver in his or her relations with the social world”5. While sexism is “a
collec-tion of stereotypes relating to appearance, acts, talents, emotions and one’s appropriate role in society, related to gender. Although this can also involve stereotypes of men, it more frequently reflects prejudices against the feminine gender”6.
There are two, ambivalent dimensions to sex-ism: the hostile and the benevolent. The former is the manifestation of prejudice against women in an explicit fashion, “demonstrating beliefs and practices that are typical of people who consider women to be inferior to men, as well as the ex-pression of antipathy and intolerance in relation to a woman’s role as a figure of power and deci-sion making”. Benevolent sexism is displayed in the form of attitudes that apparently are not prej-udiced, and that are expressed in a manner that is subjectively positive, ascribing to the woman an identity that is dependent, fragile, and sensitive and that requires attention and protection from the man7. These displays of prejudice are
associat-ed with factors such as gender8,9, schooling10,11, an
affinity with conservativism, Christianity12, and
the consumption of alcohol and illegal drugs13.
Sexist and gender stereotyped views held by health professionals can lead to discriminatory and prejudiced practices. Deeply held prejudices and the repetition of inequalities related to the construction of gender identities can be found in the daily operations of health teams5. These
con-structions are reflected in the shortcomings of health services for women that can prevent them from receiving essential care and in turn lim-it teams from providing integral care to users7.
Gender identities govern not only health pro-fessionals’ attitudes, but also their ways of acting and facing problems. It is important to note that these identities are the result of a historical and ideological process that hold the masculine indi-vidual to be the central reference across society5.
Inequality between genders includes “differences between men and women that are unnecessary, unfair and avoidable in relation to their oppor-tunities to enjoy a healthy life and the probability of becoming ill, incapacitated or dying from pre-ventable causes”14.
Just as different populations are exposed to various types and levels of risk, women and men are also exposed to different patterns of suffering, illness and death, as a result of the social orga-nization of gender relations. Women encounter barriers and inequities of access to the health system. It is common for them to face difficul-ties in obtaining support for contraceptive meth-ods, as well as prenatal and postpartum care15.
In the same way, health services generally are not capable of providing an adequate response to situations of violence, either in the family or other realms5. It is not uncommon that in cases
involving violence against women, “the victim is blamed for the attack, and the prejudice dis-played by health professionals itself is the cause of a second offense against the woman”16. Health
workers should be equipped with the appropri-ate procedures to carry out their activities, par-ticularly in situations involving violence against women, guaranteeing confidentiality and access to specialist services for physical, mental and legal care1. In addition, studies have shown that
hospital care for people of the female sex is not equal to that provided to men, both in terms of the correct procedures and the quality with which those procedures are carried out1,17,18.
aúd
e C
ole
tiv
a,
23(11):3491-3504,
2018
by delineating specific territories and the popu-lations therein. The strengthening of this rela-tionship allows for issues which are important to the health sector but which previously had been overlooked to be addressed, as is the case of do-mestic violence19. Such violence may damage all
areas of the family, but its principal victims are women20. The SUS directives indicate that
pri-mary healthcare services are responsible for the first contact in cases involving violence against women. It is therefore essential to understand the perceptions of health professionals about the social construction of gender identities and violence against women, so that their actions in health might be developed and honed on finding solutions. The detection of sexism and other ste-reotypes and prejudices held by health workers, as well as understanding their causes, are both fundamental to ensuring that women’s health needs are better acknowledged and addressed by health professionals. The existence of sexism and gender stereotypes by professionals from the Family Health Strategy may exacerbate cases in-volving violence against women, rather than lead to more humanized and integrated solutions.
The objective of this study was to research the existence of prejudice against women among primary healthcare workers and to identify asso-ciated risk factors.
Methods
Design
This was a quantitative, exploratory, trans-versal and analytic study.
Location
Municipal Family Health teams from the Pouso Alegre municipality in Minas Gerais State of Brazil. This is a medium-sized municipality situated in the south of the state with an esti-mated population of 140.000 inhabitants. The primary healthcare services involved in the study were provided across 19 different health units which between them contained 252 professionals and on average provided coverage for 47% of the municipality’s population.
Study population and sample
The study population involved profession-als from the Family Health Strategy who were
selected on the basis of the following eligibility criteria: being a municipal worker, working in a Family Health Team, responsible for carrying out a health service function, be in contact with the general public, have primary or secondary schooling, to be active in the position (i.e. not to be off work due to health problems, for personal reasons, retirement etc) and agreeing to partici-pate in the study. Those who had tertiary educa-tion were not included in the study as they will be involved in a later phase of the research. The sample was made up of 163 health professionals, which represents 64.7% of people working in the sector (n = 252). 89 people did not take part in the study, of whom 17 were refusals and the re-maining 72 did either did not meet with the eli-gibility criteria or could not be found.
Research tools
Three research tools were used to collect data. In the first instance, a protocol for sociodemo-graphic and health data was used. The second tool was the Gender Stereotyping questionnaire which measures gender stereotypes in the context of relationships and responsibilities; it is in the public domain and was created by Gunter and Wober21, validated by Foshee and Baumann22,
and has a Brazilian version that was developed by Eufrásio23. The tool is made up of seven closed
items with four possible responses, each of which garners different scores when chosen: Com-pletely agree (4 points); agree (3); Disagree (2); Completely disagree (1). The scores for answers to Question 7 are inverted. The greater the final score, the greater indication of a stereotyped at-titude, with the highest possible score being 28.
The third instrument was the Inventory of Ambivalent Sexism that was originally developed by Glick and Fiske24 and adapted and
validat-ed for Brazil by Formiga et al.25. The inventory
M
esq
uita Filho M Procedures
The researchers visited the municipal prima-ry healthcare services and entered into contact with the research participants. They held meet-ings at each one of the health units wherein they explained the study objectives and methodology, then invited the staff who could be included in the research to participate. The sample was made up of those who agreed to participate by signing a free, prior and informed consent form. The ques-tionnaires were read out and participants were asked if they understood each question. If any doubt arose, the researcher would read the ques-tion again until the individual indicated that they had understood. The meanings of the questions themselves were never explained in order that the researcher did not influence the response. When there were no more questions, the participants themselves completed the questionnaires in the following order: 1 – Sociodemographic and health questionnaire; 2 – Gender stereotypes; 3 – Ambivalent sexism inventory. The research tools were applied in an isolated and quiet room with no interference from third parties. At the end of the period, the researcher checked that all ques-tions had been answered and requested respon-dents to complete any items that had not been completed.
Database and statistical analysis
The results of the questionnaire were added to an Excel database, and the statistical analysis was carried out using SPSS 17. For the description of the quantitative variables, (average and medi-an) central tendency and dispersion tendency (standard deviation) were used. The categorical variables were described in proportions. When the distribution of the variables was normal during the central tendency analysis, the t-test or analysis of variance (ANOVA) were applied. For non-parametric variables the Mann-Whitney or Kruskal-Wallis tests were used; and the Kolmog-orov-Smirnov test was used to demonstrate ad-hesion to normal. Statistical significance was set at p ≤ 0.05.
Ethical procedures
The research followed the directives of the National Health Council’s resolution number 466/2012 and was approved by the Research Eth-ics Committee of the Universidade do Vale do Sapucaí.
Results
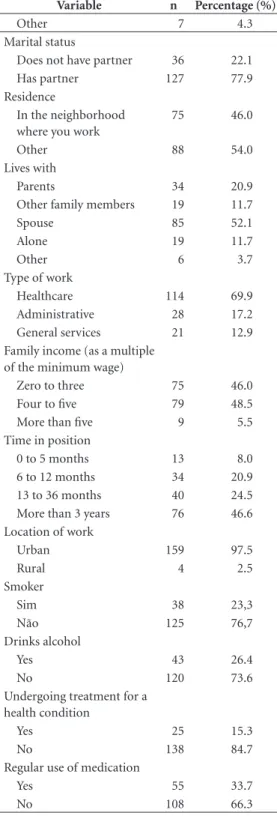
The sample was mainly made up of women (89%), of whom 58.9% were aged over 35. The majority of workers had completed their second-ary or technical education (78.5%). 79.8% of re-spondents identified as white, while 70.6% were Catholic and 77.9% had a partner. More than half of the workers (54.0%) lived in a different neigh-borhood to the one in which the Health Unit was located; 52.1% lived with their spouses and 20.9% with their parents. The majority of pro-fessionals held positions in healthcare (69.9%), while the remainder worked in administration or in support services. All respondents had direct contact with service users. 94.5% of respondents earned up to a maximum of five times the min-imum salary, with 71.1% holding their current position for at least a year, with 97.5% carrying out their services in urban areas. A total of 38 health professionals were smokers (23.3%) and 43 (26.4%) consumed alcohol (Table 1).
The average score in the Gender Stereotypes questionnaire was 15.07, which represented 53.8% of the maximum possible score (Table 2). There were two items for which the average score was below 50% of the maximum possible score: one relating to men pushing women around and another relating to physical aggression. Five items scored more than half the possible points and the two that scored over 70% related to affirmations that men who show an interest in women are after sex and women look for romance. In the
Table 1. Sociodemographic and health variables.
Variable n Percentage (%)
Sex
Female 145 89.0
Male 18 11.0
Age range
18 to 35 67 41.1
Over 35 96 58.9
Schooling
Primary education 35 21.5
Secondary or technical education
128 78.5
Skin color
White 130 79.8
Other 33 20.2
Religion
Catholic 115 70.6
Evangelical Christian 41 25.2
aúd
e C
ole
tiv
a,
23(11):3491-3504,
2018
Sexual Ambivalence Inventory (Tables 2, 3 and 4) the average score for the Hostile component was 32.03 (58.2% of the maximum score). The great majority of items for this measure received
a score that was more than half of the maximum possible, with the only exception being the affir-mation that women interpret innocent remarks as being sexist, with the example being “some-times it is right for a man to hit a woman”. The question that scored the highest (73.7%) was the one that stated that there are very few wom-en who get a kick out of teasing mwom-en by seem-ing sexually available and then refusseem-ing male advances. Most scored between 50% and 70%. The questions relating to benevolent sexism re-ceived an averages score of 35.23 (64.1% of the maximum), and included seven questions that scored more than 60% of the maximum total, with four of these scoring more than 70%. Just the one score was below 50% of the maximum (“In a disaster, women ought not necessarily to be rescued before men”).
Table 3 shows that among the scores for hos-tile sexism when stratified by sociodemographic variables, declaring one’s religion to be ‘other’ (i.e. neither Catholic or Evangelical Christian) received the lowest average score, representing 49.6% of the maximum possible. The highest score was for those individuals who had only completed primary education, scoring 67.3% of the maximum for benevolent sexism. When the average scores were categorized by sociodemo-graphic variable, they all scored more than 50% of the maximum possible, with the one exception mentioned above.
Table 5 shows that Gender Stereotypes are not significantly associated with any sociodemo-graphic or health variable.
Hostile sexism (Table 4) was associated with sex (p < 0.001), with men scoring more than women. When this variable was stratified by sex and race, white men were found to have an aver-age score (37.1; DP = 7.3) that was greater than that scored by white women (31.5; DP = 5.8); a finding that was statistically significant (p = 0.01). The averages scores for non-whites were also greater among men (p = 0.03). When white men were compared with non-white men, no significant difference was found, nor was the case for women. Hostile sexism was also significantly associated with religion: evangelicals were found to be the most likely to be hostile sexists, followed by Catholics, then ‘other’ (p = 0.048). This type of behavior also prevailed significantly (p = 0.025) among alcohol drinkers (score = 33.84) com-pared with other workers (score = 31.38). Other variables including age range, schooling, self-de-clared color, marital status, residing with spouse, type of role in the health services, income, time
Table 1. Sociodemographic and health variables.
Variable n Percentage (%)
Other 7 4.3
Marital status
Does not have partner 36 22.1
Has partner 127 77.9
Residence
In the neighborhood where you work
75 46.0
Other 88 54.0
Lives with
Parents 34 20.9
Other family members 19 11.7
Spouse 85 52.1
Alone 19 11.7
Other 6 3.7
Type of work
Healthcare 114 69.9
Administrative 28 17.2
General services 21 12.9
Family income (as a multiple of the minimum wage)
Zero to three 75 46.0
Four to five 79 48.5
More than five 9 5.5
Time in position
0 to 5 months 13 8.0
6 to 12 months 34 20.9
13 to 36 months 40 24.5
More than 3 years 76 46.6
Location of work
Urban 159 97.5
Rural 4 2.5
Smoker
Sim 38 23,3
Não 125 76,7
Drinks alcohol
Yes 43 26.4
No 120 73.6
Undergoing treatment for a health condition
Yes 25 15.3
No 138 84.7
Regular use of medication
Yes 55 33.7
M
esq
uita Filho M Table 2. Average score and percentage of maximum score by variable for the Gender Stereotyping and Ambivalent Sexism Inventory questionnaires.
Tool and Questions Average
Score % of
Total Median
Gender Stereotyping 15.07 53.8 15.0
1. Most women like to be pushed around by men 1.48 37.1 1.0
2. Most women like to show off their bodies 2.70 67.5 3.0
3. Most men want to go out with women just for sex 2.85 71.3 3.0
4. Most women enjoy romantic affairs with men 2.94 73.5 3.0
5. Most women depend on men to get them out of trouble 2.22 55.5 2.0
6. Sometimes it is right for a man to hit a woman 1.39 34.8 1.0
7. Men and women should have equal responsibility for bringing up children 1.48 63.0 1.0
Ambivalent Sexism Inventory
Hostile sexism 32.03 58.2 32.0
Benevolent sexism 35.23 64.1 36.0
1. No matter how accomplished he is, a man is not truly complete as a person unless he has the love of a woman.
3.36 67.2 4.0
2. Many women are actually seeking special favors, such as hiring policies that favor them over men, under the guise of asking for “equality.”
3.15 63.1 3.0
3. In a disaster, women ought not necessarily to be rescued before men. 2.45 49.1 2.0
4. Most women interpret innocent remarks or acts as being sexist. 2.37 47.5 2.0
5. Women are too easily offended. 3.33 66.5 4.0
6. People are often truly happy in life without being romantically involved with a member of the other sex.
2.60 51.9 2.0
7. Feminists are seeking for women to have more power than men. 2.83 56.6 2.0
8. Many women have a quality of purity that few men possess. 3.37 67.5 4.0
9. Women should be cherished and protected by men. 3.99 79.8 4.0
10. Most women fail to appreciate fully all that men do for them. 2.91 58.3 3.0
11. Women seek to gain power by getting control over men. 2.69 53.9 2.0
12. Every man ought to have a woman whom he adores. 3.57 71.4 4.0
13. Men are complete without women. 3.19 63.8 4.0
14. Women exaggerate problems they have at work. 2.63 52.6 2.0
15. Once a woman gets a man to commit to her, she usually tries to put him on a tight leash.
2.89 57.8 3.0
16. When women lose to men in a fair competition, they typically complain about being discriminated against.
2.78 55.6 2.0
17. A good woman should be set on a pedestal by her man. 2.96 59.3 2.0
18. There are actually very few women who get a kick out of teasing men by seeming sexually available and then refusing male advances.
3.69 73.7 4.0
19. Women, compared to men, tend to have a superior moral sensibility. 3.51 70.2 4.0
20. Men should be willing to sacrifice their own well-being in order to provide financially for the women in their lives.
2.70 54.0 2.0
21. Feminists are making entirely reasonable demands of men. 2.75 55.1 3.0
22. Women, as compared to men, tend to have a more refined sense of culture and good taste.
3.53 70.6 4.0
aúd
e C
ole
tiv
a,
23(11):3491-3504,
2018
of service and smoking did not show any signifi-cant differences.
In Table 4, benevolent sexism is found to be significantly associated with a number of vari-ables: level of schooling, where those with only primary education had scored highest; religion, where evangelicals scored higher; type of work in the health sector, whereby those who worked in general services were found to be the most be-nevolent sexists. Other sociodemographic vari-ables showed no statistical differences for this measure.
Discussion
The elements that make up the sociodemograph-ic profile of this sample are consistent with those characteristics found among health professionals in other studies26,27.
There are no predefined cut off points for the three scales used (gender stereotypes, hostile sexism and benevolent sexism); rather, the au-thors advise that the higher the score, the greater the level of prejudice. In this research, all scores were high, pointing to the existence of prejudice
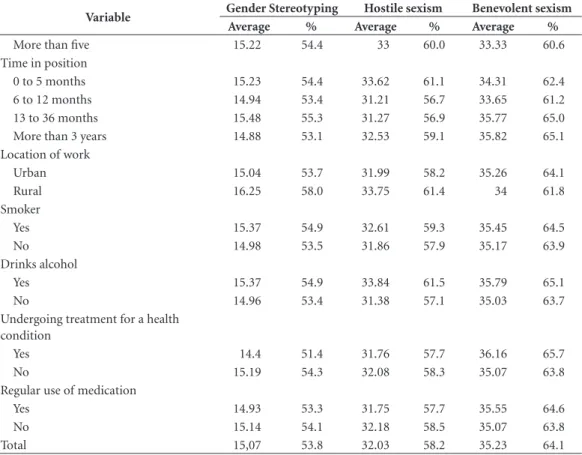
Table 3. Average scores and percentage of maximum scores for Gender Stereotyping, Hostile Sexism and
Benevolent Sexism by sociodemographic and health variables.
Variable Gender Stereotyping Hostile sexism Benevolent sexism
Average % Average % Average %
Sex
Female 15.02 53.6 31.41 57.1 35.41 64.4
Male 15.44 55.1 37.06 67.4 33.78 61.4
Age range
18 to 35 15.1 53.9 32.67 59.4 35.82 65.1
Over 35 15.04 53.7 31.58 57.4 34.82 63.3
Schooling
Primary education 14.71 52.5 31.63 57.5 37.03 67.3
Secondary or technical education 15.16 54.1 32.14 58.4 34.74 63.2
Skin color
White 14.98 53.5 31.97 58.1 35.22 64.0
Other 15.39 55.0 32.27 58.7 35.27 64.1
Religion
Catholic 14.97 53.5 31.86 57.9 34.96 63.6
Evangelical Christian 15.39 55.0 33.32 60.6 36.76 66.8
Other 14.86 53.1 27.29 49.6 30.86 56.1
Marital status
Does not have partner 14.51 51.8 32.5 59.1 34.97 63.6
Has partner 15.2 54.3 31.9 58.0 35.31 64.2
Residence
In the neighborhood where you work 15.44 55.1 33.12 60.2 35.88 65.2
Other 14.75 52.7 31.1 56.5 34.68 63.1
Lives with
With spouse 15.02 53.6 31.78 57.8 35.27 64.1
Alone or with others 15.12 54.0 32.31 58.7 35.19 64.0
Type of work
Healthcare 15.11 54.0 31.94 58.1 35.06 63.7
Administrative 15.32 54.7 33.25 60.5 35.57 64.7
General services 14.52 51.9 30.9 56.2 35.71 64.9
Family income (as a multiple of the minimum wage
Zero to three 15.23 54.4 32.25 58.6 36 65.5
Four to five 14.9 53.2 31.71 57.7 34.72 63.1
M
esq
uita Filho M
Variable Gender Stereotyping Hostile sexism Benevolent sexism
Average % Average % Average %
More than five 15.22 54.4 33 60.0 33.33 60.6
Time in position
0 to 5 months 15.23 54.4 33.62 61.1 34.31 62.4
6 to 12 months 14.94 53.4 31.21 56.7 33.65 61.2
13 to 36 months 15.48 55.3 31.27 56.9 35.77 65.0
More than 3 years 14.88 53.1 32.53 59.1 35.82 65.1
Location of work
Urban 15.04 53.7 31.99 58.2 35.26 64.1
Rural 16.25 58.0 33.75 61.4 34 61.8
Smoker
Yes 15.37 54.9 32.61 59.3 35.45 64.5
No 14.98 53.5 31.86 57.9 35.17 63.9
Drinks alcohol
Yes 15.37 54.9 33.84 61.5 35.79 65.1
No 14.96 53.4 31.38 57.1 35.03 63.7
Undergoing treatment for a health condition
Yes 14.4 51.4 31.76 57.7 36.16 65.7
No 15.19 54.3 32.08 58.3 35.07 63.8
Regular use of medication
Yes 14.93 53.3 31.75 57.7 35.55 64.6
No 15.14 54.1 32.18 58.5 35.07 63.8
Total 15,07 53.8 32.03 58.2 35.23 64.1
Table 3. Average scores and percentage of maximum scores for Gender Stereotyping, Hostile Sexism and
Benevolent Sexism by sociodemographic and health variables.
against women among health workers. The high-est averages were found for the benevolent sexism component. This may be because the indicators represented “positive attitudes that are apparent-ly not prejudiced against women, demonstrating paternalistic sentiment which sees the woman as a fragile person who requires attention, but who can also complement a man”28. The damaging
ef-fects of hostile sexism are not open to question, while there is less social recognition of the nega-tive consequences of benevolent sexism.
For the analysis using Gender Stereotypes, no statistically significant differences were found when the scores for each item were stratified for sociodemographic variables. Nonetheless, these stereotypes were present, since the scores were high (all but one scored more than half of the maximum score), irrespective of the stratifica-tion that was carried out. Sexism and Gender Stereotypes increase the risk of violence against women6,28. The health sector often witnesses
abuse, mistreatment, negligence, abandonment, delays, disrespect, a breakdown of trust, neglect of another’s autonomy, and the carrying out of
painful and unnecessary procedures that affect women29. Health sector workers can cause
dam-age and prejudice to health sector uses and to the overall functioning of the health system. Health sector professionals who want to carry out their work in a way that is effective and humanized, showing interest, sharing dialogue and being res-olute, need training to deal with subjective social issues that are prevalent in service delivery. Pri-mary healthcare and the Brazilian Family Health Strategy are based on the attributes of access, long-termism, integrality, coordination, cultur-al competence30, receptivity and social bonds31.
Where sexism and prejudice is rife, these qualities are not attainable particularly since the largest proportion of those who access primary health-care are women32.
aúd
e C
ole
tiv
a,
23(11):3491-3504,
2018
Table 4. Average and median scores, standard deviation and p value for Hostile and Benevolent Sexism by
sociodemographic and health variables.
Variable
Hostile sexism Benevolent sexism
Average Standard
deviation Median p Average
Standard
deviation Median p
Sex < 0.001*, ES 0.239*
Female 31.41 5.83 31.00 35.41 5.52 36.00
Male 37.06 6.68 37.00 33.78 5.68 35.50
Age range 0.269* 0.260*
18 to 35 32.67 6.23 32.00 35.82 5.45 37.00
Over 35 31.58 6.11 31.00 34.82 5.60 35.00
Schooling 0.612* 0.013*SS
Primary education 31.63 4.89 31.00 37.03 4.36 37.00
Secondary or technical education
32.14 6.48 32.00 34.74 5.75 35.00
Skin color 0.801* 0.964*
White 31.97 6.15 31.50 35.22 5.39 36.00
Other 32.27 6.33 32.00 35.27 6.22 38.00
Religion 0.048**. SS 0.020**SS
Catholic 31.86 5.76 32.00 34.96 5.53 35.00
Evangelical Christian 33.32 7.12 32.00 36.76 4.93 37.00
Other 27.29 4.11 27.00 30.86 6.91 33.00
Marital status 0.606* 0.750*
Does not have partner 32.50 6.39 33.00 34.97 6.26 35.50
Has partner 31.90 6.12 31.00 35.31 5.35 36.00
Lives with 0.584* 0.929*
With spouse 31.78 5.93 31.00 35.27 5.30 36.00
Alone or with others 32.31 6.44 32.00 35.19 5.83 35.50
Type of work 0.405** 0.024**SS
Healthcare 31.94 6.13 36.00 35.06 5.60 36.00
Administrative 33.25 7.25 36.00 35.57 5.90 36.00
General services 30.90 4.58 36.00 35.71 4.97 36.00
Family income (as a multiple of the minimum wage)
0.767** 0.207**
Zero to three 32.25 6.53 32.00 36.00 5.29 37.00
Four to five 31.71 5.77 31.00 34.72 5.67 35.00
More than five 33.00 6.93 32.00 33.33 6.23 36.00
Time in position 0.468** 0.226**
0 to 5 months 33.62 7.02 33.00 34.31 4.96 33.00
6 to 12 months 31.21 6.06 30.00 33.65 6.28 34.50
13 to 36 months 31.27 5.29 31.50 35.77 4.41 36.00
More than 3 years 32.53 6.50 32.00 35.82 5.76 36.00
Location of work 0.574* 0.654**
Urban 31.99 6.17 32.00 35.26 5.57 36.00
Rural 33.75 6.65 32.00 34.00 4.76 32.00
Smoker 0.513* 0.787**
Yes 32.61 7.14 31.00 35.45 5.70 36.00
No 31.86 5.86 32.00 35.17 5.52 36.00
Drinks alcohol 0.025*. SS 0.444**
Yes 33.84 6.52 34.00 35.79 5.43 36.00
No 31.38 5.93 30.50 35.03 5.60 36.00
Total 32.03 6.17 32.00 35.23 5.55 36.00
M
esq
uita Filho M Table 5. Average and median scores, standard deviation and p value for Gender Stereotypes by sociodemographic and health variables.
Variable Average Standard deviation Median p
Sex 0.699*
Female 15.02 2.51 15.00
Male 15.44 2.71 15.00
Age range 0.841*
18 to 35 15.10 2.00 15.00
Over 35 15.04 2.85 15.00
Schooling 0.102*
Primary education 14.71 3.21 15.00
Secondary or technical education 15.16 2.32 15.00
Skin color 0153*
White 14.98 2.52 15.00
Other 15.39 2.59 15.00
Religion 0.772**
Catholic 14.97 2.57 15.00
Evangelical Christian 15.39 2.45 15.00
Other 14.86 2.48 16.00
Marital status 0.699*
Does not have partner 14.51 2.99 15.00
Has partner 15.20 2.38 15.00
Residence 0.074*
In the neighborhood where you work 15.44 2.26 15.00
Other 14.75 2.71 15.00
Lives with 0.172*
Spouse 15.02 2.32 15.00
Others 15.12 2.75 15.00
Type of work 0.992**
Healthcare 15.11 2.13 15.00
Administrative 15.32 3.23 14.50
General services 14.52 3.40 16.00
Family income (as a multiple of the minimum wage) 0.477**
Zero to three 15.23 2.76 15.00
Four to five 14.90 2.36 15.00
More than five 15.22 1.99 15.00
Time in position 0.656**
0 to 5 months 15.23 2.28 15.00
6 to 12 months 14.94 2.19 15.00
13 to 36 months 15.48 2.46 15.00
More than 3 years 14.88 2.76 15.00
Location of work 0.204*
Urban 15.04 2.55 15.00
Rural 16.25 1.26 16.00
Smoker 0.545*
Yes 15.37 2.66 15.00
No 14.98 2.49 15.00
Drinks alcohol 0.521*
Yes 15.37 2.74 15.00
No 14.96 2.45 15.00
Undergoing treatment for a health condition 0.132*
Yes 14.40 2.58 14.00
No 15.19 2.51 15.00
Regular use of medication 0.774*
Yes 14.93 2.43 15.00
No 15.14 2.59 15.00
Total 15.07 2.53 15.00
aúd
e C
ole
tiv
a,
23(11):3491-3504,
2018
This finding may suggest that female users face discrimination even in situations in which they seek health services and choose to be treated by professionals of the same sex.
It is nonetheless important to remember that the Gender Stereotypes scale is made up of seven items and is unable to evaluate the overall com-plexity of this construct. The tool provides results with limited precision that serve to screen infor-mation28, and should therefore be treated with
caution.
The results of the Hostile Sexism question-naire showed that both men and women had scores that pointed to the presence of prejudice, although the men were considerably more hostile than the women. Studies have shown an associa-tion between sexism and racism33,34. The fact that
the majority of workers are white could also be a contributing factor towards the detection of hostile sexism in men and women. However the stratification of score for hostile sexism by sex and color did not show differences between white and non-white men, nor between these same groups of women. It was not possible to detect any inter-relations between sexism and racism in this study on account of the complexity and multidimensional nature of this construct34. The
instruments used here were not intended to ad-dress these questions. Another factor that should be taken into consideration is the ethnic compo-sition of the population of service users, which is probably different to that of the research par-ticipants, with a higher proportion of non-white, which may influence the results.
When it comes to hostile sexism, there were significant differences depending on the religion that was practiced by the health professional. While both Catholics and Evangelicals scored highly, indicating a position of hostile sexism, those who declared their religion to be ‘other’ scored slightly below half the possible number of points. Studies have suggested that religions pro-vide spaces in which sexist and unequal relations between women and men can be replicated in fa-vor of men35. Mickoleajc e Pietrzak12 found a
re-lationship between the Catholic religion and the presence of benevolent sexism, but not of hostile sexism, different to this study. In Brazil, Catholics and Evangelicals traditionally hold conservative values with regard to family, sexuality and mo-rality11. Afro-Brazilian religions tend to show
greater respect for the values and beliefs of their followers36,37.
People who consume alcohol regularly scored significantly higher for Hostile Sexism compared
with non-consumers. This finding supports the view that alcohol use is a factor that can lead to hostile sexism13,38. It is also associated with
vio-lence against women39.
Of all the constructs, Benevolent Sexism held the highest scores, which were generally above 60% of the maximum possible score.
The results suggest that respondents from all sociodemographic categories can be consid-ered to display benevolent sexism, although there were statistically significant differences in three of them: schooling, religion and type of work. There were no differences between men and women, a result that is consistent with those of other studies10,40. As discussed for the other
con-structs, both men and women were found to be benevolently sexist.
The lower the level of schooling, the greater the degree of benevolent sexism10,41. Those health
workers with primary schooling were significant-ly more prejudiced than those with secondary or technical schooling.
As was the case for hostile sexism, the par-ticular religion was associated with benevolent sexism, but with higher scores. Catholics and Evangelicals scored more highly, which points to greater levels of benevolent sexism among Chris-tian groups, compared with others. This is gener-ally considered to be due to the greater degree of conservativism among such groups12.
Health staff working directly with healthcare were found to be significantly less benevolently sexist that those who worked in administration and general services. This may be associated to the greater level of schooling of this first group or be due to the fact that they receive more train-ing, or have greater contact with users which may lead them to have more humanist motives. But in spite of the statistical difference, they all scored highly, being greater than 60% of the maximum possible. The first contact that a user generally has when she or he arrives at a primary health-care service is with reception staff, although this function may be the responsibility of peo-ple from the administrative area. In both cases, the demand of the service user may potentially give rise to prejudice and the receptionist’s atti-tude may be sexist, which is against the rights of health, of humanized care and of respect.
Study limitations
pub-M
esq
uita Filho M licly acknowledged, this may result in censure
and embarrassment. Some workers may choose not to give an honest answer to a question for fear of being condemned as prejudiced, since sexist attitudes are socially unacceptable and may lead to criticisms. Research into behaviors that are deemed worth of reproach or that are illegal may have inaccurate results and statisti-cal biases. However, there is very little research in the literature about how such limitations might be assuaged. In order to address this risk, the researchers carried out a full explanation of the research objectives and methodology before applying the research instruments, and insisted upon the guarantee of confidentiality. In addi-tion, the questionnaires were completed by the respondents themselves, in a quiet place where other people would not disturb them. The re-spondent always replied on an individual basis, therefor avoiding any kind of intimidation or embarrassment, either on the part of the respon-dent themselves or of a third party who might try to influence the answers. Crömbach’s alpha was also used for the statistical analysis in order to measure the reliability of the results.
Any generalization of the results was done so with a degree of caution, given that the study was carried out in a medium-sized municipali-ty in the southeast of Brazil, and that prejudice against women can take many different forms in the country’s various regions. More information could be added to the results if other factors were taken into consideration such as the level of ex-perience or training of the health professional. It was also difficult to make direct comparison with other studies, since this is an area that has received little attention from other studies.
Conclusions
The results of this study show that health pro-fessionals display Gender Stereotypes, as well as Hostile and Benevolent Sexism. They are associ-ated with variables that show that these phenom-ena are present in broader social situations, of which health services are just a part, and as such are questions that need to be addressed by the whole of society.
The existence of prejudice against women in the health services is unacceptable under any cir-cumstances. Its occurrence in primary healthcare practice is also unacceptable since it worsens ex-isting inequities. Health workers themselves may become the cause of problems. Individuals who are sexist or who employ stereotypes are unable to assume an ethical role when it comes to the protection of users of the Brazilian public health system, SUS, as they do not carry out their re-sponsibility to “protect living beings and entities against threats that might cause irreversible dam-age to their existence”42. Populations that include
women or those who are victims of violence and other confrontations will be exposed to attitudes that are harmful and hostile with prejudices in the mental, physical, moral, spiritual and citizen spheres.
The findings of this study have given rise to the possibility of carrying out further research. New aspects of the research could be given atten-tion, such as giving voice to users, and addressing issues about the development of health prac-tices, the existence or not of continuous educa-tion, work relations, social acceptance and other questions, thereby delving deeper into the issues raised here.
aúd
e C
ole
tiv
a,
23(11):3491-3504,
2018
Collaborations
M Mesquita Filho worked on the study concep-tion and design, analysis and interpretaconcep-tion of data, article write-up, critical revision and ap-proval of the final version for publication. ABC Rocha, MB Brito, SR Oliveira and TF Marques worked on the study conception and design, and on the collection, analysis and interpretation of the data. CCQ Pereira was involved in writing the article, its critical revision and approval of the fi-nal version for publication.
References
1. World Health Organization (WHO). Global and re-gional estimates of violence against women: prevalence and health effects of intimate partner violence and
non-partner sexual violence. Genebra: WHO; 2013.
2. Stuber J, Meyer I, Link B. Stigma, prejudice, discrim-ination and health. Soc Sci Med 2008; 67(3):351-357. 3. Brasil. Ministério da Saúde (MS). Política nacional de
atenção integral à saúde da mulher: princípios e diretri-zes. Brasília: MS; 2004.
4. Araújo LM, Penna LHG. A relação entre sexo, identida-des sexual e de gênero no campo da saúde da mulher.
Rev enferm UERJ 2014; 22(1):134-138.
5. Franzoi NM, Fonseca RMGS, Guedes RN. Violência de gênero: concepções de profissionais das equipes de saúde da família. Rev. Latino-Am. Enfermagem 2011; 19(3):589-597.
6. Formiga NS. Valores humanos e sexismo ambivalente.
Rev. Dep. Psicol. 2007; 19(2):381-396.
7. Guedes RN, Silva ATMC, Coelho EAC. Violência con-jugal: problematizando a opressão das mulheres viti-mizadas sob olhar de gênero. Rev Eletr Enferm 2007; 9(2):362-378.
8. Guimarães ASA. O insulto racial: as ofensas verbais registradas em queixas de discriminação. Estud.
af-ro-asiát. 2000; 38:31-48.
9. Wilson BL, Diedrich A, Phelps CL, Choi M. Bullies at work: The impact of horizontal hostility in the hos-pital setting and intent to leave. J Nurs Adm 2011; 41(11):453-458.
10. Moyano M, Expósito F, Trujillo HM. Cierre cognitivo, sexismo y religiosidad: diferencias y similitudes entre grupos de adolescentes con distinta cultura. Anal. Psi-col. 2013; 29(2):501-508.
11. Parga EJS, Sousa JHM, Costa, MC. Estereótipos e preconceitos de gênero entre estudantes de enferma-gem da UFBA. Revista Baiana de Enfermagem 2001; 14(1):111-118.
12. Mikołajczak M, Pietrzak J. Ambivalent Sexism and Religion: Connected Through Values. Sex Roles 2014; 70(9-10):387-399.
13. Souza TMS. Assédio moral e assédio sexual: interfaces.
Revista de Gestão Integrada em Saúde do Trabalho e
Meio Ambiente 2008; 3(3):1-11.
14. Fonseca RMGS. Eqüidade de gênero e saúde das mu-lheres. Rev Esc Enferm USP 2005; 39(4):450-459. 15. Benites APO, Barbarini N. Histórias de vida de
mulhe-res e saúde da família: algumas reflexões sobre gênero.
Psicol. Soc. 2009; 21(1):16-24.
16. Herrera C, Agoff C. Dilemas del personal médico ante la violencia de pareja en México. Cad Saude Publica
2006; 22(11):2349-2357.
17. Ayanian JZ, Epstein AM. Differences in the use of pro-cedures between women and men hospitalized for cor-onary artery disease. N Engl J Med 1991; 325(4):221-225.
18. Ayanian JZ, Weissman JS, Chasan-Taber S, Epstein AM. Quality of care by race and gender for congestive heart failure and pneumonia. MedCare 1999; 37(12):1260-1269.
M
esq
uita Filho M 20. Saliba O, Garbin CAS, Garbin AJI, Dossi AP.
Responsa-bilidade do profissional de saúde sobre a notificação de casos de violência doméstica. RevSaude Publica 2007; 41(3):472-477.
21. Gunter B, Wober M. Television viewing and perceptions of women’s roles on television and in real life. Current
Psychological Research 1982; 2(1-3):277-287.
22. Foshee VA, Bauman KE. Gender stereotyping and adolescent sexual behavior: a test of temporal order.
Journal of Applied Social Psychology 1992;
22(20):1561-1579.
23. Eufrásio C. Tradução, adaptação cultural e validação do
questionário Gender Stereotyping [dissertação]. Pouso
Alegre: Universidade do Vale do Sapucaí; 2007. 24. Glick P, Fiske ST, Mladinic A, Saiz JL, Abrams D, Masser
B, Adetoun B, Osagie JE, Akande A, Alao A, Brunner A, Willemsen TM, Chipeta K, Dardenne B, Dijkster-huis A, Wigboldus D, Eckes T, Six-Materna I, Expósi-to F, Moya M, Foddy M, Kim HJ, Lameiras M, Sotelo MJ, Mucchi-Faina A, Romani M, Sakalli N, Udegbe B, Yamamoto M, Ui M, Ferreira MC, López López W. Beyond prejudice as simple antipathy: Hostile and be-nevolent sexism across cultures. J Pers Soc Psychol 2000; 79(5):763-775.
25. Formiga NS, Gouveia VV, Santos MN. Inventário de sexismo ambivalente: sua adaptação e relação com o gênero. Psicologia em Estudo 2002; 7(1):105-111. 26. Tomasi E, Facchini LA, Piccini RX, Thumé E, Silveira
DS, Siqueira FV, Rodrigues MA, Paniz VV, Teixeira VA. Perfil sócio-demográfico e epidemiológico dos traba-lhadores da atenção básica à saúde nas regiões Sul e Nordeste do Brasil. Cad Saude Publica 2008; 24(Supl. 1):s193-s201.
27. Cotta RMM, Schott M, Azeredo CM, Franceschini SCC, Priore SE, Dias G. Organização do trabalho e per-fil dos profissionais do Programa Saúde da Família: um desafio na reestruturação da atenção básica em saúde.
Epidemiol. Serv. Saúde 2006; 15(3):7-18.
28. Mesquita Filho M, Eufrásio C. Estereótipos de Gênero e Sexismo Ambivalente em Adolescentes Masculinos de 12 a 16 Anos. Saúde Soc. 2011: 20(3):554-567. 29. Vogel JP, Bohren MA, Tunçalp O, Oladapo OT, Adanu
RM, Baldé MD, Maung TM, Fawole B, Adu-Bonsaffoh K, Dako-Gyeke P, Maya ET, Camara MC, Diallo AB, Diallo S, Wai KT, Myint T, Olutayo L, Titiloye M, Alu F, Idris H, Gülmezoglu MA; WHO Research Group on the Treatment of Women During Childbirth. How women are treated during facility-based childbirth: development and validation of measurement tools in four countries – phase 1 formative research study pro-tocol. Reprod Health 2015; 12:60.
30. Starfield B. Atenção primária: equilíbrio entre
necessi-dades de saúde, serviços e tecnologia. Brasília: Unesco,
Ministério da Saúde; 2002.
31. Coelho MO, Jorge MSB. Tecnologia das relações como dispositivo do atendimento humanizado na atenção básica à saúde na perspectiva do acesso, do acolhi-mento e do vínculo. Cien Saude Colet 2009; 14(Supl. 1):1523-1531.
32. Fernandes LCL, Bertoldi AD, Barros AJD. Utilização dos serviços de saúde pela população coberta pela Es-tratégia de Saúde da Família. Rev Saude Publica 2009; 43(4):595-603.
33. Carneiro S. Mulheres em movimento. Estudos Avança-dos 2003; 17(49):117-132.
34. Kerner I. Tudo é interseccional? Sobre a relação entre racismo e sexismo. Novos Estudos 2012; 93:45-58. 35. Bohn SR. Evangélicos no Brasil. Perfil socioeconômico,
afinidades ideológicas e determinantes do comporta-mento eleitoral. Opinião Pública 2004; 10(2):288-338. 36. Prandi R. As religiões afro-brasileiras e seus seguidores.
Civitas 2003; 3(1):15-33.
37. Silva VG. Neopentecostalismo e religiões afro-brasilei-ras: Significados do ataque aos símbolos da herança re-ligiosa africana no Brasil contemporâneo. Mana 2007; 13(1):207-236.
38. Prado MAM, Queiroz IS. A emergência da politização da intimidade na experiência de mulheres usuárias de drogas. Estudos de Psicologia 2012; 17(2):305-312. 39. Deslandes SF, Gomes R, Silva CMFP. Caracterização
dos casos de violência doméstica contra a mulher aten-didos em dois hospitais públicos do Rio de Janeiro. Cad
Saude Publica 2000; 16(1):129-137.
40. Recio P, Cuadrado I, Ramos E. Propiedades psicométri-cas de la Escala de Detección de Sexismo en Adolescen-tes (DSA). Psicothema 2007; 19(3):522-528.
41. Fernández ML, Castro YR. Evaluación del sexismo am-bivalente en estudiantes gallegos/as. Acción psicológica
2003; 2(2):131-136.
42. Schramm FR. Bioética da Proteção: ferramenta válida para enfrentar problemas morais na era da globaliza-ção. Revista Bioética 2008; 16(1):11-23.
Article submitted 14/03/2016 Approved 28/02/2017
Final version submitted 02/03/2017
This is an Open Access article distributed under the terms of the Creative Commons Attribution License BY