DEPARTAMENTO DE QUÍMICA
PROGRAMA DE PÓS-GRADUAÇÃO EM QUÍMICA
Compósitos nanoestruturados baseados em polímero
condutor/cerâmica como plataforma sensorial para
detecção de gás amônia
Rafaela da Silveira Andre*
Orientador: Dr. Luiz Henrique Capparelli Mattoso
*Bolsista: CNPq
São Carlos, SP
2017
DEPARTAMENTO DE QUÍMICA
PROGRAMA DE PÓS-GRADUAÇÃO EM QUÍMICA
Nanostructured composites based on conducting
polymer/ceramic as a sensing platform for ammonia gas
monitoring
Rafaela da Silveira Andre*
Advisor: Dr. Luiz Henrique Capparelli Mattoso
*Scholarship: CNPq
São Carlos, SP
2017
AGRADECIMENTOS
Gostaria de agradecer primeiramente ao Dr. Luiz H. C. Mattoso pela orientação, confiança e suporte.
Ao Dr. Daniel S. Correa por todo aprendizado proporcionado, oportunidades concedidas, colaboração e atenção ao longo destes anos de coorientação.
Agradeço à Drª. Elaine C. Paris pelas contribuições, conselhos e suporte principalmente no início do desenvolvimento deste trabalho.
Aos membros da banca pela disposição e contribuições.
A todos os colaboradores e parceiros dos artigos aqui presentes.
Aos doutores Flávio Makoto Shimizo, Luiza A. Mercante, Adriana Pavinatto e Rafaela Sanfelice por todo apoio, suporte, parceria e amizade.
A todos os colegas de grupo de pesquisa que também contribuíram para a realização deste trabalho.
À Embrapa Instrumentação pela estrutura fornecida para o desenvolvimento deste trabalho. Em especial ao pessoal de suporte à pesquisa, Adriana, Viviane, Silviane, Matteo, Paulinho, Edilson Gabriel e Suzane.
Aos órgãos de fomento (CNPq, CAPES e FAPESP) por todo o suporte financeiro.
Ao Programa de Pós-Graduação em Química da Universidade Federal de São Carlos (PPGQ-UFSCar), por toda a estrutura oferecida.
Gostaria também de agradecer a todos os meus amigos por estarem sempre ao meu lado fazendo a minha vida mais doce.
Em especial, agradeço ao Lucas por seu companheirismo, amor, amizade e apoio incondicional recheados de alegrias e momentos inesquecíveis.
RESUMO
COMPÓSITOS NANOESTRUTURADOS BASEADOS EM POLÍMERO
ABSTRACT
LIST OF FIGURES
FIGURE 1.1.1: Composite reinforcement types. (Figure available in
Eyring et. al.
3) ... 2
FIGURE 1.2.1: Scheme of common (nano)composite structures for
ceramic materials (a) nanoparticles occupying both inter- and
intra-granular positions inside a micronic matrix; (b) elongated
nanoreinforcements embedded in a micronic matrix; (c) platelet-like
nanoreinforcements embedded in a micronic matrix; (d) containing both
rounded and elongated nanoreinforcements, embedded in a micronic
matrix; (e) Bi-phasic composite made by two immiscible ultra-fine
phases; (f) Multi-phasic composite made by three (or more) immiscible.
(Figure available in Palmero et. al.
28) ... 3
Figure 1.3.1: Electrospinning fiber formation scheme (Figure adapted
from Costa et. al.
50). ... 6
Figure 1.3.2: Schematic Layer-by-Layer (LbL) self- assembly technique.
(Figure adapted from Correa et. al.
60) ... 7
FIGURE 1.4.1: Nanocomposites classification based on their
applications. (Figure idealized from Sahay et. al.
72) ... 8
Figure 1.4.2: Schematic representation of the p-n energy levels a) before
and b) after a heterojunction formation. ... 11
FIGURE 3.4.1: XRD patterns of ZnO synthetized with (a) PEG 8000, (b)
PEG 4000 and (c) PEG 400. (Figure available in Andre, R. S. et. al.
127) 22
FIGURE 3.4.2: FEG-SEM images of ZnO synthetized with (a) PEG 8000,
(b) PEG 4000 e (c) PEG 400. (d) Histogram of size distribution of ZnO
nanoparticles synthetized with PEG 400. (Figure available in Andre, R.
S. et. al.
127) ... 23
FIGURE 3.4.4: TGA curves of ZnO nanoparticles, PA6/PANI nanofibers
and PA6/PANI_ZnO nanofibers. (Figure available in Andre, R. S. et.
al.
127) ... 25
FIGURE 3.4.5: (a) EIS of PA6/PANI_ZnO electrode for different ZnO
adsorption times (b) EIS of bare FTO, PA6/PANI and PA6/PANI_ZnO
electrodes in 5 mmol L
-1[Fe(CN)
6
]
-3/-4solution with 0.1 mol L
-1KCl. The
inset in panel b (i) shows the Randle’s equivalent circuit model. (Figure
available in Andre, R. S. et. al.
127)... 27
FIGURE 3.4.6: Amperometric current response of PA6/PANI_ZnO
electrode in 0.01 molL-1 PBS (pH 7.5) for concentration range 0.5 to
20000 μmolL
-1 of Hy. The inset presents the linear relationship between
current response and Hy concentrations. (Figure available in Andre, R.
S. et. al.
127) ... 29
FIGURE 3.4.7: Selectivity amperometric current response of the
PA6/PANI_ZnO sensor for Hy (N
2H
4) mixed with interferents in 0.01 mol
L
-1PBS (pH 7,5). (Figure available in Andre, R. S. et. al.
127) ... 30
FIGURE 4.3.1: Schematic diagram of the experimental setup for NH
3detection. (Figure available in Andre, R. S. et. al.
174) ... 35
FIGURE 4.4.1: Absorption spectra of LbL films (PGPZ2T, PGPZ3T and
PGPZ4T). Inset displays the intensity at 840 nm versus the number of
deposited tetralayers. (Figure available in Andre, R. S. et. al.
174)... 36
FIGURE 4.4.2: Raman spectrum of PGPZ4T film. (Figure available in
Andre, R. S. et. al.
174) ... 36
FIGURE 4.4.3: a
) real part of impedance (Z’) and b) Nyquist diagram for
PGPZ2T, PGPZ3T and PGPZ4T films, c) equivalent circuit model and d)
schematic representation of the PANI/GO/PANI/ZnO film deposited onto
the IDE. (Figure available in Andre, R. S. et. al.
174) ... 37
FIGURE 4.4.5: Film roughness (Rrms) calculated using Gwyddion®
software for LbL films (PGPZ2T, PGPZ3T and PGPZ4T) before and after
exposure to ammonia gas. (Figure available in Andre, R. S. et. al.
174) .. 39
FIGURE 4.4.6: a) Sensor responses at different concentrations of NH3
and b) change in electrical resistance as a function of time upon NH3
exposure of a sensing device with PGPZ3T. (Figure available in Andre,
R. S. et. al.
174) ... 41
FIGURE 4.4.7: IDMAP plot obtained with the real component of the
impedance data as a function of frequency for PGPZ2T, PGPZ3T and
PGPZ4T films. The axes have no labels because what matters in this
type of plot is the relative distance between data points. The dashed
lines linking data points for each of the sensing units were only included
to guide the eyes, and demonstrate the distinction between different NH
3concentrations. (Figure available in Andre, R. S. et. al.
174) ... 42
Figure 5.3.1: X-ray diffraction pattern of the as-prepared ZnO nanofibers.
... 49
Figure 5.3.2: a) Scanning electron microscopy picture of ZnO nanofibers,
b) higher magnification and c) a Histogram of diameter size distribution
of ZnONF... 50
Figure 5.3.3: The high-resolution XPS spectra of a) Zn2p and b) O1s of
ZnO_NF. ... 51
Figure 5.3.4: a) Response-recovery profile of ZnO50/PSS50 device as
function of time for NH
3concentration varying from 10 to 100 ppm and b)
Sensing response as function of NH
3concentration for ZnO50/PSS50
and PZnO devices. ... 52
Figure 5.3.5: Selectivity performance for 50 ppm of NO
2, NH
3and CO for
Figure 5.3.6: FTIR spectra of a) glass microfiber paper (GFP), b)
GFP@PANI, c) GFP@PANI/PSS, d) GFP@PSS/PANI and e)
GFP@PSS, respectively. ... 55
Figure 5.3.7: Scanning electron microscopy images of a) GFP substrate
and b) GFP@PSS/PANI device. The inset represents i) real device
picture and ii) real device mechanical flexibility. ... 55
Figure 5.3.8: Dynamic response of a) GF@PSS/PANI, b)
GFP@PANI/PSS and c) GFP@PANI. The inset shows the I-V curves of
different device performed in ambient air conditions. ... 56
Figure 5.3.9: Gas sensor a) response for different concentrations of NH
3gas and b) selectivity test for ammonia sensing towards NO
2and CO
gas. ... 58
Figure A.1: a) Capacitance and b) Resistance variation versus frequency
for all three platforms. ... 76
Figure A.2 a) Real part of dielectric properties and b) tangent loss for all
three platforms. ... 76
Figure A.3: Nyquist plots of a) PGPZ2T, b) PGPZ3T and PGPZ4T when
exposed in several concentrations of NH
3. ... 77
Figure A.4: Impedance spectra of a) PGPZ2T, b) PGPZ3T and c)
PGPZ4T film when exposed in several concentrations of NH
3. ... 78
Table list
TABLE 3.1: Comparison of Linear range and Detection limit between
hydrazine sensors based in similar ZnO structures.
……….
29
TABLE 4.1: Parameters of the equivalent circuit used to fit the
impedance data with ZView® software (Scribner Associates Inc.).
……
38
TABLE 4.2: Comparison of sensor performance for detecting NH
3, where
PUBLICATIONS
1. Andre, R. S.; Shimizu, F. M.; Miyazaki, C. M.; Riul, A.; Manzani, D.; Ribeiro, S. J. L.; Oliveira, O. N.; Mattoso, L. H. C.; Correa, D. S. Hybrid Layer-by-Layer (LbL) Films of Polyaniline, Graphene Oxide and Zinc Oxide to Detect Ammonia. Sensors Actuators B Chem.2017, 238, 795–801.
2. Andre, R. S.; Pavinatto, A.; Mercante, L. a.; Paris, E. C.; Mattoso, L. H. C.; Correa, D. S. Improving the Electrochemical Properties of Polyamide 6/polyaniline Electrospun Nanofibers by Surface Modification with ZnO Nanoparticles. RSC Adv.2015, 5 (90), 73875–73881.
OTHER PUBLICATIONS
1. ANDRÉ, Rafaela. S.; ZANETTI, S.M.; VARELA, J.A.; LONGO, Elson
Synthesis by a chemical method and characterization of CaZrO3 powders:
Potential application as humidity sensors. Ceram. Int. 2014,40, 16627-16634.
2. André, R.S.; Paris, E.C.; Gurgel, M.F.C.; Rosa, I.L.V.; Paiva Santos, C.O.; Li, M.S.; Varela, J.A.; Longo, E. Structural evolution of Eudoped hydroxyapatite
nanorods monitored by photoluminescence emission. J. Alloys Compd. 2012,
531, 50-54.
3. ANDRÉ, RAFAELA S.; ZAMPERINI, CAMILA A.; MIMA, EWERTON G.;
LONGO, VALÉRIA M.; ALBUQUERQUE, ANDERSON R.; SAMBRANO, JÚLIO R.; MACHADO, ANA L.; VERGANI, CARLOS E.; HERNANDES,
ANTONIO C.; VARELA, JOSÉ A.; LONGO, E. Antimicrobial activity of TiO2:Ag
nanocrystalline heterostructures: Experimental and theoretical insights.
Chemical Physics. 2015, 459, 87-95.
4. ZAMPERINI, C. A.; ANDRÉ, R. S.; LONGO, V. M.; MIMA, E. G.; VERGANI, C. E.; MACHADO, A. L.; VARELA, J. A.; Longo, E. Antifungal Applications of Ag
Decorated Hydroxyapatite Nanoparticles. Journal of Nanomaterials (Print).
2013, 2013, 1-9.
5. ROSA, I. L. V.; OLIVEIRA, M.C.; ASSIS, M.; FERRER, M.; ANDRÉ, Rafaela.
S.; LONGO, E.; Gurgel, M.F.C. A theoretical investigation of the structural and
electronic properties of orthorhombic CaZrO3. Ceram. Int. 2015, 41,
3069-3074.
6. MAZZO, TATIANA MARTELLI; MENDONÇA DA ROCHA OLIVEIRA, LUCAS; MACARIO, LEILANE ROBERTA; AVANSI, WALDIR; SILVEIRA ANDRÉ, RAFAELA DA; VIANA ROSA, IEDA LUCIA; VARELA, JOSÉ ARANA;
LONGO, ELSON; Photoluminescence properties of CaTiO3:Eu3+
nanophosphor obtained by the polymeric precursor method. Mater. Chem. Phys. 2014, 145, 141-150.
7. LONGO, VALÉRIA MORAES; DE FOGGI, CAMILA C.; FERRER, MATEUS MENEGHETTI; GOUVEIA, AMANDA F.; ANDRÉ, RAFAELA S.; AVANSI, WALDIR; VERGANI, CARLOS E.; MACHADO, ANA L.; ANDRÉS, JUAN;
CAVALCANTE, LAÉCIO SANTOS; HERNANDES, ANTONIO; LONGO, ELSON; Potentiated Electron Transference in αAg2WO4 Microcrystals with Ag
Nanofilaments as Microbial Agent. J. Phys. Chem. A. 2014, 118 (31), 5769–
Summary
AGRADECIMENTOS ... v
RESUMO... vi
ABSTRACT ... vii
LIST OF FIGURES ... viii
Table list ... xii
PUBLICATIONS ... xiii
1. Introduction ... 1
1.1 Composite Materials ... 1
1.2. Nanocomposites ... 2
1.3. Nanocomposite fabrication techniques ... 4
1.4. Nanocomposite application ... 8
1.5. The ammonia gas problem ... 12
2. Goals and Overview ... 14
3. Polymeric nanofibers decorated with inorganic nanoparticles* ... 16
3.1. Abstract ... 17
3.2. Introduction ... 17
3.3. Materials and Methods ... 19
3.4. Results and Discussions ... 21
3.5. Conclusions ... 30
4. Organic/inorganic Layer-by-Layer platform deposition* ... 31
4.1. Abstract ... 32
4.2. Introduction ... 32
4.3. Experimental ... 33
4.4. Results and discussion ... 35
4.5. Conclusions ... 44
5. Ceramic nanofibers and polymeric coated paper
–
Additional Studies*
45
5.1. Introduction ... 46
5.2. Experimental ... 46
5.3. Results and discussion ... 49
6. General Conclusions and Future perspectives ... 60
7. References ... 61
Appendix A ... 76
1.
Introduction
1.1 Composite Materials
The first composite materials obtained by men date back to ancient Egypt and were related to straw and mud combination to obtain bricks1 with good compressive
strength (mud property) and good tensile strength (straw property). In the following centuries, civil construction advanced the use of concrete, also classified as composite material2, as an important mark. A composite material is any material made up by two
or more constituent materials sharing a clear interface. Usually, the combined materials present very different properties and their combination in one single material will result in a composite with unique properties. The constituent material can be classified as matrix, which is the continuous and often in larger amounts, or as reinforcement, present in lower concentration. The matrix surrounds and supports the reinforcement, which will impose its special properties to enhance the matrix properties. The reinforcement may consist of particles (yielding particle reinforced composite), fibers and whiskers and fabrics (yielding fiber reinforced composite) as represented in Fig. 1.1.1. Fiber reinforcement may yet consist of continuous and aligned fibers, discontinuous and aligned or discontinuous and randomly oriented fibers3. The synergy
between matrix and reinforcement will produce unprecedented properties when compared to the raw materials4.
The careful choice of the matrix and reinforcement materials will drive the synergistic effect on the composite material guiding the resulting properties to meet the right requirements for a specific application. Usually, the type of matrix material is used to classify the composite. Metal matrix composites (MMCs) and ceramic matrix composites (CMCs) are classified as inorganic composite combined with ceramic reinforcement5–9. Composites based on polymer matrix (PMCs) and reinforcements,
which provides high strength and stiffness, are classified as organic composites, and according with their mechanical properties level they are divided in reinforced plastics or advanced composites10–12. Originally, the main applications of composite materials
airplane structure and sports equipment14. The new generation of composite materials
is based on carbon nanotubes, which are even lighter and stronger, but still presenting a few drawbacks including the difficulty for dispersion, matrix compatibility and high costs to be employed in industrial scale. The new generation of composite materials extended the application field beyond the mechanical properties through electrical, magnetic and optical properties15–18. Known as advanced composites, they are a
younger class of materials with properties not only dependent on the matrix and reinforcement constituents, but also on the relative proportion, size of the particle reinforcement and on the nature of the interactions that will lead the interface connections. For instance, sensors, biosensors, catalysts, or even multifunctional and smart materials with superior performance can be obtained using advanced composites19–23.
FIGURE 1.1.1: Composite reinforcement types. (Figure available in Eyring et. al.3)
1.2. Nanocomposites
compared to the same material in the micro- and macroscale due to the quantum confinement effects and extremely high surface area24–26. Therefore, when
nanomaterials are employed as a filler material in nanocomposites, the interfacial area or interphase surface area will be proportional to the nanomaterial surface area and the nanocomposite properties ruled by the dominant interactions on the interface27,28. For
PMNCs, the nanofillers as reinforcement are commonly employed to improve the melt strength and viscosity properties in recycled polymers. When compared to micro sized fillers, a smaller amount of nanofiller is sufficient to achieve excellent properties without reducing the light transmission properties of the polymeric matrix, neither substantially increasing the density and cost of the PMNC29. Another goal of PMNCs is the
production of fire retardant30. The inorganic nanometric reinforcement, especially in
exfoliated nanoplatelets shape, can act as a protective barrier and also increase the melting viscosity, enhancing the nanocomposite structural stability at high temperatures31–33. In the case of CMNCs with matrix particles in the micron sized scale
and reinforcement in the nano sized scale, the nanofiller can occupy both inter- and intra-granular positions and will be able to limit the matrix grain growth, enhancing the hardness and strength properties34. When combined in similar volume fractions, matrix
and reinforced constituents will form interconnected structures hindering the growth of each other.
composite made by two immiscible ultra-fine phases; (f) Multi-phasic composite made by three (or more) immiscible. (Figure available in Palmero et. al. 28)
1.3. Nanocomposite fabrication techniques
Three main methods have been adopted for polymer-based nanocomposites preparation, as follows: i) nanocomposite constituent’s solution mixture; ii) polymer melt intercalation and iii) in situ polymerization. A combination of two or more methods may also be useful in the polymer-based nanocomposite fabrication.
In polymer melt intercalation method, the nanometric reinforcement is mixed with the molten polymer. Intercalated or exfoliated nanocomposites are generally obtained if there is a great compatibility between the filler and the matrix within suitable processing conditions35. Often a third component must be added to promote better compatibility
between the matrix and the reinforcement constituent36,37. Nanocomposites production
by polymer melt intercalation method has several advantages, such as the relative simplicity of the process, large-scale production and the absence of organic solvents that can be harmful to the environment.
For in situ polymerization process, the reinforcement is dispersed in a solution of
the polymer monomer. The monomer is expected to penetrate the intermolecular space, causing its delamination. A good affinity between the constituent phases is essential for a homogeneous dispersion of the system. The polymerization process is then started. It is important that the all or part of the polymerization occurs within the filler so the exfoliation takes place by the growth of the polymer chains within the interlamellar space, allowing a greater dispersion of the nanometric reinforcement. This method is very good for core-shell nanocomposite and coated nanomaterials preparation. Since it occurs in situ, there is no limitation for the matrix geometry.
polymer chains are entrapped between the reinforcing particles forming multilayer structures. The solution mixture process allows the fabrication of different platforms conformed in specific shape, including nanofibers obtained by electrospinning technique and thin films obtained by Layer-by-Layer technique38–40.
Electrospinning technique
Electrospinning is a fiber fabrication technique capable of producing functional nanofibers for varied applications41–46, and is usually composed by a high voltage
supply, an ejection pump and a syringe as polymeric solution/melted polymer container. In this technique, a droplet of the polymer solution contained in the tip of the spinneret is submitted to a high electrical voltage. In this situation, the drop experiences a repulsive electrostatic force that overcomes the surface tension forces, drawing charged threads from the Taylor cone tip, yielding to the fiber47 formation. Parameters such as solution
viscosity, chains entanglement, electrical conductivity and surface tension directly influence the morphologies and geometry of nanofibers. The solution stretching is affected by parameters including solution viscosity and electrical potential, which should be properly selected allow the production of high quality fibers 48. The jet region is
influenced by bending and whipping instabilities that arise due to the charge-repulsion between the excess of charges present in the jet which favors thinning and elongation of the jet49. While the jet travels between the needle and the collector, the solvent
evaporates producing nanofibers that are deposited on the collector50. The fiber
formation, stabilization and collection is represented in Fig. 1.3.1.
Nanofibers mats are very interesting to be used as polymer matrix in composite materials fabrication, since they present a high surface area and nanometric dimensions51. Although the most traditional application in composite materials for
micro-sized fibers is as structural reinforcement just a few works reported nanofibers as structural reinforcement. Most of researches employing polymeric nanofibers have been devoted to biomedical applications for slow release and cellular scaffold development
52–58. Another possibility is the incorporation of secondary phases to promotes improved
Figure 1.3.1: Electrospinning fiber formation scheme (Figure adapted from Costa et. al.50).
Layer-by-Layer (LbL) technique
Another convenient technique for developing nanocomposite based platforms is the Layer-by-Layer (LbL) technique63. LbL method is an alternative technique to
Langmuir-Blodgett (LB) technique64 for thin film fabrication and it is based on multilayer
covalent primary chemical bonds. However, the self-assembling technique does not provide the polymer chains with a high degree of organization. Srivastava, S. and Kotov, N. A.65 presented an overview about efforts to fabricate high-quality
nanocomposites based polymeric thin films incorporating inorganic nanomaterials, which LbL films assembly merge the properties of each isolated material resulting in functional films. The authors also highlighted the possibility of manipulating this functionality using inorganic nanomaterials with different geometries such as nanoparticles, nanosheets and nanowires according with the desired property.
Figure 1.3.2: Schematic Layer-by-Layer (LbL) self- assembly technique. (Figure adapted from Correa et. al.60)
Finally, for higher quality nanocomposite materials with more attractive properties, two or more methods can be combined. The purpose of combining methods is to take advantage of the individual methods. A good example of combined method for nanocomposites preparation is the fabrication of nanocomposites with high concentration of reinforcement (around 30%) widely used in the plastics industry as color additives. They can be obtained by a combination of solution mixing methods and in situ polymerization. Thus, the ease in prepare exfoliated materials by solution method with the pragmatism and mass production capacity are combined66. Another possibility
A recent work presented by Chen et. al.67 reported the fabrication of a composite based
on polyimide nanofibers membranes as a template to in situ polymerization of
nanosized polyaniline particles . The as-prepared PANI/PI mats not only presented excellent thermal and mechanical properties but also showed good electrical conductivity, pH sensitivity, and significantly improved electromagnetic impedance when compared with non-coated mats.
1.4. Nanocomposite application
Nanocomposite materials have been employed in a wide range of applications including gas barrier, photovoltaic cells, heat exchangers, optically transparent functional nanocomposite material, filtration systems, medical prostheses, tissue template, drug delivery matrix, optoelectronics, catalysis, and electrical and optical sensor applications18,68–71 such reported by Sahay et. al.72 as illustrated in Fig. 1.4.1.
Nanocomposites for gas sensing application
In the last few years’ great efforts have been made for developing sensitive and selective gas sensors in order to monitor environmental pollution, industrial and public safety and non-invasive diagnosis20,73–76. Such sensors are intended to detect low
concentrations of gas in the surrounding atmosphere at specific conditions, including under distinct humidity and temperatures levels. Usually, resistive-type metal oxide gas sensors are attractive once they present high sensitivity, low cost and simple operation. However, they present poor selectivity and better performance at high temperatures. Recent studies have reported the improvement of metal oxide gas sensors selectivity using secondary phases to form composite materials77. Mirzaei, A. et. al.78 reported the
greater gas sensitivity for Ag/Fe2O3 core-shell nanocomposite compared with the pure
Fe2O3 semiconductor. Ag metallic nanoparticles was used as filling in Fe2O3 ceramic
matrix. The Fe2O3 shell is showed to be thin enough to allow the chemical and
electronic sensitization of the Ag nanoparticles when in contact with NO2 gas. The
authors proposed two mechanisms for the nanocomposite sensitivity. In the chemical sensitization (CS) mechanism the metallic nanoparticle catalytically activates the dissociation of gas molecules followed by adsorbing on the nanoparticle surface, capturing conductance band electrons. Another mechanism is the electronic sensitization (ES), where they address the metallic nanoparticle sensitivity to their interaction with the semiconductor matrix. Metallic nanoparticle in oxidized state accept the matrix electrons, inducing to a depletion layer on the interface.
In nanocomposites, the combination of constituents with dissimilar types of conductivity, such as p-type and n-type materials, sharing interfaces, can equilibrate the
Fermi levels to the same energy and form a p-n heterojunction. In this scenario, the
charge transfer is improved and allows the formation of a depletion layer followed by the barrier potential build-up. Several studies have related the nanocomposites enhanced properties and superior functional performance with the presence of p-n heterojunction.
concepts for the stages of production, since the synthesis of nanocomposites until their processing.
As mentioned, composites with dissimilar constituent results in a heterojunction with a depletion layer. Therefore, in composite sensors, the detection process occurs through a synergistic reaction where the analyte reacts with the most readily phase, which in turn may react with the secondary constituent giving an improved response. For instance, Narjinary et. al.74 reported the fabrication of low-concentration-acetone
gas sensor for breath analyses to monitor diabetes. The fabricated nanocomposite platform was obtained using MWCNT as substrate for SnO2 nanoparticles and
presented much better performance than pure SnO2 with high sensitivity, stability, fast
response and good resolution. The better performance was attributed to the heterojunction formation and high surface area, which increases the material adsorption capacity. Conducting polymers also have been used as active layer in gas sensors due to their high sensitivities, good mechanical properties and short response time79–81. So,
heterostructure based in conducting polymer are also a good choice for gas sensor applications.
A full comprehension on the heterojunction mechanism and how it influences on the sensor activity is of great value for optimized experiments, saving time and lowering costs. A composite formed by the combination of an organic material (p-type) with an inorganic material (n-type) can be treated as a heterostructure with p-n heterojunctions.
The interaction between both materials and the improved performance of the composite material for sensor applications will be presented for a specific case of a conducting polymer, acting like a p-type material with excess of free positively charge, and an inorganic semiconductor, acting as n-type material with excess of free negative charge. Usually, n-type materials are more used for gas sensing applications than p-type material because n-type material usually show more stability and robustness82,83.
However, a p-type material can play an important role for gas sensing when combined with a n-type material. When materials with a specific Fermi energy level are in contact, the electrons from higher energy levels tends to flow across the interface to free lower-energy levels, equilibrating the Fermi lower-energy for both materials and consequently forming the depletion layer84. After the Fermi levels are equilibrated, a barrier potential
band energy alignment known as straddling heterojunction, staggered heterojunction and broken-gap heterojunction84. Figure 1.4.2 present a staggered heterojunction
combination and the respective depletion layer formation.
Figure 1.4.2: Schematic representation of the p-n energy levels a) before and b) after a heterojunction formation
.
The barrier potential formation will hinder the electron transfer, making necessary to overcome this energy barrier. Considering a hypothetical n-type material in air, the resistance will be higher for the pure material than for the composite material due to the presence of a depletion layer in the last one. The exposure of this composite material to oxidizing and reducing gases will reflect in a resistance variation for higher or lower values according to the availability of free electrons85,86. Once the resistance variation
1.5. The ammonia gas problem
Brazil has established itself as one of the world's largest food producers, including chicken livestock production. Although this activity generates employment, income and food for the population, there is a strong concern regarding the quality of the environment in poultry farms, especially related to ammonia emissions. In poultry farms, ammonia is formed from the microbial decomposition of uric acid (nitrogen compound) wasted by poultry and its emission is dependent on high temperature, pH variation, humidity, type of material used for bed and its handling87–91. Chicken litter is
the product resulting from the accumulation of poultry manure, feathers and food wasted on the material used as flooring (rice husks or peanuts, corn cob, wood shavings, paper, etc.). The chicken bed is the only basic byproduct of commercial poultry, that is, it can be marketed for purposes of organic fertilization (natural fertilizer). This material present high levels of nitrogen, phosphorus and potassium and has traditionally been used as a source of nutrients for vegetable crops and in the improvement of soil physical, chemical and biological conditions92. However, the
ammonia released from the chicken waste affects animal and human health as it is irritant to the mucous membranes of the eyes and respiratory tract, which predisposes the entry of several disease agents93–95. High levels of ammonia can be observed at the
beginning of breeding in sheds that reuse the bed92.
The levels of ammonia up to 50 ppm cannot be perceived as harmful, because the human sense of smell does not detect the presence of ammonia at levels below 20 ppm88,96. In addition, humans lose their olfactory sensitivity after long or repeated
exposures to the same odor. In this way, workers are affected long before the problem can be identified. From 50 to 100 ppm, ammonia can be inhaled without major consequences. From 100 to 200 ppm, ammonia induces drowsiness, salivation and loss of the appetite. In many countries, the ammonia concentration leves are limited to 25 ppm in a period of 8 h / day of work and for short periods of exposure this level increases to 35 ppm97. In Sweden, the worker's maximum level allowed is 10 ppm. In
2. Goals and Overview
The general goal of this thesis was to develop nanostructured ammonia gas sensors using different platforms based on distinct composite materials (ZnO nanoparticles, graphene oxide, conducting polymers and polyelectrolyte polymer), and to study the adsorption interaction between ammonia gas molecules and the sensing layer material. Since the referred interaction is the key for the development of new ammonia sensor with remarkable sensibility and selectivity aiming environmental safety for humans and animals in critical sites.
Specific goals:
✓ Optimization of the synthesis conditions to obtain ZnO as dispersed nanoparticles and ceramic nanofibers;
✓ Optimization of the synthesis conditions to obtain Layer-by-Layer and electrospinning platform based on the ZnO nanoparticles, previously obtained and conducting polymers;
✓ Investigation of the performance of the ammonia sensors and the sensing mechanism based on the interaction of ammonia molecules with the developed platforms.
Chapters Overview
The main idea of this thesis was to explore the sensing properties of different material combination, as composite materials, in distinct sensing platforms configuration, with the purpose of detecting ammonia in low concentrations. The materials choice for combination was based on the improvement of the charge transfer effect.
carcinogenic contaminant with chemical composition very close to ammonia. main results are presented in Chapter I and indicate that the novel sensing platform can be potentially harnessed for electrochemical sensors and biosensors applications.
The second platform was based on the fabrication of Layer-by-Layer architecture composed by polyaniline, graphene oxide and ZnO in tetralayer configuration deposited onto gold interdigitated electrodes. Impedance spectroscopy was employed as sensing technique and useful information was obtained by investigating the charge transfer process on the platform when exposed to ammonia gas. The main results are presented in Chapter II.
A third device was obtained based on ZnO ceramic nanofibers coated with Poly(styrene sulphonic Acid) (PSS) which were deposited on coated in gold interdigitated electrode..
Finally, a fourth platform was obtained based on a glass fiber paper coated with polyaniline layer by in situ polymerization, aiming the development of a low cost, flexible
and disposable device for ammonia detection in low concentrations at room temperature.
3.
Polymeric nanofibers decorated with inorganic nanoparticles
*
*
The content of this chapter is an adaptation of thearticle entitled: “Improving the electrochemical properties of polyamide 6/polyaniline electrospun nanofibers by surface modification with ZnO nanoparticles” by R. S. Andre, A. Pavinatto, L. A. Mercante, Elaine C. Paris, Luiz H. C. Mattoso and Daniel S. Correa, published in RSC Advances Journal.
Reference: RSC Adv. 2015, 5 (90),
3.1. Abstract
Heterostructured nanomaterials have attracted increasing interest because of their novel and distinct optical and electrical properties, finding applications in devices and chemical sensors. Here we report a new electrochemical platform based on the modification of fluorine doped tin oxide (FTO) electrode with polyamide 6/polyaniline (PA6/PANI) electrospun nanofibers decorated with ZnO nanoparticles. The nanoparticles were synthesized by co-precipitation method, followed by hydrothermal treatment, which route was optimized in order to obtain particles of small average diameter (45 nm). Polymeric nanofibers were obtained by the electrospinning technique and further subjected to the ZnO modification by nanoparticle impregnation. SEM images confirmed the uniform distribution of ZnO nanoparticles adsorbed onto the nanofibers surface, which amount was estimated to be 4% w/w, according to thermal gravimetric analysis (TGA). According to the electrochemical characterization, an improvement in electron transfer kinetic and increase in electroactive area was observed for the ZnO-modified electrode. As a proof of principle, the modified electrode
was employed for monitoring hydrazine, and yielded a detection limit of 0.35 μmol L-1.
Our results indicate that the novel sensing platform based on the adsorption of ZnO nanoparticles onto the surface of electrospun nanofibers can be potentially harnessed for electrochemical sensors and biosensors applications.
3.2. Introduction
Organic-inorganic hybrid materials have attracted increasing attention due to their potential application in different areas, including optics and electronics.98,99 In most
cases, the combination of organic and inorganic materials can yield a high-performance hybrid material with synergistic behaviors or complementary properties between the polymer and the inorganic component.100–104 In fact, the combination of polymers and
inorganic nanoparticles displays advantageous electrical, optical and mechanical properties, finding applications in opto-electronic devices and also as catalyst, which depends directly on the choice of the organic and inorganic component.62,105
Various techniques have been developed to fabricate 1D nanostructures, including the electrospinning technique, which is a versatile and low-cost method that can produce large specific surface area nanofibers.44,72 This relatively huge surface area can
potentially provide ultra-high sensitivity and fast response time for sensing applications.61,106–109 In particular, electrospun nanofibers containing conductive
polymer such as polyaniline (PANI) have attracted even more interest because of their high conductivity and potential applications in electrochemical devices.110 In order to
improve their properties and to construct multifunctional hybrid nanostructures, more recently considerable efforts have been directed towards attaching metallic and oxide NPs onto electrospun nanofibers.111,112
Zinc oxide (ZnO) is a versatile n-type metal oxide semiconductor with a wide band gap (3.36-3.39 eV) at room temperature, and present appealing features such as biocompatibility, nontoxicity and inexpensiveness.113 It has been extensively used in the
fabrication of electronic and optical devices, heterogeneous catalysis and gas sensing114. Furthermore, ZnO can be employed to facilitate the charge transfer and
enhance the electrochemical activity.115 Therefore, functionalizing electrospun
nanofibers with NPs in order to combine the conductivity of the polymeric phase (PANI) and the high surface area of the nanofibers with the unique properties of ZnO NPs, can become an important strategy for the development of new electrochemical platforms.
electrochemical measurements. The hydrazine sensor showed a linear range from 0.5 to 5000 mmol L-1 and a detection limit of 0.35 mM.
3.3. Materials and Methods
3.3.1. Materials
Polyamide 6 (PA6, Mw = 20 000 g mol-1), polyaniline (PANI, Mw = 20 000 g mol -1), zinc nitrate hexahydrate, Polyethylene glycol (PEG400, Mw = 380-420 g mol-1; PEG
4000, Mw = 3600-4400 g mol-1; PEG8000, Mw = 7000-9000 g mol-1) were all purchased
from Sigma-Aldrich. Potassium hydroxide and formic acid were purchased from Synth Chemical (São Paulo, Brazil). The dispersing agent, Liosperse 511, was purchased from Miracema-Nuodex (Campinas, Brazil).
3.3.2. Synthesis of ZnO nanoparticles
ZnO synthesis was carried out by coprecipitation method followed by hydrothermal treatment at 150°C for 1 hour.116 Initially, zinc nitrate and potassium
hydroxide were separately dissolved in deionized water (0,05 mol L-1 and 2 mol L-1,
respectively) under vigorously stirring. PEG solution (0,1 mol L-1) was added into the
zinc nitrate solution for each synthesis and stirred for 30 minutes. Subsequently, potassium hydroxide solution was slowly added until pH 14 was reached. The suspension containing the white solid precipitate was then submitted to the hydrothermal treatment. The suspension was heated up at a rate of 10°C/min under constant pressure (approximately 3.0 bar) until 150°C and maintained at this temperature for 1 hour. Finally, the white solid was washed with deionized water several times until the pH became neutral and then dried in an oven.
3.3.3. Electrospinning of PA6 and PA6/PANI nanofibers
PA6/PANI solution was prepared by dissolving 20% (w/v) PA6 and 1% (w/w) PANI in formic acid and stirred for 5h at room temperature. The electrospun nanofibers were obtained by using an electrospinning apparatus at a feed rate of 0.01 mL h-1 and
and the metallic collector. The inner diameter of the steel needle was 1.2 mm. The produced nanofibers were directly electrospun onto fluorine doped tin oxide (FTO) glass substrates to obtain the modified electrodes. The substrates were attached to the collector at the same position in all experiments with an optimal collection time of 10 min. Control of the experimental conditions was crucial to ensure reproducibility because both the diameter and length of nanofibers depend on the collecting time and other experimental parameters.
3.3.4. Adsorption of ZnO nanoparticles onto the electrospun nanofibers
ZnO nanoparticles (1 mg mL-1) were dispersed in distilled water containing 0.5%
(w/w) of Liosperse 511. Ultrasonication at 20 kHz for 5 min was then applied for the dispersion of the nanoparticles. After de dispersion, the electrospun nanofibers were immersed into the ZnO solution, rinsed with distilled water and dried under ambient conditions. Three different adsorption times were tested (12, 24 and 48 h) in order to determine the best electrochemical response.
3.3.5. Physico-chemical Characterization
As-prepared samples of ZnO nanostructures were characterized by X-ray diffraction (XRD) using a Shimadzu, XRD-6000 diffractometer at 30 kV and 30 mA with
Cu Kα radiation. Morphology and size characterizations were performed by field
emission gun scanning electron microscopy (FEG-SEM) (JEOL, JSM 6510). The morphology of the fibers was evaluated using a scanning electron microscope (SEM, JEOL 6510) operating at 10 kV, and the nanoparticles diameter was estimated by using an image analysis software (Image J, National Institutes of Health, USA). In each experiment, the average nanoparticles diameter and distribution were determined by measuring 100 random particles using representative micrographs. To estimate the amount of ZnO nanoparticles adsorbed onto the nanofiber surface, thermal gravimetric analysis (TGA) was performed using a thermogravimetric analyzer (Q500 TA
Instruments) under nitrogen atmosphere, at a flow rate of 20 ml min−1. Samples in
3.3.6. Electrochemical Characterization
The electrochemical characterization experiments were carried out using a PGSTAT30 Autolab electrochemical system (Metrohm) controlled with GPES software using a 0.05 mol L-1 [Fe(CN)6]3-/4- containing 0.1 mol L-1 KCl. The
nanofibers-modified-FTO electrodes were used as working electrodes. A Pt foil and Ag/AgCl (3 mol L-1 KCl)
electrodes served as the counter and reference electrodes, respectively. Cyclic voltammetry (CV) measurements were performed over a potential range from 0.2 to 0.6 V at a scan rate of 100 mV s−1 and electrochemical impedance spectroscopy (EIS)
measurements were carried at a potential of 0.3 V over the frequency range from 0.1 Hz to 100 kHz, using an amplitude of 10 mV.
3.4. Results and Discussions
3.4.1. Characterization of ZnO nanoparticles
Different molar weight PEGs were employed to optimize ZnO synthesis in order to obtain nanoparticles with suitable shape and size for impregnation onto the polymeric electrospun nanofibers. The long-range order of ZnO samples was deter- mined by X-rays diffraction. Fig. 3.4.1 shows XRD patterns of ZnO synthetized using (a) PEG 8000, (b) PEG 4000 and (c) PEG 400. All samples present the same diffraction peaks, which are attributed to polycrystalline ZnO. The pattern is typical of the ordered hexagonal wurtzite phase according to JCPDS Card no. 36-1451. Diffraction peaks related to secondary phases were not found, indicating that ZnO without impurities was successfully obtained for the three different molar weight PEGs tested.
Using PEGs with high molecular weight (PEG 8000 and PEG 4000), agglomerated nanoparticles with a nearly spherical morphology and polydisperse nature were obtained (see Fig. 3.4.2a and b). In hydrothermal conditions, the solubility of amorphous particles is significantly increased and crystallization can occur concurrently with redissolving and reprecipitation processes.120,121 After the nucleation process, the
increased particle solubility could result in growth of an individual nanostructure aggregation and/or coarsening.116,122,123 PEG 8000 and PEG 4000 were not very
efficient as surfactants, yielding shapeless and large grain originated from random aggregation process between small particles. Thus, our results indicate that the use of PEG surfactant with longer hydrophobic chains leads to nanoparticles with larger sizes.124 On the other hand, PEG 400 a hydrophobic surfactant with shorter molecular
chain, yielded nanoparticles (see Fig. 3.4.2c) of low dispersion with homogeneous distribution and smaller size (44 nm), adjusted by lognormal fit, as shown in histogram of Fig. 3.4.2d, configuring the best- optimized process and the choice for the subsequent studies.
FIGURE 3.4.2: FEG-SEM images of ZnO synthetized with (a) PEG 8000, (b) PEG 4000 e (c) PEG 400. (d) Histogram of size distribution of ZnO nanoparticles synthetized with PEG 400. (Figure available in Andre, R. S. et. al.125)
3.4.2. Characterization of PA6/PANI nanofibers
To obtain uniform PA6/PANI electrospun nanofibers, the electrospinning parameters were optimized through variation of the flow rate, applied voltage, polymers concentration, and collection distance. Under the improved experimental parameters, smooth and uniform bead-free nanofibers were obtained with a mean diameter of 78 ± 1 nm, as shown in Fig. 3.4.3a.
PA6/PANI nanofibers was efficiently modified with ZnO nanoparticles, as confirmed by the FEG-SEM image in Fig. 3.4.3b and indicates that the coating on the nanofibers surface appears to be uniform. Moreover, the adsorption was strong since the nanoparticles remained on the nanofibers surface even after a washing process, which consisted of repeated submersion in water. This suggests that the ZnO NPs are not simply lying on the nanofiber surface, but instead, they are attached to the PA6/ PANI nanofibers via H-bonding and electrostatic interaction
The adsorption of ZnO on nanofibers can occur through an interaction between the negatively charged COO– groups from the surfactant Liosperse (based on ammonium polyacrylate) present on the ZnO surface and the positively charged sites from PANI present on the nanofibers.127 H-bonding may take place between the
carboxylic groups (–COOH) of the surfactant and imine nitrogens and/or amine nitrogens of PANI and amide groups from PA6.128 The Energy Dispersive Spectroscopy
(EDS) analysis of the modified PA6/PANI nanofibers was carried out in order to prove the presence of ZnO on the nanofibers surface (inset Fig. 3.4.3b).
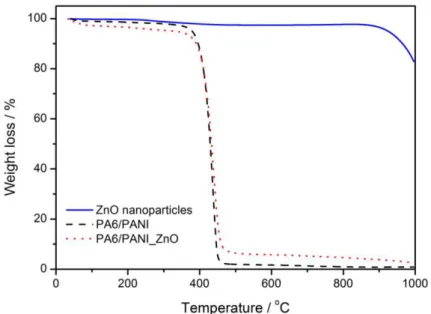
The amount of ZnO nanoparticles adsorbed onto the nanofiber surface was determined by thermal gravimetric analysis (TGA). Figure 3.4.4 shows TGA curves of ZnO nanoparticles (solid line), PA6/PANI (dashed line) and PA6/PANI_ZnO (dotted line) nanofibers. Pure ZnO nanoparticles start to degrade only at 860 oC due its high
temperature stability. Both PA6/PANI and PA6/PANI_ZnO exhibit a substantial weight loss, starting at 380 °C and extending up to 470 oC, resulting in the complete polymer
decomposition. Based on the TGA curve for PA6/PANI_ZnO nanofibers is possible to estimate that the mass loading of nanoparticles on the nanofibers surface is around 4 wt.%.
3.4.3. Electrochemical measurements
ZnO is a metal oxide semiconductor with appealing electrical and optical properties, finding applications in and photovoltaic devices, gas sensing and electrochemical biosensor.114,129,130 As demonstrated by microscopy analyses, ZnO
nanoparticles were successfully adsorbed onto PA6/PANI electrospun nanofibers surface, which suggests a novel and potential platform for sensing application. In order to verify the ZnO influence on the conducting properties of PA6/PANI nanofibers, electrochemical measurements were carried out.
Fig. 3.4.5(a) shows the Nyquist plots for FTO electrode modified with PA6/PANI_ZnO obtained with different ZnO adsorption times. Fig. 3.4.5(b) shows Nyquist plots while (c) displays cyclic voltammograms for bare FTO, and FTO electrodes modified with PA6/PANI and PA6/PANI_ZnO measured in the presence of 5 mmol L-1 [Fe(CN)6]3-/4- in a 0.1 mol L-1 KCl solution at a potential of 0.3 V. The Nyquist
plots obtained for PA6/ PANI_ZnO modified electrode obtained using different ZnO adsorption times (12, 24 and 48 hours) were interpreted using a Randle's equivalent circuit, shown in inset (i) of Fig. 3.4.5b. The Nyquist plot of EIS includes a linear region at low frequency related to the diffusion-limited process, while the semicircular region at high frequencies is related to the electron-transfer- limited process, where the diameter corresponds to the charge (electron) transfer resistance (Rct).115 The highest Rct value (41 Ω) was found to ZnO-modified PA6/PANI nanofibers electrode immersed for 12 hours in ZnO solution, while a similar Rct value of nearly 15 Ω was found for electrodes
immersed for 24 and 48 hours, respectively. The results suggest that the adsorption of ZnO nanoparticles on the PA6/PANI nanofibers tends to reach the saturation in 24 hours, and therefore this was the time chosen for the electrode immersion.
Fig. 3.4.5b presents Nyquist diagrams for FTO, PA6/PANI and PA6/PANI_ZnO electrodes, whose data were again interpreted using the Randle's equivalent circuit (see inset (i)-Fig. 3.4.5b). The Nyquist diagrams yielded a Rct value of 15 Ω for the PA6/PANI_ZnO electrode, while values of 36 Ω and 39 Ω were found for the bare FTO
and PA6/PANI electrodes, respectively. The lowest Rct value for the modified PA6/PANI
FIGURE 3.4.5: (a) EIS of PA6/PANI_ZnO electrode for different ZnO adsorption times (b) EIS of bare FTO, PA6/PANI and PA6/PANI_ZnO electrodes in 5 mmol L-1 [Fe(CN)6] -3/-4 solution with 0.1 mol L-1 KCl. The inset in panel b (i) shows the Randle’s equivalent
circuit model. (Figure available in Andre, R. S. et. al.125)
The voltammograms, displayed in Fig. 3.4.5c, show a quasi-reversible one-electron redox behavior, where Ipa/Ipc ~1, for all electrodes, with increase in anodic peak
current from 479 µA to 585 µA and cathodic peak current from 432 µA to 578 µA, comparing the values for bare FTO and PA6/PANI_ZnO electrode, respectively. Furthermore, the reduction in peak separation (∆Ep) from 190 mV for bare FTO
electrode to 180 mV for PA6/PANI_ZnO modified electrode confirms the faster electron transfer kinetic that is promoted by ZnO nanoparticles. On the other hand, Ipa, Ipc and
∆Ep values for the PA6/PANI electrode voltammograms was found to be 447 µA, 432
voltammograms. The electroactive areas were calculated to be 0.41, 0.37 and 0.49 cm2
for FTO, PA6/PANI and PA6/PANI_ZnO electrodes, respectively. The voltammograms show that the PA6/PANI_ZnO modified electrode displayed an increase in the electroactive area, which helps to enhance the electrochemical performance of the electrode. Therefore, both EIS and voltammograms results suggest that modifying electrodes with ZnO nanoparticles/ polymer nanofibers is a suitable strategy for improving charge-transfer process aiming at chemical sensing applications.
3.4.4.
Electrochemical Detection of Hydrazine (N2H4)In order to prove the potential application of the novel sensing platform, chronoamperometric measurements were employed for hydrazine (Hy) detection. Fig. 3.4.6 shows amperometric response experiments using PA6/PANI_ZnO electrode with successive changes of Hy concentration. The calibration curve was constructed with concentrations ranging from 0.5 to 20 000 mol L-1, and show a linear range following
the equation: I (A) = 0.027 [Hy] (mol L-1) - 0.870 (R2 = 0.994), corresponding to a
concentration range from 0.5 to 5000 mol L-1 (inset). The limit of detection (LOD) was
estimated to be 0.35 mol L-1, based on a signal to noise ratio of 3 (S/N = 3). The
reproducibility of the PA6/PANI_ZnO electrode was tested by performing repeated experiments with solutions containing 50 mol L-1 of Hy. Good reproducibility was
reached for five successive measurements and the relative standard deviation (RSD) was calculated to be 3.5% for a given electrode, while it was found to be 5.5% when three identical electrodes were employed.
The selectivity of PA6/PANI_ZnO electrode for Hy detection was verified by chronoamperometric technique using interfering compounds. The measurements were carried out using 20-fold excess of glucose and 25-fold excess of CaCl2, Zn(NO3)2 and
Cu(NO3)2 in 100 mol L-1 of Hy solution in 0.01 mol L-1 PBS (pH 7.5), which are
considered potential interfering compounds for hydrazine detection.132 The sensing
platform proved to be selective for Hy detection, as displayed in Fig. 3.4.7 with no significant interference in current response from the compounds.
electrode modification) recently reported in the literature (Table 3.1). Our results show that the as-prepared platform is suitable for Hy detection even in the presence of distinct interferents, displaying good specificity and low limit of detection, which prompts it as a promising platform for sensor and biosensor design.
FIGURE 3.4.6: Amperometric current response of PA6/PANI_ZnO electrode in 0.01 molL-1 PBS (pH 7.5) for concentration range 0.5 to 20000 μmolL-1 of Hy. The inset presents the linear relationship between current response and Hy concentrations. (Figure available in Andre, R. S. et. al.125)
FIGURE 3.4.7: Selectivity amperometric current response of the PA6/PANI_ZnO sensor for Hy (N2H4) mixed with interferents in 0.01 mol L-1 PBS (pH 7,5). (Figure available in
Andre, R. S. et. al.125)
3.5. Conclusions
A novel electrochemical platform was successfully fabricated by modifying FTO electrodes with PA6/PANI electrospun nanofibers and further decorating them with ZnO nanoparticles. Our results indicated that the ZnO nanoparticles remained strongly attached to the PA6/PANI nanofibers surface via H-bonding and electrostatic
interaction. Electrochemical measurements revealed improvement in electron transfer kinetic for the ZnO-modified electrode, yielding the lowest Rct value (15 Ω) for the
PA6/PANI_ZnO electrode when compared to bare FTO (36 Ω) and PA6/PANI electrodes (39 Ω), which is beneficial for electrochemical application. Additional
experiments revealed that the novel platform is suitable for monitoring hydrazine in the presence of interfering compounds with a detection limit of 0.35 mol L-1. Ultimately, our
4.
Organic/inorganic Layer-by-Layer platform deposition
*
*
The content of this chapter is an adaptation of thearticle entitled: “Hybrid layer-by-layer (LbL) films of polyaniline, graphene oxide and zinc oxide to detect ammonia” by Rafaela S. Andrea, Flávio M. Shimizu, Celina M. Miyazakid, Antonio Riul Jr, Danilo Manzani, Sidney J.L. Ribeiro, Osvaldo N. Oliveira Jr, Luiz H.C. Mattosoa and Daniel S. Correa, published in Sensors and Actuators B: Chemical.
Reference: Sensors and Actuators B. 2017, 238,
4.1. Abstract
Reliable gas sensors operating at room temperature are in demand for monitoring the environment for hazardous pollutants, such as ammonia (NH3) gas that
may become toxic to humans and animals above a threshold concentration. In this paper, we report on the combination of three materials, namely polyaniline (PANI), graphene oxide (GO) and zinc oxide (ZnO), to produce hybrid layer-by-layer (LbL) films used for sensing NH3 with impedance spectroscopy measurements. The deposition of
tetralayered PANI/GO/PANI/ZnO LbL films was confirmed with UV-vis. absorption and Raman spectroscopies, while atomic force microscopy (AFM) served to investigate film morphology. Exposure of these LbL films to NH3 caused film roughness to vary, in an
effect that depended on the number of tetralayers. Because of synergy in the materials properties, the films with 3 tetralayers were found to be the most adequate for detecting NH3 in the range from 25 ppm to 500 ppm with a response time of 30s. These
figures of merit are adequate for monitoring working environments regarding gas exposure, and highlight the usefulness of the control of film architecture provided by the LbL technique.
4.2. Introduction
Sensitive, reliable gas sensors have great importance in medical applications, air quality supervision and environmental, health and safety monitoring60,95,133–138.
Ammonia is a colourless gas used in many industries, which may become toxic and affect the health of humans and animals, such as in poultry farms93,139. For instance,
100 to 200 ppm of ammonia induce drowsiness, salivation and loss of appetite in humans140,141. According to the regulatory agency in Brazil, the ammonia exposure level
at working places should not exceed 20 ppm within 48 hours/week142, while in England
the ammonia exposure should not exceed 25 ppm in 8 hours143. The human olfactory
limit of detection for ammonia is 55 ppm, but loss of sensitivity occurs after long and repeated exposure.144–146 Therefore, designing robust ammonia sensors with low limits
of detection is highly keen to increase safety and health in such environments147. The
properties, with those exploiting electrical signal variations the most used since stable, reproducible sensors can be fabricated148. In particular, a myriad of materials can be
exploited to achieve such task, including metal oxide semiconductors, conducting polymers, composite materials, carbon nanotubes and their derivatives 136,147,149–153.
In this paper, we report on sensing units made with nanostructured layer-by-layer (LbL) films63,104,108,154–156 containing the semiconducting polyaniline
(PANI), graphene oxide (GO) and zinc oxide (ZnO), all of them already used in sensing applications. The main motivation is rationally combine different materials in a single device originated from a possible synergy of the materials properties. PANI has unique electrical behavior, easy fabrication process and intrinsic redox reaction.38,157–162 ZnO has remarkable semiconducting
properties,163–166 and GO has a porous structure, high surface area and good gas
barrier properties167–169. Different LbL film architectures were tested for NH3
sensing using impedance spectroscopy, which were also characterized using UV-vis absorption spectroscopy, scanning electron microscopy, atomic force microscopy and Raman spectroscopy.
4.3. Experimental
4.3.1. Materials
Polyaniline (PANI, Mw = 20000 g.mol-1) was purchased from
Sigma-Aldrich. ZnO nanoparticles were synthesized using the coprecipitation method followed by hydrothermal treatment at 150°C for 1 h as described in ref.125
Graphene oxide (GO) was prepared by typical Hummers' method170 with a
previous preoxidation step171. The dispersing agent Liosperse 511 was
4.3.2. Preparation of PANI/GO/PANI/ZnO LbL films
PANI solution (1mg/mL) was prepared by dispersing the emeraldine base in 1 mL of dimethylacetamide (DMAc) under stirring for 12 h. The solution was then filtrated using a filter paper (80g/m2 and pores with 8µm) purchased from J Prolab. Next, PANI
solution was mixed with HCl excess (1:9 v:v) at pH = 3.0. GO was dispersed in the same HCl solution in a concentration of 0.1 mg.mL-1 (pH = 3.0). The dispersion of ZnO
nanoparticles (1 mg.mL-1) was prepared using distilled water and the dispersing agent
(0.5% in relation to total volume) (pH = 8.0). Layer-by Layer (LbL) films of PANI/GO/PANI/ZnO were deposited onto quartz plates and IDEs by the sequential alternating immersion into PANI (cationic solution), GO (anionic solution), PANI and ZnO (anionic solution) until the formation of 2, 3 and 4 tetralayers (PGPZ2T, PGPZ3T and PGPZ4T) was achieved.
4.3.3. Multilayer films characterization
The adsorption of LbL multilayers deposited on quartz slides was monitored by UV-vis absorption spectroscopy using a Perkin-Elmer Lambda 25 spectrometer. The morphology of the LbL films was evaluated using a scanning electron microscope (SEM, JEOL 6510) operating at 10 kV. The topography, roughness (root mean square value) and homogeneity of the LbL films were assessed by Atomic Force Microscopy (AFM) using a Dimension V (Veeco) microscope. The Raman spectra of the LbL films were taken at room temperature with a Horiba Jobin-Yvon micro Raman spectrometer model LabRAM-HR equipped with a 632.8 nm laser delivering 30 mW power.
4.3.4. Electrical Measurements
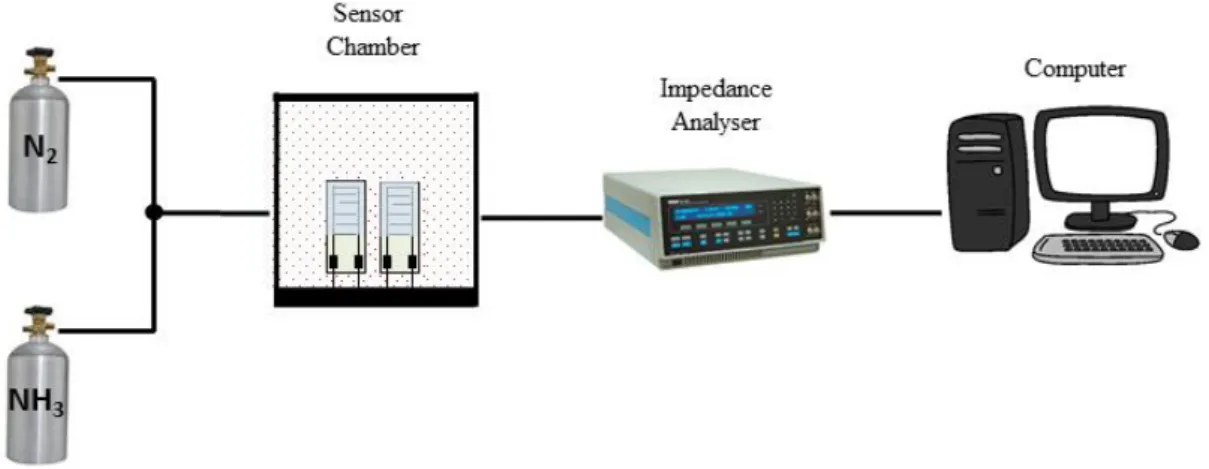
Electrical characterization of the sensing units made with the LbL films deposited on IDEs was performed using an impedance gain phase analyzer (Solartron, model 1260). Data were collected in the frequency range from 1 Hz up to 1 MHz, using an ac applied voltage of 25 mV. The sensors were tested for NH3 detection, in
system in the homemade setup displayed in Fig. 4.3.1. High purity N2 was used as
carrying gas for NH3 flux.
FIGURE 4.3.1: Schematic diagram of the experimental setup for NH3 detection. (Figure
available in Andre, R. S. et. al.172)
4.4. Results and discussion
Fig. 4.4.1 shows the UV-vis spectra of tetralayered LbL films, with absorption
bands at 320 and 840nm, assigned respectively to the π-π* electronic transition of the
benzene ring of amine groups and π-π* transition of graphene (at approximately 290 nm)173, and polaronic band of doped PANI in its conductive emeraldine form161. The
linear increase in the 840 nm peak intensity with the number of tetralayers reveals that the same amount of material was deposited at each deposition step.
The presence of GO and PANI was inferred in the Raman spectrum in Figure 4.4.2. The bands assigned to GO appear at 1333 cm-1 and 1604 cm-1, due to the
breathing mode of k-point photons of A1g symmetry and E2g phonon of sp2 carbon
atoms, respectively173. The PANI Raman bands appear at 1470 cm-1 assigned to C=N
stretching vibrations, while the band at 1222 cm-1 correspond to C-N stretching in
polaronic units and at 1160 cm-1 assigned to C-H in plane bending vibrations of
benzenoid ring153. The ZnO nanoparticles show only one weak Raman band at 416 cm-1
FIGURE 4.4.1: Absorption spectra of LbL films (PGPZ2T, PGPZ3T and PGPZ4T). Inset displays the intensity at 840 nm versus the number of deposited tetralayers. (Figure available in Andre, R. S. et. al.172)