Mobile Five Senses Augmented Reality System:
Technology Acceptance Study
JOÃO M. F. RODRIGUES 1, CÉLIA M. Q. RAMOS 2, JOÃO A. R. PEREIRA1, JOÃO D. P. SARDO1, AND PEDRO J. S. CARDOSO 1
1LARSyS and ISE, Universidade do Algarve, 8005-139 Faro, Portugal 2CinTurs and ESGHT, Universidade do Algarve, 8005-139 Faro, Portugal
Corresponding author: João M. F. Rodrigues ([email protected])
This work was supported in part by the Portuguese Foundation for Science and Technology (FCT), Projects: Laboratory of Robotics and Engineering Systems, LARSyS (UID/EEA/50009/2019), Arts and Communication Research Center, CIAC (UID/Multi/04019/2019), Research Centre for Tourism, Sustainability and Well-Being, CinTurs (UID/SOC/04020/2019), Center for Advanced Studies in Management and Economics, CEFAGE (UID/ECO/04007/2019), and in part by Project M5SAR I&DT nr. 3322 financed by the CRESC ALGARVE2020, PORTUGAL2020 and FEDER.
ABSTRACT The application of the most recent technologies is fundamental to add value to tourism experiences, as well as in other economic sectors. Mobile Five Senses Augmented Reality (M5SAR) system is a mobile guide instrument for cultural, historical, and museum events. In order to realize the proclaimed five senses, the system has two main modules: a (i) mobile application which deals mainly with the senses of sight and hearing, using for that the mobile device camera to recognize and track on-the-fly (museum’s) objects and give related information about them; and a (ii) portable device capable of enhancing the augmented reality (AR) experience to the full five senses through the stimulus of touch, taste, and smell, by associating itself to the users’ smartphone or tablet. This paper briefly presents the system’s architecture but, the main focus is on the analysis of the users’ acceptance for this technology, namely the AR (software) application, and its integration with the (hardware) device to achieve the five senses AR. Results show that social influence, effort expectancy, and facilitating conditions are the key constructs that drive the users to accept and M5SAR’s technology.
INDEX TERMS Augmented Reality, TAM, UTAUT, five senses. I. INTRODUCTION
Driven by mobile devices massification, augmented reality (AR) technologies have been gaining a huge amount of dif-ferent applications and users [2]. AR empowers a higher level of interaction between the user and real world objects, extending the experience on how the user sees and feels those objects, by creating a new level of professional and edutainment applications that was not available before. The M5SAR: Mobile Five Senses Augmented Reality system for museums [36] aimed at the development of an AR system to be a guide in cultural, historical, and museum events. The novelty of this system is to extend AR in mobile devices to the 5 human senses: sight, hearing, touch, smell, and taste [36], [37].
Traditional AR systems yield sensorial feedback for only two senses – sight and hearing. Unlike those AR sys-tems, multi-sensorial media focuses on providing a more
The associate editor coordinating the review of this manuscript and approving it for publication was Lei Wei .
immersive communication, enhancing the user’s quality of experience [46]. Existing multi-sensorial systems, related to augmented sensing experiences, are big hardware systems far from being portable (see Sec.II).
It is important to reinforce that, the main technological contribution of M5SAR is the implementation of a full mobile system that allows reality augmentation using five senses. The integration in a complete usable mobile system, based on a mobile device and a small hardware device [37], that integrates simultaneously smell, taste, and touch (i.e., heat, cold, and vibration), did not exist previously, to the best of our knowledge. Nevertheless, portable systems exist, but focus typically only in one sense [10], [14], or at most three when counting vision, hearing and an additional sense, for instance the smell.
To develop a portable device that explores all five human senses, three big challenges were addressed in the M5SAR’s context: (a) how to integrate the visitor’s smart device (tablet or smartphone) in a compact new device that allows the user to have an immersive five senses experience;
(PMD), to be integrated with the user’s smartphone or tablet in order to explore the five human senses. The PMD is portable, light and small, but it adds touch, smell, and taste experiences to the sight and sound provided by the App, completing the augmented system. In short, the system has the following main features: (a) an App that can be installed in any mobile device (independent of the operating system); (b) the App can detect museum’s objects using the rear camera of the device; (c) for each object of the museum (after being detected), the App reveals contents (text, audio, and/or video); (d) the App has an adaptive user interface, that can adapt to the user on-the-fly; (e) the App provides a smart route navigation and localization system; and (f) the system (App and PMD) gives five senses contents for the most important objects (masterpieces), i.e., text, audio, video, touch (cold, heat, vibration), smell, and taste.
The present papers refers to the M5SAR’s system, being the proposed technology acceptance model and the system’s analysis main contributions. In addition, the overall system’s architecture is presented for the first time.
The paper is structured as follows: the present section made an introduction, which is followed by a more in-depth contextualization and state of the art analysis in Sec. II. SectionIIIpresents the system’s architecture, describing the main modules and features, which will be in analysis by the proposed technology acceptance model presented in Sec.IV. The paper concludes with a final discussion and future work, Sec.V.
II. CONTEXTUALIZATION AND STATE OF THE ART The more informational channels we use the better the trans-mitted information will be perceived, being this a gener-ally accepted fact in psychology [26]. Still, most modern multimedia systems are focused only on two senses (sight and hearing). The difficulty to digitally convey compelling sensations for the remaining senses justifies their absence on those systems. Even though, there has been a series of attempts to achieve a full senses system but, almost none were embraced by developers, product designers, manufac-turers, or consumers.
As for the general multimedia systems, the same hap-pens for the museum’s mobile Apps, being the vast majority focused in 2 senses (vision and audition). However, a huge variety of Apps exist. For instance, the Wall Street Journal
gallery [38] (not a mobile application).
Typically indoor AR Apps are marker-based systems, also called image-based [11]. AR marker-based systems allow adding preset signals (e.g., paintings or statues) eas-ily detectable in the environment and use computer vision techniques to sense them. There are many commercial AR toolkits and AR content management systems [9], [27], [44], including open source software development kits (SDKs), being ARToolKit(X) [1] probably the most well known. For a more in-depth analysis on this subject, e.g., see [35]. Never-theless, none of these platforms explore the five senses, being the extension of the user’s ordinary mobile device with an hardware gadget – PMD – a solution.
Although there are some systems that combine multi-ple senses to offer a more immersive sensorial experience, portable devices to extent AR to five senses are inexis-tent. The most similar devices are probably the ones used in 4D movie theaters or shows, which allow to experience physical effects synchronized with the movie, such as rain, wind, temperature changes, strobe lights, vibrations, smells, fog, and chair movements, among other things. In the virtual reality (VR) consumer market there has been some develop-ments, as is the example of the FeelReal VR Mask [17]. The mask, compatible with the Oculus Rift [17] and some other existing VR headsets, is a multi-sensory gaming interface, which enables the user to experience different smells and simulated effects of wind, heat, water mist, and vibration. The Museum of Food and Drink (MOFAD) [29], in New York, also developed a very interesting odor interactive display, called The Smell Synthesizer. The interactive display allows visitors to press different buttons that release chemicals asso-ciated with the smell of certain elements. However, their multi-sensory approach was not exactly integrated into a sin-gle system, and the taste aspect of it was recreated separately using gumball machines (candy-like pellets with peculiar flavors such as tomatoes, porcini mushrooms, and parme-san cheese). For more details about multi-sensorial systems see [37], and for a recent survey with the state-of-the-art in augmented, virtual, and mixed reality systems for cultural heritage perspective see [5].
One huge gap in many of this innovative systems is the lack of analysis on how users come to accept and use the proposed technologies, namely on how AR applications interact with cultural and historical sites, and the purpose of improving
instructional design and use guidelines. Nevertheless, some examples exist, such as the one proposed in [22].
In this context, the technology acceptance model (TAM) was developed with the goal of explaining and predicting how users accept and use the proposed technologies [13]. TAM integrates the theory of reasoned action, developed by Fishbein and Ajzen [18] as a theoretical base to explain the human behavior in terms of the determinants of information and communication technology usage.
After a revision and consolidation of the theory, TAM was extended to the unified theory of acceptance and use of technology (UTAUT) model [42], which intends to inves-tigate the user’s intentions when facing a new technol-ogy. The UTAUT model considers four constructs [42]: (i) performance expectancy, (ii) effort expectancy, (iii) social influence, and (iv) facilitating conditions. For instance, this model has been applied to explore user’s acceptance of mobile technologies [45], on-line purchasing tickets [16], security-related factors in mobile payment [25], and mobile technology in museum visits [30]. Despite the excellent model to analyze the acceptance and usage of technology provided by UTAUT, the standard presents some limitations to the consumer’s environment, and the UTAUT2 model was developed. UTAUT2 explains approximately 70% of the variance in behavioral intention and 50% of the variance in technology use [43], being composed by seven constructs: (i) performance expectancy, (ii) effort expectancy, (iii) social influence, (iv) facilitating conditions, (v) hedonic motivation, (vi) price value, and (vii) habit.
The M5SAR system will be presented in the following section, including the description of its architecture, refer-ences to detailed architecture modules’ reports made by the authors in previous publications, the UTAUT model pro-posed for the system, and the corresponding model’s results analyzes.
III. M5SAR ARCHITECTURE
Figure1presents the M5SAR’s system which has three main modules. The (a) server, depicted on the left side of the figure, where the contents for the AR and bundles (museum’s AR object markers – image descriptors) are stored, for more details see [35], [36]. The server communicates with the (b) mobile App, depicted on the middle of the figure, which per se is divided in three main sub-modules, namely: (b.i) the adaptive user interfaces (AUI) [36], (b.ii) the mobile image recognition based augmented reality (MIRAR) sub-module, which includes the object recognition unit (walls and human clothe AR contents superimposition) [3], [34], [35], and the (b.iii) localization and adaptive navigation unit [7], [8]. On the figure’s right side, the (c) devices ‘‘con-nected’’ (via Bluetooth) with the mobile device are shown, namely: the (c.i) Beacons employed in the computation of the user’s localization and the (c.ii) portable device for touch, taste and smell (PDTTS, in the figure; in this paper mentioned as PMD) sensations used to enhance the five senses [37].
FIGURE 1. Simplified architecture of the M5SAR system.
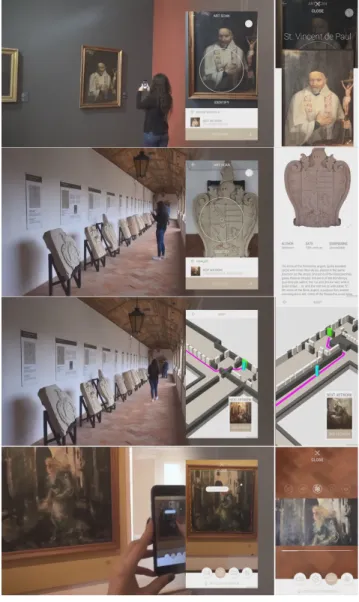
To understand the TAM application it is necessary to explain in more detail the system’s main features, modules (b) and (c). As mentioned, the (b) mobile App module has the (b.i) AUI sub-module which, at the limit, corresponds to the build of a different layout and content for each UI view and user, in order to achieve a full adaptive UI. Nevertheless, different users could have the same layout or at least partially similar layouts. The same layout and structure can also be used in multiple views (e.g., when showing information about different paintings to the same user). In this case, the thing that changes are the contents to be displayed to the user. Of course, contents could be different for different users, even when the layout is the same. In this context, and with the principle of adapting the UI on the fly, the UI view was separated in (A) structure/layouts and (B) contents. This means that, the application will no longer create views but will instead make ‘‘card-layouts’’ and place different con-tents on the (same) card-layout at different execution points, allowing the (different) layouts and structures to be used multiple times. For more details see [36]. Despite the system being prepared to create different UI layouts for each user, the App tests were done limiting the UI to 5 types of users: standard, senior, expert, child, and family. The TAM inquiries and results reflect only the standard user layout, presented in Figs.2and3.
Also part of the (b) mobile App module, the (b.ii) MIRAR sub-module has four main features: (i) the detection and recognition of museum objects, triggering a card in the App [36]; (ii) the detection, recognition, and tracking of objects as the user moves along the museum, allowing to touch different areas of the objects displayed in the mobile screen and showing information about that region of the object [35]; (iii) the detection and modeling of the museum’s walls, and subsequent projection of information/contents (e.g., images, movies, or text), related with the recognized objects’ epochs, into the those detected walls [34]; and (iv) the detection of persons moving in the museum and, for instance, dressing them with clothes from the exhibition’s epoch [3].
MIRAR’s object recognition unit uses images from the museum’s objects and the mobile device’s camera to recog-nize and track on-the-fly, on the client-side, those objects. The environment detection and recognition unit is supported upon the same principles of the object’s recognition, but uses images from the environment (e.g., walls) to recognize them.
FIGURE 2. Examples of the App in stand-alone mode.
Finally, the human detection and segmentation unit uses convolutional neural networks for the detection of persons and 3D volumes to overlap the clothes over those detected persons. It is also important to stress that, since the sensor used to acquire the images from the environment is the mobile devices’s camera, in order to save battery, the camera is only activated when the AR option is selected in the UI. When the activation occurs, the user can see the environment in the mobile device’s screen and execute the previously mentioned actions.
Sub-modules (b.i) and (b.ii) need to communicate with the server to obtain operating information. The required infor-mation filtering is done as MIRAR module (b.iii) estimates the user’s position, based on the previous object detections and the localization given by the beacon’s signals (there is a beacon per museum room), and sends it to the server. From the server, the MIRAR module receives a group of object markers (image descriptors), here called bundles [35], that contain information about the objects available in the located
FIGURE 3. Examples of the App and PMD working.
room or museum section. In a way to minimize communi-cations, the App stores locally the bundles from the previ-ous room(s) or museum section(s) (limited to each device’s memory size) and as soon as it detects a new beacon signal it
downloads the new bundle. Older bundles are discarded in a FIFO (first in, first out) manner.
In terms of adaptive navigation (b.iii) [8], the first approach was to adapt a recommender system, supported on rule-based machine learning, to do the planning of the visits. Later, in [7], an implicit recommender system was used to propose points of interest to be explored in the cultural heritage places. In both cases, the overall system uses data acquired by a mobile application to feed the recommender system in a non-intrusive way, i.e., suggestions of artworks or artists are sup-ported on the mobile application usage. The recommenders aggregate information of the objects typically visited by users with the same profile, the path proposed by the museum’s experts, objects the user is seeing with the AR functionalities, etc. Figure2shows examples of detected objects and a map for the recommended navigation.
Also noteworthy, the App allows to track groups (e.g., families or other visiting groups), informing where the other elements are, by showing the last object visited and/or beacon position. For instance, this feature might be important when kids and parents want to explore different parts of the museum.
Figure2shows examples of the App working on a stand-alone mode in Faro Municipal Museum. In the left, from top to bottom, the detection of a museum object (picture), the detection of a family crest, user navigation, and detailed information about pressed object regions. The figure’s right side shows more details about the objects obtained when scrolling or pressing the application options.
Relatively to the (c) devices module, this paper will only focus the (c.ii) PMD, since the beacon communication and localization sub-module is quite trivial. As mentioned, the PMD is capable of realizing a complete five senses expe-rience when used in conjunction with the mobile device run-ning the App. This means that the PMD should be light, small, and flexible enough to adapt to different mobile devices. In this sense, the hardware module was limited to a size of 7 × 7 × 25 cm, although the apparatus could be composed of one or two of those parts. The two parts case implies the positioning of one part on each side of the mobile device. Figure3 shows the one side configuration, being the TAM applied to this version. Albeit the two sides configuration allows to have twice the amount of smells and tastes, the one side is more comfortably carried by a person during a typical museum visit, maintaining the capacity to reproduce com-pelling stimulus for the three senses (i.e., touch, taste, and smell) at the appropriate time, i.e., when instructed by the application. It is important to stress that all hygiene precau-tions are taken into account, including the use of disposable components (‘‘straw’’) in case of taste sense.
A microcontroller is the core unit of the PMD. The micro-controller receives instructions from the mobile application and acts accordingly, controlling the remaining hardware. The device communicates with the mobile application via a Bluetooth interface and uses a wired communication for the remaining physical output interfaces/hardware. The physical
output interfaces will be responsible for reproducing the sen-sorial stimulus for the mentioned three senses. The left and right hardware parts (if two parts are used) are very similar to each other, and they have the same modules, components and connections, with one main difference: the part with Bluetooth (left) will have the master microcontroller and a slave microcontroller will be on the other side (right). For development details see [37].
Exemplifying the system’s usage with a practical example is important to better understand the collaboration between App and PMD which, as already was mentioned, communi-cate using Bluetooth. When App and PMD are connected and a masterpiece is detected by the App (the museum defines which objects are masterpieces), the overall system activates the 5 senses functionalities [37].
Previously, the museum’s experts prepared a 5 senses nar-rative for each masterpiece, i.e., a narnar-rative/story is prepared using image (video) and sound to highlight the object (master-piece), as traditionally is done in many museums. But, in our case, along with the narrative, the experts analyze specific points in the timeline where they introduce the remaining 3 senses. In the case presented in Fig. 3, the object is a painting of a Portuguese – Algarvian legend, which can be told in a few words. Once upon a time, a Nordic princess married a Moorish prince that ruled the Algarve. The princess grew sad because she missed seeing the snow so was she so used to it in her country. Decided to alleviate the princess sadness, the prince ordered the massive planting of almond trees, so that when they were in bloom she would look to a landscape covered in white flowers, looking like fresh snow. Knowing the narrative and which points should and could be enhanced, the museum’s experts define in a timeline when the user should feel the different senses, for how long, and with which intensity (3 to 4 levels of intensity are allowed, depending on the sense). In the Algarvian legend’s narrative, the user should feel cold with the highest level of intensity during some second, e.g, when in the timeline he/she is being told about the white flowers that look like fresh snow. Each sense can be stimulated several times in the same narrative, with different intensities and durations. Again in the exem-plified narrative, different vibrations where used to show the sadness of the princess, among other events. The ‘‘smell of the castle’’ was used in the beginning of the narrative, heat was used to simulate the temperature of Algarve, and the smell of the almonds was also used along with two different tastes of the epoch, introduced in specific point of the timeline. Finally, it is important to stress that all senses can be stimulated alone or combined with others (the only exception is the simultaneous stimulation by heat and cold). The heat/cold is implemented using a Peltier thermoelectric module in the back of the PMD [37], which in many cases is used in conjunction with wind, produced by the fan placed in the front of the PMD.
The museum’s experts have a back office tools to insert the events they intend in the timeline, that is stored in the system’s database.
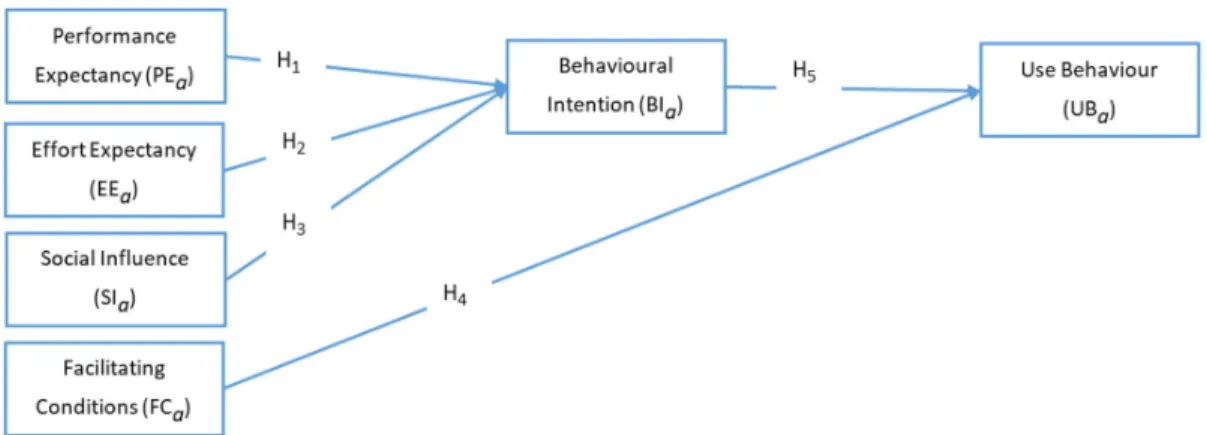
FIGURE 4. M5SAR’s UTAUT research model.
Examples of the App and PMD working together are shown in Fig. 3, being the active senses displayed in the bottom of each image. In the next section the proposed TAM model is presented.
IV. TECHNOLOGY ACCEPTANCE MODEL
The M5SAR system (App + PMD), due to its specifications, needs to be evaluated before it can be made available to the public. In accordance with the UTAUT model [42], in the present context two constructs will not be analyzed: the hedo-nic motivation (considering purchases is related to hedohedo-nic impulses) and price value. This decision is justified by the fact that both modules (App and PMD) are not yet commercially available, and mostly because PMD is expected to be rent (in the museum space) by a symbolic value. The business model is out of the focus of this paper, but it is related with the increase selling of associated merchandising. With the withdraw of the UTAUT’s referred constructs, the base model is the one proposed in Fig.4and detailed next.
The performance expectancy (PE) is the degree to which a user believes that using M5SAR’s system will provide benefits in visiting a museum [42], i.e., the indicator gives the idea of improving the performance of the visit if you use the features of the system. Therefore, it was hypothesized:
H1. The impact of PE on behavioral intention (BI) will be
positive.
The effort expectancy (EE) is the degree of ease associated to the use of the M5SAR’s system [42]. Regardless of the museum visitor’s technological abilities, the EE allows to evaluate if the users expect to find difficulties in the use of the system. If the system is easy then it will potentiate its future use. Therefore, it was hypothesized:
H2. The impact of EE on BI will be positive.
Social influence (SI) is the extent to which users perceive that family and friends believe they should use the M5SAR’s system when visiting the museum [42]. Therefore, it was hypothesized:
H3. The impact of SI on BI will be positive.
Facilitating conditions (FC) refers to how users believe that the technological infrastructure exists to help them use the M5SAR’s system whenever necessary [42]. For instance,
the mobile technologies usage requires some skills, e.g., con-necting to the internet or navigating in the functionalities. The access to an application characterized by a set of facilitating conditions will influence a greater intention of usage. There-fore, it was hypothesized:
H4. The impact of FC in use behavior (UB) will be
positive.
Individual behavior is predictable and influenced by individual intention. UTAUT also supports the belief that behavioral intention has a substantial influence on the use of technology, i.e., BI reflects the relationship between behav-ioral intention and substantial influence on the use of tech-nology [42]. Therefore, it was hypothesized:
H5. The impact of BI in UB will be positive.
A. METHODOLOGY
Following the adapted UTAUT model, a survey in Portuguese and English was developed and a group of information sys-tems experts reviewed and tested it. The survey was com-posed by two main sections: (i) the UTAUT data constructs expressed in a five-point Likert scale, from ‘‘strongly dis-agree’’ (1) to ‘‘strongly dis-agree’’ (5); and (ii) the demographic characteristics of the respondent. The technology accep-tance questionnaire associated to the M5SAR’s system was designed and hosted on a popular web service for collecting the data. Then, the questionnaire was presented to a group of museum visitors who were invited to test the application and agreed to answer the survey’s questions.
The survey was developed to evaluate the M5SAR-App (stand-alone mode) and the M5SAR-PMD, with differ-ent questions adapted according with the functionalities of each of the components. The App survey and the PMD survey were applied in different moments so the respondents could clearly distinguish what they were evaluating. Nevertheless, it is important to stress that the PMD is completely integrated with the App, so in the case of the M5SAR-PMD’s survey the results represent the PMD and its integration with the App.
After collecting surveys’ data, responses were codified to make possible the usage of descriptive statistics to charac-terize the sample and the structural equation model (SEM) to evaluate the research model. SEM was considered since
it is indicated to overcome the need to measure multidi-mensional and not-directly-observable concepts, also called constructs or latent variables [6]. According to Gefen [20], the SEM ‘‘has become the rigueur in validating instruments and testing linkages between constructs. The SEM considered is based on variance-based SEM or partial least squares path SEM [32], which permits the construction of the model in an exploratory phase, with a (little) portion of the sample which is not normally distributed [33].
B. RESULTS
The results for the stand-alone App and PMD analysis were divided in 4 strands: (a) sample characterization, (b) measure-ment model, (c) structural model, and (d) discussion.
(a) Sample characterization: in the case of the App there
were 72 respondents, being the sample characterized by a majority of males (66.7%), over 35 years (44.4%), in pos-session of an university degree (66.7%), and dependently employed (77.8%). For the PMD, the sample had 84 respon-dents and is defined by a majority of males (57.1%), over 35 years (50.0%), in possession of an university degree (85.7%), and dependently employed (85.7%).
(b) Evaluation of the measurement model: the
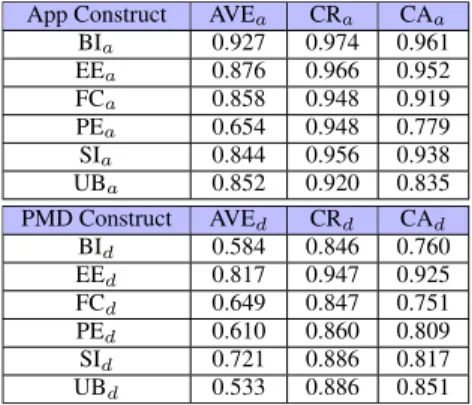
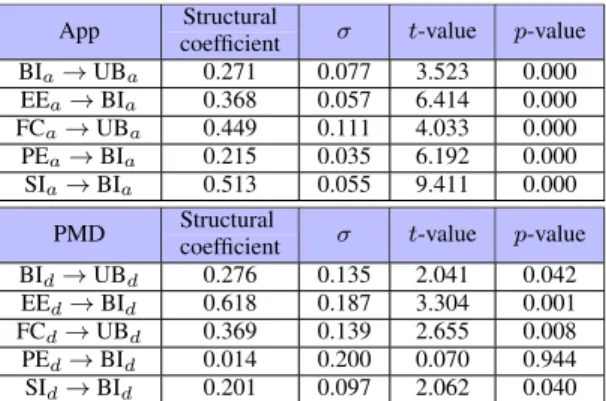
adjust-ment quality of the model analyzes comprehends three steps: (i) evaluation of the measurement model to guarantee the convergent validity, by the average variance extracted (AVE) (ii) observation of internal consistency values, through the values of Cronbach’s alpha (CA) and composite reliability (CR), and (iii) discrimination quality assessment, where the square roots of AVEs should be larger than Pearson’s corre-lations between those of latent variables. Tab.1presents the average variance extracted (AVE), composite reliability (CR), and Cronbach’s alpha (CA) values.
To differentiate between App and PMD, constructs and other variables will have an a subscripted in the case of the App (e.g., BIa) or a d subscripted in the case of the PMD (e.g., BId).
Since AVE values are greater than 0.5, as summarized in the Tab. 1, it is assumed that the model converges to a satisfactory result [19], i.e., it is concluded that the model has convergent validity. Observation of internal consistency values takes into consideration the values of CA and CR, expressed by the ρ of Dillon-Goldstein. The values of CA should be higher than 0.6, being values of 0.7 considered ade-quate. In similar fashion, CR values should be higher than 0.7, being values of 0.9 considered satisfactory [21]. Therefore, according with the work of Hair et al. [21], the model has internal consistency.
In the measurement model’s third step, the discriminant validity assessment permits to investigate the independence between latent variables and other variables. This analysis can be done by the criterion of Fornell and Larcker [19], which compares the square roots of the AVE values of each latent variable with the Pearson’s correlations between the latent variables. The square roots of AVEs should be larger than the correlations between those of latent variables, as presented
TABLE 1.Quality criteria: construct reliability and validity. App in the top rows and PMD in the bottom rows.
TABLE 2.Values of the correlations between the latent variables and the square roots of the AVE values - on the main diagonal. App in the top rows and PMD in the bottom rows.
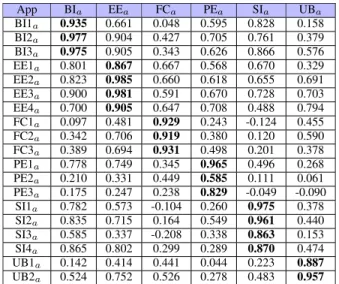
in Tab.2. Therefore, it is possible to guarantee the quality of the discriminant validity. Another way to evaluate the discriminant quality of the model is through the cross-loading criterion. The cross-loading criterion refers that each item should present a higher loading on its corresponding factor than the cross-loading on other factors [12]. Furthermore, the cross-loading values are presented in Appendix A for the App and Appendix B for the PMD. After guaranteeing discriminant validity in the evaluation of the measurement model, for App and PMD, the evaluation of the structural model is made in the next step.
(c) Structural model: the evaluation of the structural model
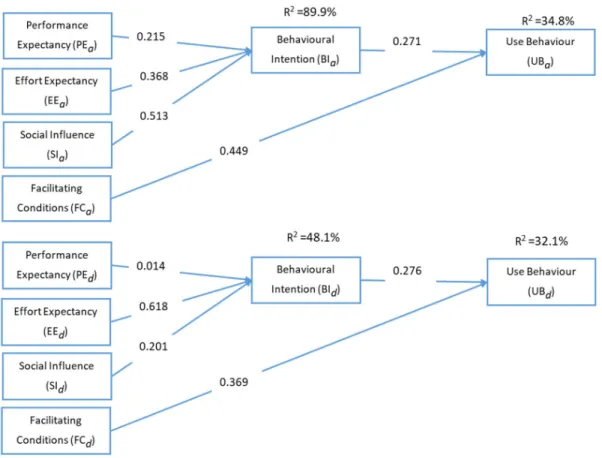
is performed using Pearson’s correlations coefficient (R2) of the endogenous latent variables. The App model explains 89.9% of variation in behavior intention and 34.8% in use behavior, as presented in Fig.5– top. In the case of the PMD model, 48.1% of variation in behavior intention and 32.1% in use behavior are explained, as presented in Fig.5– bottom.
Another aspect to analyze is the model’s capacity to pre-dict, which requires the calculation of the Stone-Geisser indi-cator (Q2) and the Cohen indicator (f2) associated to the effect size [21]. The Stone-Geisser indicator evaluates how close the model is to what was expected; the Cohen indicator evaluates how useful each construct is for the model. Results
FIGURE 5. The App structural model (top) and the PMD structural model (bottom) results.
TABLE 3. Indicators values of the predictive validity and effect size. App in the top rows and PMD in the bottom rows.
are presented in Tab. 3, being EXLV the exogeneous latent variable and ENLV the endogeneous latent variable.
The Q2 value associated with the exogenous latent vari-ables presents a value higher than zero (Tab.3), which means that both endogenous variables have predictive power, and the structural model has predictive relevance. The f2indicators associated with all the latent variables are higher than 0.15 for the App and PMD, which shows how useful each construct is for the model. In this case, all variables have a medium impact in the App and in the PMD on the structural model.
The structural model analyses ends with the individual analysis of the coefficients of the respective model (path coefficients), as presented in Fig.5and Tab.4(beingσ the standard deviation). In this case, it is necessary to analyze the sign, the value and the t statistical significance, which should be more than 1.96 (bilateral and with a 5% significance level) [23]. In the case of the App, taking in considerations the t-values, which are all higher than 1.96, and p-values, which are all less than 0.05, the null hypothesis from H1 to H5 should all be rejected and the direct coefficients should be different from zero, once coefficients are significant. For the case of the PMD, taking into consideration again the
t-values, only H1 is lower than 1.96, and the p-value is higher than 0.05. Therefore, the null hypothesis should be accepted and the structural coefficients should be equal to zero, once coefficient is non significant.
(d) Discussion: Table4 presents the direct effect which indicates, by the t-test values and p-values. By analyzing Fig.5and Tab.4, which present the structural coefficients and how significative they are, we can conclude which constructs have most impact to explain the App and the PMD accep-tance. In the App case, all constructs have positive effects on both behavioral intention and use behavior. Furthermore, effort expectancy, social influence, facilitating conditions have a great impact as they have structural coefficients greater than 0.3. On the other hand, performance expectancy and
TABLE 4. Direct effects in the structural relationships between the latent variables. App in the top rows and PMD in the bottom rows.
behavioral intention yield moderate effect once their struc-tural coefficient is less than 0.3. This means that increasing the value by 1.0 in the facilitating conditions construct will increase the value of the use behavior construct by 0.449.
Taking in consideration the Tab.4and Appendix A (App), it is possible to identify the detailed motivations associated to the App acceptance. In terms of behavior intention, friends, family, and influencer opinions contribute to use the App. The effort expectancy, defined by the way as the user interacts with the App, which is considered easy to use and to learn, contributes the sensation that he/she can be skillful in using it. In general, all of these contribute to the acceptance of the M5SAR’s App. In summary, the App was considered useful, permitting to accomplish tasks more quickly and faster, which contributes to the behavior intention to use the App.
In terms of use behavior, the facilitating conditions is the construct that has more impact, followed by the behavior intentions, where the users considers that he/she has the resources and the knowledge necessary to use the App. Also, the App being compatible with others technologies that the user employs contributes to its acceptance and usage, e.g., to search for additional information about museum’s objects and about auxiliary services. The impact of the behavior intention contributes to accept the App, once the users intend to use it in the future, whenever it is possible, and considers it as a good idea when visiting the museum.
In the case of PMD, all constructs have positive effects on both behavioral intention and use behavior. However, the performance expectancy construct is not significant for behavioral intention. The effort expectancy and facilitating conditions have the greatest impact as they have structural coefficients greater than 0.3. This means that increasing the value of 1.0 in the effort expectancy variable will increase 0.618 in the value of the behavior intention variable and increasing the value of 1.0 in the facilitating conditions vari-able will increase 0.369 in the value of the use behavior. The structural coefficient of social influence in behavioral intention and behavioral intention in use behavioral have a positive, significant but moderate effect.
Taking in consideration Tab. 4 and Appendix B, the detailed motivations associated to the PMD acceptance
can be explained. The opinion of the family, friends, and museum influencers contributes to the intention to use the PMD, aided by fact that users consider the interaction with the device clear and understandable. The PMD was considered easy to use and to learn, while contributes to the user feeling of being skillful when using it. The last contributes to define the behavior intention in the acceptance and use of the PMD. In terms of the use behavior, the facilitating conditions is the construct that has more impact, followed by the behavior intentions, where the users considers that he/she has the resources and the knowledge necessary to use the PMD. The possibility to get help from others when having difficulties using the PMD, for example, a specific person is available for assistance with the PMD difficulties in the museum contributes for its acceptance and usage. The impact of the behavior intention contributes to the acceptance of the PMD, once the user intends to use it in the future in the museum, whenever it is possible. In other words, the PMD is a good idea when visiting the museum, making the visit more inter-esting, namely when used with the application and with the several ‘‘senses’’ integrated (cold/heat feeling, wind, smell, taste, and vibrations sensation).
V. CONCLUSION
This paper briefly presents the M5SAR’s system (App and PMD), followed by the application of the UTAUT technol-ogy acceptance model to it. Results shows that the M5SAR App and M5SAR PMD have an enormous potential to develop and apply in a real context. In summary, social influence (family, friends, and influencers) has a great impact in the intention of usage; the expectations associated to the effort, which means the degree of ease associated to the M5SAR App and M5SAR PMD usage, also contributes to intention of using the system; and the degree associated to the user’s believes that the App provide benefits in visiting the museum also contributes to the intention to use and accept the M5SAR App.
Results demonstrated the intention and the facilitating con-dition to use the M5SAR App and M5SAR PMD contributing to the user behavior. Mainly, the use of the M5SAR App to find additional information about museum’s objects and aux-iliary services, and the use of the M5SAR PMD, integrated with the application and senses activated, contribute to create a more interesting visit to the museum.
Future work will go in four complementary/parallel strands: (a) improve the initial existing model to harvest human features [39] in a way to change the AUI in function of each user and integrate the concept of user experience in the interface; (b) optimize the walls and human detec-tion modules [3], [34] so they can work more smoothly on mobile devices, to achieve on-the-fly environment and clothe AR contents superimposition; and (c) apply the TAM to the 5 different types of users (standard, senior, expert, child, and family), instead of only the standard, analyzing the differ-ences (if exists) and adapting M5SAR in consonance. (d) Last but not least, integrate in the TAM questions that shows that
the technology is in line with the United Nations Sustainable Development Goals.
APPENDIX A
APP CROSS-LOADINGS
Table 5 presents thee list of the latent variables and their constructs (in bold), being:
BIa: Behavioral Intention
• BI1a: I intend to continue to use the APP in the future; • BI2a: I plan to continue to use the App whenever
possi-ble;
• BI3a: I intend to use the App because it is a good idea. EEa: Effort expectancy
• EE1a: My interaction with the App is clear and
under-standable;
• EE2a: I find the App easy to use;
• EE3a: Learning how to use the App is easy for me;
• EE4a: It is easy for me to become skillful at using the App.
FCa: Facilitating Conditions
• FC1a: I have the resources necessary to use the App;
• FC2a: I have the knowledge necessary to use the App;
• FC3a: The App is compatible with other technologies I use.
PEa: Performance Expectancy
• PE1a: I find the App useful;
• PE2a: Using the App enables me to accomplish tasks:
more quickly.
• PE3a: Using the App allows me to be faster in executing
activities, for example: searching the exit.
SIa: Social Influence
• SI1a: People who are important to me think that I should use the App (friends, family);
• SI2a: People who influence my behavior think that I should use the App;
• SI3a: People whose opinions I value, say that I should use the App;
• SI4a: The museum suggest the use of the App.
UBa: Use Behavior
• UB1a: Search for additional information about statues; • UB2a: Search for additional information about auxiliary
service. APPENDIX B
PMD CROSS-LOADINGS
Table 6 presents the list of the latent variables and their constructs (in bold), being:
BId: Behavioral Intention
• BI1d: I intend to continue to use the PMD in the future;
• BI2d: I plan to continue use the PMD whenever possible;
• BI3d: I intend to use the PMD because it is a good idea;
• BI4d: I intend to use the PMD because it makes the visit more interesting.
EEd: Effort Expectancy
• EE1d: My interaction with the PMD is clear and
under-standable;
• EE2d: I find the PMD easy to use;
• EE3d: Learning how to use the PMD was easy for me; • EE4d: It is easy for me to become skillful at using the
PMD.
FCd: Facilitating Conditions
• FC1d: I have the resources necessary to use the PMD. • FC2d: I have the knowledge necessary to use the PMD.
• FC3d: I can get help from others when I have difficulties using the PMD (a specific person is available for assis-tance with the app difficulties in the museum).
PEd: Performance Expectancy
• PE1d: I find the PMD useful;
• PE2d: Using PMD allows me to have a faster immersive experience;
• PE3d: Using the PMD increases my chances of getting more knowledge acquisition;
• PE4d: Using the PMD increases my chances of getting
more acquisition knowledge.
SId: Social Influence
• SI1d: People who are important to me think that I should use the PMD (friends, family);
• SI2d: People who influence my behavior think I should use PMD;
• SI3d: The museum suggest the use of the PMD.
UBd: Use Behaviour
• UB1d: I intend to use PMD integrated with the
application;
• UB2d: I intend to use the cold feeling PMD - Interface; • UB3d: I intend to use the heat feeling PMD - Interface; • UB4d: I intend to use the wind feeling PMD - Interface;
• UB5d: I intend to use the smell sense PMD - Interface;
• UB6d: I intend to use the taste sense PMD - Interface;
• UB7d: I intend to use the vibration sensation PMD -Interface.
ACKNOWLEDGMENT
The authors would like to thank Faro Municipal Museum and SPIC - Creative Solutions [www.spic.pt].
REFERENCES
[1] ArtoolkitX. (2019). ARtoolKitX: Open-Source, Multi Platform Augmented
Reality. Accessed: Jun. 11, 2019. [Online]. Available: http://artoolkit.org/ [2] R. Azuma, Y. Baillot, R. Behringer, S. Feiner, S. Julier, and B. MacIntyre, ‘‘Recent advances in augmented reality,’’ IEEE Comput. Graph. Appl., vol. 21, no. 6, pp. 34–47, Nov. 2001.
[3] R. Bajireanu, J. A. R. Pereira, R. J. M. Veiga, J. D. P. Sardo, P. J. S. Cardoso, R. Lam, and J. M. F. Rodrigues, ‘‘Mobile Human Shape Superimposition: An initial approach using OpenPose,’’ Int. J. Comput., vol. 3, pp. 1–8, Jan. 2019.
[4] Balance. (2019). The Balance: Fine Art Museum Apps for Smart Phones. Accessed: Jun. 11, 2019. [Online]. Available: https://goo.gl/WEsQRN [5] M. K. Bekele, R. Pierdicca, E. Frontoni, E. S. Malinverni, and J. Gain,
‘‘A survey of augmented, virtual, and mixed reality for cultural heritage,’’
J. Comput. Cultural Heritage, vol. 11, no. 2, 2018, Art. no. 7.
[6] K. A. Bollen, Structural Equations With Latent Variables, vol. 210. Hoboken, NJ, USA: Wiley, 2014.
[7] J. S. Pedro Cardoso, P. Guerreiro, J. Monteiro, and J. M. F. Rodrigues, ‘‘Applying an implicit recommender system in the preparation of visits to cultural heritage places,’’ in Universal Access in Human-Computer
Interaction. Virtual, Augmented, and Intelligent Environments, M. Antona and C. Stephanidis, Eds. Cham, Switzerland: Springer, 2018, pp. 421–436. [8] P. J. S. Cardoso, J. M. F. Rodrigues, J. A. R. Pereira, and J. D. P. Sardo, ‘‘An object visit recommender supported in multiple visitors and muse-ums,’’ in Universal Access in Human–Computer Interaction. Design and
Development Approaches and Methods, M. Antona and C. Stephanidis, Eds. Cham, Switzerland: Springer, 2017, pp. 301–312.
[9] Catchoom. (2019). Catchoom. Accessed: Jun. 11, 2019. [Online]. Avail-able: http://catchoom.com/
[10] Y.-S. Chen, P.-H. Han, K.-C. Lee, C.-E. Hsieh, J.-C. Hsiao, C.-J. Hsu, K.-W. Chen, C.-H. Chou, and Y.-P. Hung, ‘‘Lotus: Enhancing the immer-sive experience in virtual environment with mist-based olfactory display,’’ in Proc. SIGGRAPH Asia Virtual Augmented Reality, 2018, Art. no. 9.
[11] K.-H. Cheng and C.-C. Tsai, ‘‘Affordances of augmented reality in science learning: Suggestions for future research,’’ J. Sci. Educ. Technol., vol. 22, no. 4, pp. 449–462, 2013.
[12] W. W. Chin, ‘‘The partial least squares approach to structural equa-tion modeling,’’ Mod. Methods Bus. Res., vol. 295, no. 2, pp. 295–336, 1998.
[13] F. D. Davis, ‘‘Perceived usefulness, perceived ease of use, and user accep-tance of information technology,’’ MIS Quart., vol. 13, no. 3, pp. 319–340, 1989.
[14] D. Dobbelstein, S. Herrdum, and E. Rukzio, ‘‘inScent: A wearable olfac-tory display as an amplification for mobile notifications,’’ in Proc. ACM
Int. Symp. Wearable Comput., 2017, pp. 130–137.
[15] A. F. Dragoni, R. Quattrini, P. Sernani, and L. Ruggeri, ‘‘Real scale augmented reality. A novel paradigm for archaeological heritage fruition,’’ in Proc. Int. Interdiscipl. Conf. Digit. Environ. Educ., Arts Heritage. Cham, Switzerland: Springer, 2018, pp. 659–670.
[16] T. Escobar-Rodríguez and E Carvajal-Trujillo, ‘‘Online purchasing tickets for low cost carriers: An application of the unified theory of acceptance and use of technology (UTAUT) model,’’ Tourism Manage., vol. 43, pp. 70–88, Aug. 2014.
[17] FeelReal. (2019). FeelReal. Accessed: Jun. 11, 2019. [Online]. Available: https://www.feelreal.com/
[18] M. Fishbein and I. Ajzen, Belief, Attitude, Intention, and
Behav-ior: An Introduction to Theory and Research. Reading, MA, USA: Addison-Wesley, 1977.
[19] C. Fornell and D. F. Larcker, ‘‘Evaluating structural equation models with unobservable variables and measurement error,’’ J. Marketing Res., vol. 18, no. 1, pp. 39–50, 1981.
[20] D. Gefen, D. Straub, and M. C. Boudreau, ‘‘Structural equation modeling and regression: Guidelines for research practice,’’ Commun. Assoc. Inf.
Syst., vol. 4, no. 1, p. 7, 2000.
[21] J. F. Hair, Jr., G. T. M. Hult, C. Ringle, and M. Sarstedt, A Primer on Partial
Least Squares Structural Equation Modeling (PLS-SEM). Newbury Park, CA, USA: SAGE, 2016.
[22] J. M. Harley, S. P. Lajoie, T. Tressel, and A. Jarrell, ‘‘Fostering positive emotions and history knowledge with location-based augmented reality and tour-guide prompts,’’ Learn. Instruct., to be published.
[23] J. Henseler, C. M. Ringle, and R. R. Sinkovics, ‘‘The use of partial least squares path modeling in international marketing,’’ in New
Chal-lenges to International Marketing. Bingley, U.K.: Emerald Group, 2009, pp. 277–319.
[24] InformationWeek. (2019). InformationWeek: 10 Fantastic iPhone, Android
Apps for Museum Visits. Accessed: Jun. 11, 2019. [Online]. Available: https://goo.gl/XF3rj4
[25] J. Khalilzadeh, A. B. Ozturk, and A. Bilgihan, ‘‘Security-related fac-tors in extended UTAUT model for NFC based mobile payment in the restaurant industry,’’ Comput. Hum. Behav., vol. 70, pp. 460–474, May 2017.
[26] P. T. Kovács, N. Murray, G. Rozinaj, Y. Sulema, and R. Rybárová, ‘‘Appli-cation of immersive technologies for edu‘‘Appli-cation: State of the art,’’ in Proc.
Int. Conf. Interact. Mobile Commun. Technol. Learn. (IMCL), Nov. 2015, pp. 283–288.
[27] Layar. (2019). Layar. Accessed: Jun. 11, 2019. [Online]. Available: https://www.layar.com/
[28] F. López, P. M. Lerones, J. Llamas, J. Gómez-García-Bermejo, and E. Zalama, ‘‘Linking HBIM graphical and semantic information through the Getty AAT: Practical application to the castle of torrelo-batón,’’ in Proc. IOP Conf. Ser., Mater. Sci. Eng., vol. 364, 2018, Art. no. 012100.
[29] Mofad. (2019). Museum of Food and Drink Flavour. Accessed: Jun. 11, 2019. [Online]. Available: https://www.mofad.org/flavor/ [30] N. Nizar and M. K. Rahmat, ‘‘Examining the museum visitors use
of mobile technology through technology acceptance model (TAM),’’
J. Tourism, vol. 3, no. 11, pp. 14–24, 2018.
[31] A. Osello, G. Lucibello, and F. Morgagni, ‘‘HBIM and virtual tools: A new chance to preserve architectural heritage,’’ Buildings, vol. 8, no. 1, p. 12, 2018.
[32] W. Reinartz, M. Haenlein, and J. Henseler, ‘‘An empirical comparison of the efficacy of covariance-based and variance-based SEM,’’ Int. J. Res.
Marketing, vol. 26, no. 4, pp. 332–344, 2009.
[33] C. M. Ringle, D. Da Silva, and D. de Souza Bido, ‘‘Modelagem de equações estruturais com utilização do smartpls,’’ Revista Brasileira
and J. M. F. Rodrigues, ‘‘Multisensorial portable device for augmented reality experiences in museums,’’ Int. J. Educ. Learn. Syst., vol. 3, pp. 60–69, Apr. 2018.
[38] SM. (2019). Science Museum—Atmosphere Gallery. Accessed: Jun. 11, 2019. [Online]. Available: https://vimeo.com/20789653 [39] D. Turner, J. M. F. Rodrigues, and M. Rosa, ‘‘Describing people: An
inte-grated framework for human attributes classification,’’ in Proc. 21st
Cen-tury Int. Congr. Eng. Sustainability, 2019, pp. 324–336.
[40] TWSJ. (2019). The Wall Street Journal: Best Apps for Visiting Museums. Accessed: Jun. 11, 2019. [Online]. Available: https://goo.gl/cPTyP9 [41] N. Vainstein, T. Kuflik, and J. Lanir, ‘‘Towards using mobile, head-worn
displays in cultural heritage: User requirements and a research agenda,’’ in
Proc. 21st Int. Conf. Intell. Interfaces, 2016, pp. 327–331.
[42] V. Venkatesh, M. G. Morris, G. B. Davis, and F. D. Davis, ‘‘User accep-tance of information technology: Toward a unified view,’’ MIS Quart., vol. 27, no. 3, pp. 425–478, 2003.
[43] V. Venkatesh, J. Y. L. Thong, and X. Xu, ‘‘Consumer acceptance and use of information technology: Extending the unified theory of acceptance and use of technology,’’ MIS Quart., vol. 36, no. 1, pp. 157–178, 2012. [44] Vuforia. (2019). Vuforia. Accessed: Jun. 11, 2019. [Online]. Available:
https://www.vuforia.com/
[45] C.-S. Yu, ‘‘Factors affecting individuals to adopt mobile banking: Empir-ical evidence from the UTAUT model,’’ J. Electron. Commerce Res., vol. 13, no. 2, pp. 104–121, 2012.
[46] Z. Yuan, T. Bi, G. M. Muntean, and G. Ghinea, ‘‘Perceived synchroniza-tion of mulsemedia services,’’ IEEE Trans. Multimedia, vol. 17, no. 7, pp. 957–966, Jul. 2015.
JOÃO M. F. RODRIGUES received the degree in electrical engineering, in 1993, the M.Sc. degree in computer systems engineering, in 1998, and the Ph.D. degree in electronics and computer engi-neering from the University of Algarve (UAlg), Portugal, in 2008. He is currently an Adjunct Professor with the Instituto Superior de Engen-haria, UAlg, where he has been lecturing com-puter science and comcom-puter vision, since 1994. He is a member of the Associative Laboratory LARSyS (ISR-Lisbon) and CIAC (UAlg). He has participated in more than 18 financed scientific projects, four of them as PI. He is the coauthor of more than 190 scientific publications, including several books. His major research interests include computer and human vision, augmented intelligence, and human–computer interaction.
JOÃO A. R. PEREIRA received the degree in electrical and electronics engineering from the University of Algarve, in 2015, where he also received the master’s degree two years later in electrical and electronics engineering, specializing in technologies of information and telecommuni-cations. During his masters, he was involved in two research and development projects, where he has coauthored 14 publications.
JOÃO D. P. SARDO received the degree in elec-trical and electronics engineering, and the master’s degree in electrical and electronics engineering from the University of Algarve. He was involved in several research and development projects, where he has coauthored several publications.
PEDRO J. S. CARDOSO received the Ph.D. degree in the field of operations research from the University of Seville (USev), the M.Sc. degree in computational mathematics from the Univer-sity of Minho, and the degree in mathematics– computer science from the University of Coimbra. He teaches at the Instituto Superior de Engenharia, Universidade do Algarve (UAlg), since 1998. He has been involved in various scientific and devel-opment projects, and is the coauthor of more than 60 publications and an editor of four books. He is a member of LARSyS.
![Figure 1 presents the M5SAR’s system which has three main modules. The (a) server, depicted on the left side of the figure, where the contents for the AR and bundles (museum’s AR object markers – image descriptors) are stored, for more details see [35], [3](https://thumb-eu.123doks.com/thumbv2/123dok_br/18770026.923369/3.864.451.804.99.259/figure-presents-modules-depicted-contents-bundles-markers-descriptors.webp)