ESCOLA DE ADMINISTRAÇÃO DE EMPRESAS DE SÃO PAULO
KARIN CORINA HUACANTARA CHAMBI
DOES CORRUPTION INCREASE REWARDS IN LEGALLY REGISTERED FIRMS?
SÃO PAULO 2017
DOES CORRUPTION INCREASE REWARDS IN LEGALLY REGISTERED FIRMS?
Dissertação apresentado à Escola de Administração de Empresas de São Paulo, da Fundação Getulio Vargas como requisito para obtenção do título de Mestre em Administração de Empresas.
Linha de pesquisa: Estratégia Empresarial Orientador: Prof. Dr. Paulo Roberto Arvate
SÃO PAULO 2017
Chambi, Karin Corina Huacantara.
Does corruption increase rewards in legally registered firms? / Chambi, Karin Corina Huacantara. - 2017.
78 f.
Orientador: Paulo Roberto Arvate
Dissertação (mestrado) - Escola de Administração de Empresas de São Paulo. 1. Empresas - Corrupção. 2. Sociedades comerciais - Corrupção. 3. Corrupção administrativa - Brasil. I. Arvate, Paulo Roberto. II. Dissertação (mestrado) - Escola de Administração de Empresas de São Paulo. III. Título.
DOES CORRUPTION INCREASE REWARDS IN LEGALLY REGISTERED FIRMS?
Dissertação apresentado à Escola de Administração de Empresas de São Paulo da Fundação Getulio Vargas como requisito para obtenção do título de Mestre em Administração de Empresas.
Campo de conhecimento: Estratégia Empresarial
Data de aprovação: 20/02/2017 Banca examinadora:
_____________________________ Prof. Dr. Paulo Roberto Arvate (Orientador), FGV-EAESP
_____________________________ Prof. Dr. Rodrigo Bandeira de Mello FGV-EAESP
_____________________________ Prof. Dr. Klênio de Souza Barbosa FGV-EESP
Dedico este trabalho a Deus e a minha família por nunca ter me deixado desistir dos meus sonhos.
Agradeço a minha família, pelo apoio em todos os momentos da minha vida.
Ao meu orientador, Prof. Dr. Paulo Arvate, por me guiar no desenvolvimento deste trabalho. Aos membros da banca examinadora, Prof. Dr. Klênio Barbosa e Prof. Dr. Rodrigo Bandeira de Mello, por suas importantes contribuições na construção desta dissertação.
À Escola de Administração de Empresas de São Paulo - EAESP-FGV, por confiar em mim e me dar a oportunidade de alcançar este objetivo. Meu agradecimento aos professores, amigos e colegas da FGV, pelo aprendizado e troca de experiências.
Ao Programa Estudantes-Convênio de Pós-Graduação – PEC-PG, da CAPES/CNPq, pela concessão da bolsa de estudos e a oportunidade de cursar este mestrado.
“The first sign of corruption in a society that is still alive is that the end justifies the means.” (Georges Bernanos)
Recent research has highlighted the potential costs of corruption for firms. Empirical studies that investigated the impact of corruption on business activity have shown mixed results suggesting that the environment influences this relationship. On one hand, part of these studies has shown that corruption may improve business opportunities in poor governance environments. On the other hand, several studies have shown that, in general, corruption hurts the entrepreneurial activity and may have broader negative commercial effects.
The resource allocation is an essential part that allows firms to achieve specific goals associated with their performance; however, it may be affected by corruption. Thus, this study focuses on the resource allocation decisions within firms.
The aim of this study is to test the effect of corruption on the allocation of resources to employees in legally registered firms of Brazil. Following the Rational Choice Theory, we assume that private firms’ employees will engage in government corruption if they perceive greater rewards than the expected utility of not engaging in corruption. Hence, corrupt firms would have to give rewards to employees engaged in corruption because they run the risk of being caught and punished. These rewards would be paid in the form of high compensations or job stability. In that sense, we argue that corruption increases the rewards paid to employees in legally registered firms. We test our assumption employing a large sample of more than 100, 000 firms located across 480 Brazilian municipalities that were audited in the period 2005-2008. The empirical strategy consists in estimating the differential effect of allocation of compensation and tenure between sectors associated and not associated with corruption, and then estimating the effect of the level of corruption in municipalities on that allocation. Results suggest that firms from sectors associated with corruption pay higher compensation to their employees than those firms from sectors not associated with corruption. These results are specific to employees with compensation above the median compensation of employees in their firms. In addition, firms operating in more corrupt municipalities tend to allocate more compensation than those operating in less corrupt municipalities.
Pesquisas recentes têm destacado os custos potenciais da corrupção para as empresas. Estudos empíricos que investigaram o impacto da corrupção na atividade empresarial apresentaram resultados mistos sugerindo que o ambiente influencia essa relação. Por um lado, parte desses estudos mostraram que a corrupção pode melhorar as oportunidades de negócios em ambientes com governança deficiente. Por outro lado, vários estudos mostraram que, em geral, a corrupção prejudica a atividade empresarial e pode ter efeitos comerciais negativos mais amplos.
A alocação de recursos é uma parte essencial que permite às empresas alcançar objetivos específicos associados ao seu desempenho; no entanto, pode ser afetada pela corrupção. Assim, o presente estudo concentra-se nas decisões de alocação de recursos dentro das empresas. O objetivo deste estudo é testar o efeito da corrupção na alocação de recursos aos empregados de empresas legalmente registradas no Brasil. Seguindo a Teoria da Escolha Racional, assume-se que os empregados de empresas privadas irão assume-se engajar em corrupção assume-se perceberem recompensas maiores do que a utilidade esperada de não se engajar em corrupção. Assim, as empresas corruptas teriam que recompensar esses empregados porque correm o risco de serem descobertos e punidos. Essas recompensas seriam pagas sob a forma de altas remunerações ou estabilidade no emprego. Nesse sentido, argumentamos que a corrupção aumenta as recompensas pagas aos empregados em empresas legalmente registradas. O pressuposto é testado empregando uma grande amostra de mais de 100,000 empresas localizadas em 480 municípios brasileiros que foram auditados no período 2005-2008. A estratégia empírica consiste em estimar o efeito diferencial da alocação de remuneração e emprego entre os setores associados e não associados à corrupção, e estimar o efeito do nível de corrupção nos municípios nessa alocação.
Os resultados sugerem que as empresas dos setores associados à corrupção pagam uma remuneração mais elevada aos seus trabalhadores do que as empresas de setores não associados à corrupção. Estes resultados são específicos aos empregados com remunerações acima da remuneração mediana dos empregados em suas empresas. Além disso, em municípios mais corruptos, as empresas tendem a alocar mais remuneração do que aquelas empresas que operam em municípios menos corruptos.
1. INTRODUCTION ... 12
2. INSTITUTIONAL BACKGROUND ... 16
2.1. Corruption in Brazil ... 17
3. LITERATURE REVIEW AND HYPOTHESIS ... 18
3.1. Corruption and corrupt agents ... 18
3.2. Corruption and Business ... 21
3.3. Corruption affecting the allocation of compensation and tenure within firms ... 25
4. DATA AND EMPIRICAL STRATEGY ... 27
4.1. Data and Sample ... 27
4.2. Variables ... 33
4.3. Empirical strategy ... 39
5. MAIN RESULTS ... 41
5.1. The effect of an economic activity sector being corrupt or non -corrupt on compensation and tenure... 41
5.1.1. Is the compensation different between corrupt and non-corrupt sectors in municipalities without corruption cases? ... 43
5.2. The effect of the level of corruption on compensation. ... 53
6. DISCUSSION AND CONCLUSION ... 59
REFERENCES ... 63
Table 1. Classification of the size of companies according to their Annual Gross Operating
Revenue or Annual Income. ... 31
Table 2. Classification of the size of companies according to the number of employees. ... 31
Table 3. Description of variables ... 36
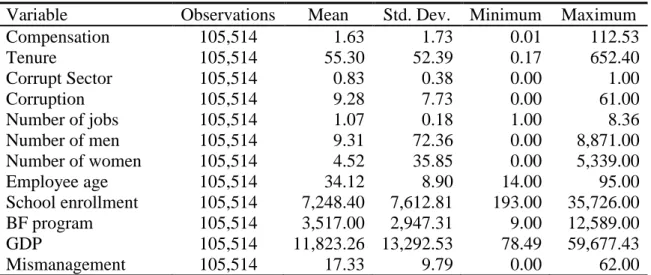
Table 4. Descriptive statistics ... 37
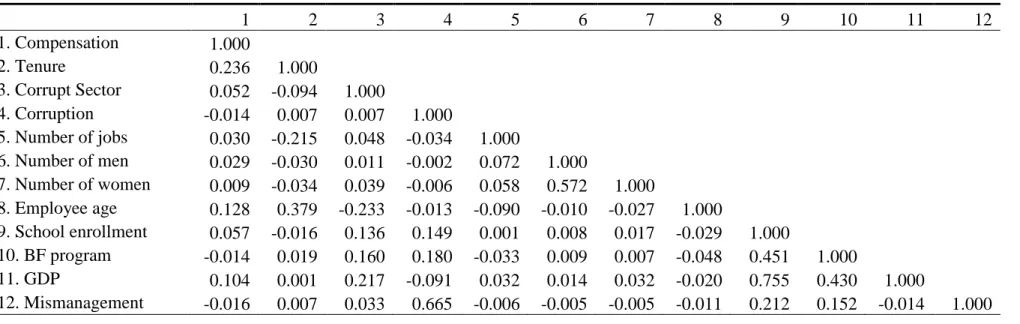
Table 5. Correlation matrix. ... 38
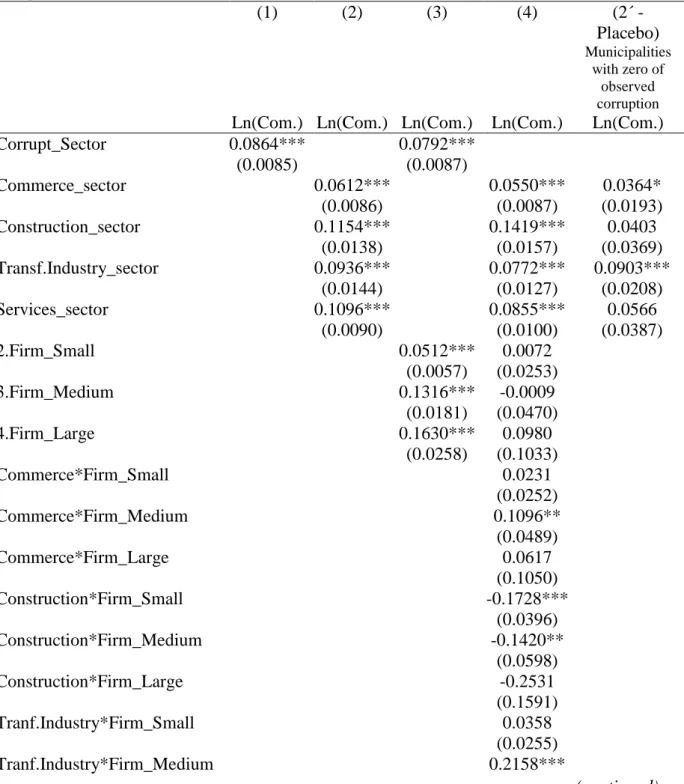
Table 6. The effect of an economic activity sector being corrupt or non-corrupt on employees’ compensation. ... 44
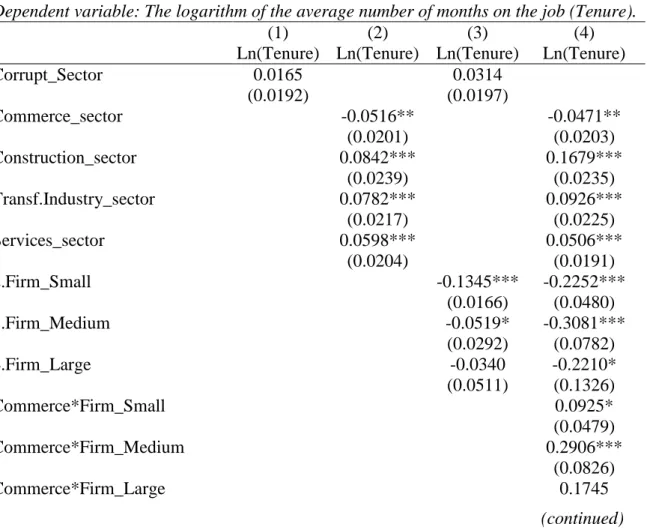
Table 7. The effect of an economic activity sector being corrupt or non-corrupt on tenure. ... 46
Table 8. The effect of an economic activity sector being corrupt or non-corrupt on the 10th percentile of the compensation distribution... 49
Table 9. The effect of an economic activity sector being corrupt or non-corrupt on the 50th percentile of the compensation distribution... 50
Table 10. The effect of an economic activity sector being corrupt or non-corrupt on the 90th percentile of the compensation distribution... 52
Table 11. The effect of the level of corruption on compensation... 54
Table 12. The effect of the level of corruption on the 10th percentile of the compensation distribution. ... 56
Table 13. The effect of the level of corruption on the 50th percentile of the compensation distribution. ... 57
Table 14. The effect of the level of corruption on the 90th percentile of the compensation distribution. ... 58
BNDES….National Bank for Economic and Social Development CGU…...Office of the Comptroller General
CNAE…...National Classification of Economic Activities GDP…...Gross Domestic Product
IBGE...Brazilian Institute of Geography and Statistics
INEP……. National Institute for Educational Studies and Research "Anísio Teixeira" IPEA……. Institute for Applied Economic Research
MTE…….. Ministry of Labor and Employment of Brazil OLS……... Ordinary Least Squares
RAIS…...Annual Report of Social Information
SEBRAE…Brazilian Service to Support Micro and Small Enterprises TI………...Transparency International
1. INTRODUCTION
The engagement of private agents in corrupt acts with government officials is a common problem in our society. Most arguments agree that firms become engaged in corruption in order to obtain some benefits (Collins, Uhlenbruck and Rodriguez, 2009; Iriyama, Kishore and Talukdar, 2016). Recent empirical studies on the effect of corruption on business activity have shown mixed results, where the environment has influenced them (Avnimelech, Zelekha and Sharabi, 2014; Bologna and Ross, 2015; Dreher and Gassebner, 2013; Dutta and Sobel, 2016). For example, Dreher and Gassebner (2013) find that corruption facilitates the firm entry in highly regulated economies. However, Avnimelech et al. (2014) find that corruption has a negative effect on entrepreneurship, but this effect is less strong in developing countries. Similarly, Dutta and Sobel (2016) agree that corruption hurts entrepreneurship, but it hurts less when a country has a bad business climate.
Although corruption may seem beneficial, by imposing additional taxes on firms it can distort the way that business decide to operate making them less efficient in terms of productivity (Olken and Pande, 2013). Scarce literature has shown that corruption may also have broader negative commercial effects affecting the efficiency of firms on indicators such as firm growth (Fisman and Svensson, 2007; Gaviria, 2002), productivity (Faruq, Webb and Yi, 2013) and management quality (Athanasouli and Goujard, 2015), but it has not shown how corruption may affect the allocation of resources to employees within firms. We investigate that impact by considering the allocation of compensation and tenure in legally registered firms of Brazil. Therefore, the aim of this study is to test the effect of corruption on the allocation of resources to employees (compensation and job tenure) in legally registered firms.
Following the Rational Choice Theory, we assume that employees of private firms will engage in corrupt practices with government officials if they receive greater rewards than the expected utility of not engaging in corruption, because they run the risk of being caught and convicted. These rewards would be paid in the form of high compensations or job stability (high tenure). Therefore, it is expected that corruption increases the rewards paid to employees, in any of the following forms: high compensations or high tenure in the companies. That is, firms from sectors associated with corruption, on average, allocate higher rewards than those from sectors not associated with corruption. In addition, in municipalities that presented more irregularities, on average, firms from sectors associated with corruption allocate more rewards to their
employees. In that sense, we intend to provide response to the next research question: Does corruption increase rewards in legally registered firms?
To address our research question, we use OLS robust regressions controlling for variables at the firm and municipality level for a large sample of firms operating across municipalities of Brazil. The sample was composed of more than 100,000 firms located throughout 480 municipalities (with up to 500,000 inhabitants) that were audited in the period 2005-2008, which corresponds to a four-year mandate for mayors of Brazilian municipalities.
Our database contains political, economic and social variables at the municipality-level, and socio-economic information at the firm level. The information at the firm-level was extracted carefully from the Annual Report of Social Information (RAIS) conducted by the Ministry of Labour and Employment of Brazil.
Another important information in this study is related to the measure of corruption that we employ. Most of the research that addresses the issue of corruption has faced challenges in relation to the measurement of this phenomenon due to their hidden nature and the reliance on perception-based measures, which may not measure corruption accurately (Olken and Pande, 2011). In order to overcome this issue, this study employs an objective measure of corruption based on audit reports carried out by the Office of the Comptroller General (CGU). Our corruption measure was developed by Arvate and Figueiredo (2016), and it is in line with those measures constructed by Ferraz and Finan (2008, 2011), Brollo, Nannicini, Perotti and Tabellini (2013) and Arvate and Tavares (2014). By using an observed corruption measure, we avoid reliability problems associated with measures of corruption based on perception.
Since municipalities can be audited multiple times (as part of the anti-corruption program carried out by the CGU), we consider the number of corruption events found the first year that municipalities were audited during our period of study (2005-2008) because this allowed us to use a greater number of municipalities which at least once were audited by the CGU. Each observation in the data corresponds to the year in which the municipality was audited. Thus, our data is cross-sectional.
The hypothesis is tested in the context of Brazil. This choice can be justified by three reasons. First, Brazil is one of the most decentralized among developing countries and it is expanding its presence in world markets. The total number of formal jobs grew by 65.7% from 2002 to 2012, and a large number of formal firms has been operating during that period. Second, since
2003 an anti-corruption program has been implemented in order to audit randomly selected municipal governments´ expenditures. Thus, it is important to rely on measures of corruption based on data from these audits. Third, this country has a representative number of states and municipalities (26 states, 1 federal district and more that 5,000 municipalities), which have autonomous administrations, follow not only state laws, but also federal laws, such as the Federal law 8666/1993, which regulates public procurements and prohibits public officials from engaging in corrupt practices.
Achieving the goal of this study is challenging, since there are a variety of factors influencing on decisions of firms. The problem of “omitted variables bias” and “selection bias” in observational data is a concern. We employ a large sample of firms located in municipalities that were randomly selected, which leads us to say that our sample was not selected subjectively. From this random selection, the economic activity sectors associated with corruption and the level of corruption of municipalities were defined. Moreover, we control extensively for observable variables both at the firm level and at the municipality level, including sector, audit-year, region and firm-size dummies, as well as interaction terms between firm size and sector in order to address the problem of omitted-variable bias. Unlike other studies that use some variables based on perception, this study relies on observable variables, which generally are not measured with error.
Our empirical strategy consists in identifying the differential effect of allocation of resources (compensation and tenure) between sectors associated and not associated with corruption (as classified in this study), and then verifying whether the level of corruption in municipalities interferes with that allocation of resources. In the first case we use a dummy variable indicating whether the sector of a firm was associated or not with corruption (as the main independent variable), while in the second case we consider the number of events of corruption found in the municipality.
Two indicators were considered as dependent variables to test our hypothesis: compensation and tenure. The estimates for the tenure variable did not show a robust effect. However, the results for the compensation variable were robust and statistically significant, which has supported our hypothesis. Moreover, receiving rewards in the form of high compensations would be more attractive for employees engaged in corrupt practices on behalf of their firms.
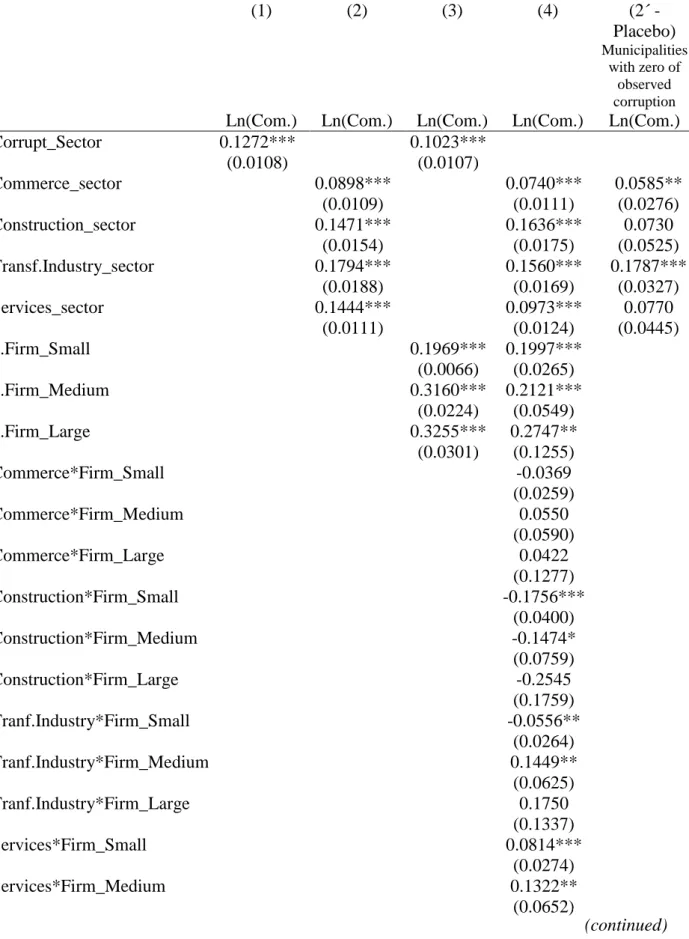
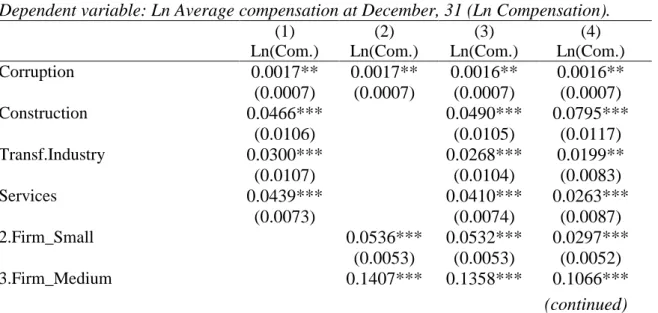
The findings show that firms from sectors associated with corruption allocate higher compensations to their employees than those firms from sectors not associated with corruption. That is, firms from sectors associated with corruption pay higher compensation (7.92% more or 0.13 more minimal wages) than those firms from sectors not associated with corruption. In addition, we find that the level of corruption in municipalities interferes with that compensation allocation. The compensation increases in 0.16% (or 0.002680 minimal wages), for a one unit increase in the number of corruption events committed in the municipality. That effect is small, but statistically significant. In other words, firms operating in more corrupt municipalities pay higher compensations to their employees than those operating in less corrupt municipalities. Moreover, when analyzed in terms of percentiles for the compensation distribution in firms (with others dependent variables based on percentiles), the effect remains robust and significant for employees with compensations above the median compensation of employees in their firms, which indicates that our results are specific for these employees. The results are also asymmetrically influenced by the firm size and the economic activity sectors (small and medium firms in some corrupt sectors pay more than the average compensation from their sector and vice versa).
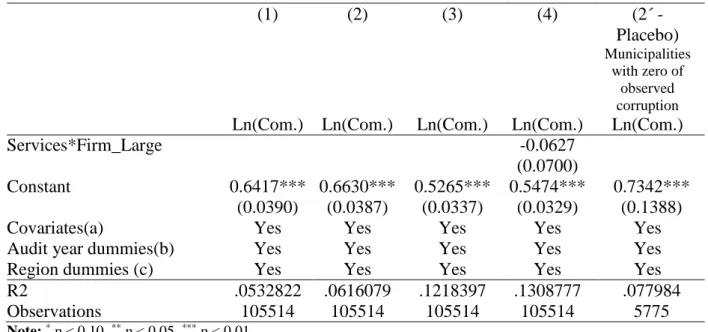
In order to corroborate that the differential effect found between sectors classified as corrupt and non-corrupt was due to the corruption committed in municipalities, we do a placebo test assessing the differential effect in municipalities that were audited and no irregularities were observed. The results indicate that there is no robust evidence that the differential effect was merely due to a differential established between sectors. We observed that three of four sectors associated with corruption do not show evidence of being different from non-corrupt sectors. Unlike these results in municipalities that presented irregularities, the results in this test indicate that the compensation allocation in the corrupt sectors with the highest compensations (Construction and Services sectors) is not different statistically to those sectors not associated with corruption.
This study contributes to the literature of corruption and business management by evaluating the impact of corruption on allocation of resources to employees in legally registered firms. Literature shows the effect of corruption on different indicators, including entrepreneurship (Avnimelech et al., 2014; Bologna and Ross, 2015; Dreher and Gassebner, 2013; Dutta and Sobel, 2016), firm growth (Fisman and Svensson, 2007; Zhou and Peng, 2012), productivity (Faruq et al., 2013; McArthur and Teal, 2002) and management quality (Athanasouli and Goujard, 2015). While these studies evaluate the impact of corruption on commercial behavior
of firms, they do not consider how corruption affects the resource allocation decisions to employees within firms. Another contribution of this study has been the construction of a unique data set with variables at the firm and municipality level, containing measures of corruption based on audit reports of municipalities that were selected at random.
The rest of this study is structured as follows: Section 2 presents the institutional background of Brazil. Section 3 describes the literature review and the research hypothesis. Section 4 details the construction of some variables and the data used in this study, as well as the research design. Section 5 presents the main results and offers results of a placebo test. Finally, Section 6 shows the main conclusions of this study.
2. INSTITUTIONAL BACKGROUND
Brazil is a decentralized country composed of twenty-six states and one federal district (Brasília). It has 5,570 municipalities across states. The number of municipalities differs between states, being Roraima one state with 14 municipalities (the least subdivided) and Minas Gerais with 853 (the most subdivided). The average number of municipalities per state is 214. For purposes of this study, it is important to know that, according with IBGE, in 2005, this country had 5,564 municipalities, 5,529 (99%) of which had population less than or equal to 500,000 inhabitants.
States and municipalities have autonomous task, collect taxes from their residents and receive funds from the Union and their States respectively (Articles 18, 145 and 159, Brazilian Federal Constitution of 1988). States are headed by governors, and municipalities by mayors, all of them elected through a majoritarian system.
Governments must consider the Federal law 8666/1993 (one of the most important national law) when they allocate contracts to private firms. This law regulates public procurements, and prohibits public officials from engaging in corrupt practices, as well as encouraging competition between firms in order to benefit the consumer with the best products and services at the best price.
This country also is grouped in five regions: Northern, Northeast, Central-West, Southeast and Southern. Such classification has been useful for research purposes, but also to define the distribution of federal funds.
There are economic and social differences between regions. The economic inequality in Brazil is still a serious concern. According to World Bank, the Gini coefficient1 in 2014 was 0.5148. The economic inequality among regions is also notorious. The Southeast and South regions are the most developed regions. These regions, in particular the Southeast (the richest region), are characterized by a high degree of industrialization and great concentration of population and riches, while the North and Northeast (the poorest region) are the less developed regions. The income inequality within regions (measured by Gini values) is as follows: North (0.504), Northeast (0.513, the most unequal region), Southeast (0.497), South (0.452) and Central-West (0.506).
In the last decades, Brazil reached an extremely large market size. It demonstrated its potential to ever further growth in the business sector. According to IBGE, the number of formal employees grew 65.7% from 2002 to 2012. There has been also an increasing number of companies. The number of companies during this period increased from 4 964 885 in 2002 to 5 195 250 in 2012 (Central Register of Enterprises (CEMPRE) of the IBGE).
Micro and Small enterprises play an important role in the economy of countries. According to Brazilian Service to Support Micro and Small Enterprises (SEBRAE), almost 99% of Brazilian companies are micro and small business. These small business account for more than a quarter of Gross Domestic Product (GDP) and there are nearly 9 million micro and small enterprises, which represent 27% of GDP. Brazilian small business also employee 52% of the formal labor force and account for 40% of the wage bill.
2.1. Corruption in Brazil
Corruption is a serious problem for economic development and it exists in all countries. It is widespread in developing countries and, Brazil is one of those countries that has experienced alarming scandals in recent years, involving government officials and business executives. According to Transparency International (TI), in 2015 Brazil worsened seven positions in the
ranking of perceived corruption in the world. That is, considering the scale from 0 (highly corrupt) to 100 (very clean), Brazil fall in the ranking, going from 43 points in 2014 to 38 points in 2015.Thus, in 2015 it was considered as one of the countries with the highest decreasing in the Corruption Perception Index (CPI), sliding to the 76th place (seven position down from 2014) among 168 countries.
Brazil, like many other Latin American countries, has suffered from high levels of corruption. Corruption has been a critical and persistent problem for many years, and has become a deep concern for governments, investors and citizens. Thus, in order to deal with this problem, since 2003, the Brazilian government has implemented an anticorruption program through of the Office of the Comptroller General (CGU or Controladoria Geral da União). Every year the CGU selects municipalities at random to audit their expenditures of federally transferred funds in different areas such as Education, Health, Agriculture, and Others. Then it makes available audit reports on the internet. The program actually considers municipalities with up to 500,000 inhabitants, which represent 99% of all Brazilian municipalities. According to CGU, 780 municipalities were audited in the period 2005-2008, many of which multiple times.
Ferraz and Finan (2008, 2011), Brollo, Nannicini, Perotti and Tabellini (2013), Arvate and Tavares (2014), and Arvate and Figueiredo (2016), based on these CGU´s audit reports, constructed and used new measures of corruption. By using observed corruption measures, it was avoided the use of perception-based measures, which are associated with reliability problems.
3. LITERATURE REVIEW AND HYPOTHESIS 3.1. Corruption and corrupt agents
Corruption has been defined in many ways. This study follows the definition of Macrae (1982), who refers to corruption as a private exchange arrangement between two parties (the “demander” and the “supplier”), which: (1) has an influence on the allocation of resources either immediately or in the future, and (2) involves the use or abuse of public or collective responsibility for private ends. He also refers that the conclusion of an “arrangement” implies
the expectation of a net gain for both parties, where the form of the gain varies considerably according to the circumstances of the negotiation.
Corruption can exist not only within activities of the public sector or private sector, but also within activities involving agents from both sides. Amundsen (1999) argues that corruption is a particular state-society relationship. Those parts involve on the one side public officials and on the other side any individual, firm, or non-governmental organization. In line with this argument, Ndikumana (2013) claims that corruption arises from both relations between the private sector and the public sector, similar to Rose-Ackerman (1997). Government usually is looking to contract the production of a good to a private firm, and during the procurement process, a firm may gain the government´s contract through bribes and/or agreements with public officials in order to get benefits. Ferraz and Finan (2008, 2011), based on audit reports on Brazilian local governments, find that the most common forms of irregularities are associated with fraud in procurements, diversion of funds, and over invoicing of public goods and services.
In this study, corruption refers to these practices mentioned above, which involve arrangements between local governments and private business actors who stand to benefit from gains resulting from corrupt agreements (e.g. corrupt transactions). This implies that corruption occurs when, on one side, one or more public officials accept or solicit bribes (private gains), and on the other side, one or more agents from private firms offer and/or give bribes to win government contracts or facilitate business operations. Nevertheless, corruption also occurs even if the bribe does not take place, that is, when public officials abuse the public office for private ends (e.g. political support) through patronage benefits such as the allocation of a public procurement contract to a private firm (World Bank, 2003).
Governments and private firms may be attracted to engage in corrupt practices, as long as they obtain benefits. Johnson (1975) argues that governments can use private firms to collect a corruption tax. According with him, “private firms will collect such a tax by obtaining monopoly rights cum special concessions from the government and will share in the tax proceeds by not handing over (as bribes, gifts, etc.) all the monopoly rents realized” (Johnson, 1975: 55). Such a situation would be beneficial for both parties. Thus, firms operating in corrupt environment will have more incentives to reward and promote employees who have a positive attitude toward corruption.
A number of studies have sought to understand which conditions lead firms to engage in corruption. Tonoyan, Strohmeyer, Habib, and Perlitz (2010) argue that poor enforcement and lower efficiency of economic institutions and legal institutions foster the entrepreneur’s likelihood of engaging in corrupt practices. Dass, Nanda and Xiao, (2016) show that the local cultural environment in an important factor on economic activity. They show that managers of firms operating in places with more public corruption are likely to engage in more corrupt practices. Moreover, they suggest that firms located in corrupt environments are likely to engage in corrupt practices elsewhere, while researchers likeCollins et al. (2009) find that firms whose executives have social ties with government officials are more likely to engage in corruption. Collins et al. (2009) state that executives are likely to rationalize such behavior as a necessity to make their company more competitive. They also argue that firms that engage in corrupt transactions seek to reduce the uncertainty in their environment. In addition, Iriyama, Kishore and Talukdar (2016) find that firms use corruption to gaining competitive advantage when they perceive threats from informal and foreign firm rivals.
Some works emphasize ethical situations in organizations associated with the belief that “the ends justify the means” (Campbell and Göritz, 2014; Charles, 2007; Tonoyan, Strohmeyer, Habib and Perlitz, 2010). These studies suggest that firms may also engage into corruption justified by the need for market dominance at any cost. However, employees in these firms may get involved in corruption, justified by the need to increase their incomes. It was noted that individuals at the helm of companies are self-interested and can be expected to engage in corruption (at the firm-level) in ways to maximize their personal benefits rather than the firm´s performance (Morrison and Milliken, 2004; Pinto, Leana and Pil, 2008).
Therefore, corrupt practices can benefit both the individual and the firm (Wheeler and Rothman, 1982). Employees in companies with aggressive bonus structures may be encouraged to involve in corrupt practices (i.e. offering bribes to secure contracts on behalf of the organization). These employees would be expected to seek to maximize their individual utilities, ignoring firm performance at the long run.
As we have seen, there may be many possibilities for corruption to take place; the environment, the poor enforcement and lower efficiency of economic institutions as well as the behavior and attitude to corruption of executives and managers of firms are crucial factors. Whatever the factors that lead firms to engage into corruption, the fact remains that corrupt agents seek to maximize benefits for their firms and themselves in some way.
3.2. Corruption and Business
Empirical studies on the effect of corruption on business activity have shown mixed results and the environment influences them (countries with weak and strong regulation, developed and developing countries).
Researchers have argued that corruption facilitates and helps to improve the entrepreneurial activity in countries where institutions are both weak and inefficient. By allowing private sector agents to avoid cumbersome regulations in exchange for bribes or dishonest agreements, corruption can promote efficiency and improve business opportunities (Huntington, 1968; Leff, 1964; Méon and Weill, 2010). This argument is known as the “grease the wheels” hypotheses, and some empirical studies have supported it (Denis and Parfait, 2014; Dreher and Gassebner, 2013). For example, based on information from 43 countries over the 2003-2005 period, Dreher and Gassebner (2013) find that a larger number of procedures required to start a business as well as larger minimum capital requirements are harmful to entrepreneurship. As their main contribution, they tested whether corruption can be an efficient grease reducing the negative impact of regulations on entrepreneurship. They observe that at the maximum level of regulation, government corruption increases entrepreneurial activity. In that way, they conclude that corruption facilitates firm entry in highly regulated economies.
On the other hand, literature suggests that, in general, corruption is harmful for entrepreneurial activity. This strand has revealed that corruption has negative and detrimental consequences on business activities (Avnimelech et al., 2014; Dutta and Sobel, 2016).
Avnimelech et al. (2014) using a data set for 176 countries, conclude that countries with high levels of corruption usually face low levels of productive entrepreneurship, and that this effect is stronger in developed countries than in developing countries. That is, corruption is less detrimental in developing countries. Similarly, Dutta and Sobel (2016) employing information about entrepreneurial initiatives for 104 countries, find that corruption hurts entrepreneurship, and that negative effect is smaller when business climates are bad. In other words, they find that corruption hurts entrepreneurship, but it hurts less when a country has a bad business climate.
Additionally, unlike those studies mentioned above, Bologna and Ross (2015) employing measures of corruption based on data from audit reports of Brazilian municipal governments2, estimate the effect of corruption on changes in business activity in the short term (2003-2007 and 2008-2012) and in the long term (2003-2012). They observe that higher levels of corruption are generally associated with reductions in the number of business establishments in any interval of time, and that effect can be insignificant or positive conditional on the existence of low levels of institutional quality. That is, the negative effect of corruption is weaker at lower levels of institutional quality and becomes positive and significant with the worst indices of institutional quality3 (1 and 1.4). For example, in municipalities with lower levels of institutional quality (1.4), a one-unit increase in corruption increases growth in the formal sector by about 5.9 establishments (considering changes over the 2008-2012 interval). The authors argue that these latest results are consistent with the “grease the wheel” hypothesis, since that corruption improves the business opportunities in environments with poor institutional quality. These studies previously mentioned have addressed the issue of corruption on business activity from an external perspective (at macro level). However, it is important to know the microeconomic costs of corruption to business.
A small body of literature has also highlighted the microeconomic costs of doing business corruptly. In order to explore the potential costs of corruption at firm level, some studies has sought to quantify them. Svensson (2003), for instance, observes that in Uganda, the costs of paying bribes to government officials represent 8% of total costs of firms. For him, public officials act as price discriminators, and prices of public services are partly determined in a bargaining process, where firms’ outside options matter.
Olken and Barron (2009) investigate 304 trips transporting goods to and from Aceh in Indonesia. They show that costs of paying bribes to public officials account for about 13% of the trip cost, which exceeds the total wages received by the truck drive and his assistant. They also show that corrupt public officials practice several types of price discrimination (e.g. according to the willingness to pay of truck drivers: newer trucks, carrying valuable cargo) as stressed by Svensson (2003) although for him corruption has not a significant effect on firms’
2 Bologna and Ross (2015) employ measures of corruption constructed by Ferraz and Finan (2008, 2011) for a
sample of 476 municipalities audited in 2003.
3 These last results refer to interactions between corruption and institutional quality. Institutional quality takes
values from 1 (poor institutions) to 6 (superior institutions). They show marginal effects when institutional quality takes 1, 1.4, 3, 4.5 and 6 values.
performance. Similarly, Sequeira and Djankov (2014) investigate the impact of corruption on firm-level trade costs in two ports: Maputo, Mozambique and Durban, South Africa. They observe that in Maputo, the bribe payments represent 14% of total shipping costs, while only 4% in Durban.
In spite of initial costs of corruption on firm profitability, corruption may not be harmful to firms´ performance, as found by Svensson (2003). For Svensson (2003), corruption may not be damaging for firm performance because more profitable firms may be more attractive for corrupt government officials. For Galang (2012) the fact that a firm benefits from government corruption does not mean that corruption can be benign.
A recent body of research suggests that corruption may have broader negative commercial effects for firms on indicators such as firm growth (Fisman and Svensson, 2007; Gaviria, 2002), productivity (Faruq et al., 2013; McArthur and Teal, 2002) and management quality (Athanasouli and Goujard, 2015).
Fisman and Svensson (2007) employing a data set for Ugandan firms, find that rate of taxation and bribery has a negative impact on firm growth (as measured by sales trends). Their results indicate that one-percentage point increase in the bribery rate reduce the firm growth by about 3.3 percentage points, while that one-percentage point increase in the rate of taxation reduce the firm growth by about 1.5 percentage points. Thus, they conclude that corruption has a stronger negative impact on firm growth than taxation. These results suggest that corruption imposes serious constraints for business.
In a similar vein, Faruq et al. (2013) using regression analysis with instrumental variable and employing a sample of 909 firms from manufacturing sectors over 12 years in Ghana, Kenya and Tanzania estimate the effects of corruption and bureaucratic quality on productivity of firms. They find that corruption has a greater negative impact on firm productivity than bureaucratic quality, and that firms operating in more corrupt countries are less efficient in terms of production than those firms in less corrupt countries. These results are in accordance with those of McArthur and Teal (2002), who find that corruption substantially reduces the productivity of African firms by 20% of the output per worker, and that firms located in countries with high level of corruption are about 70% less efficient than firms in countries with lowest levels of corruption.
Athanasouli and Goujard (2015), employing a sample of 1355 firms in 2009 investigate the impact of the regional corruption on the management quality of firms within the manufacturing sector in Central and Eastern Europe. They use data measuring management practices from the Management, Organization and Innovation (MOI) Survey, and measure of corruption based on the Business Environment and Enterprise Performance Survey (BEEPS) conducted by the EBRD and the World Bank. Their results suggest that firms located in more corrupt regions, tend to have lower management quality, a more centralized process, as well as a lower level of education among administrative staff. These latest studies suggest that corruption negatively affects the firm efficiency and, as consequence, the national productivity.
Studies showed that firms dependent on government contracts may adopt less efficient management practices in corrupt environments (Athanasouli and Goujard, 2015; Faruq et al., 2013). However, there may be some differences in the results when the effect of corruption on firm growth is evaluated considering the size of the firm (Zhou and Peng, 2012).
For Zhou and Peng (2012), bribery may hurt firm growth for small and medium firms, but not for large firms. They argue that large firms may strategically engage in corruption, while small firms are forced to do it. Similar to Fisman and Svensson (2007) and Gaviria (2002), Zhou and Peng (2012) also measure firm growth as the firms’ sales growth. Their results are based on data from the World Business Environment Survey (WBES) implemented by the World Bank during 1999-2000. The sample they use contains 2,686 firms from 48 different countries around the world. These firms have different sizes and belong to different industries. They conclude that corruption is detrimental on firm growth only for small firms, but not for large firms. Most studies in literature agree that corruption is detrimental to firms’ efficiency. Initial costs of corruption for firms may be significant, as suggested by Olken and Barron (2009) and Sequeira and Djankov (2014), but in spite of this, these costs may not reflect the negative consequences of corruption on firm performance, as noted by Svensson (2003). Recent empirical studies that evaluated the effect of corruption on firm-level efficiency suggest that corruption has a negative effect. However, little is known about its influence on firms’ decisions. As suggested by Olken, and Pande (2013), corruption may distort the way that companies decide to operate, by making them less efficient and productive. This study is going to evaluate the impact of corruption within firms, but considering the effect on the allocation of resources to employees in legally registered firms.
3.3. Corruption affecting the allocation of compensation and tenure within firms
Although the literature explores the effect of corruption on entrepreneurial activity and firm behavior, we did not find studies that analyze this effect within firms, more specifically the impact of corruption on allocation of compensation and tenure (employment duration) to employees within firms.
The allocation of resources is a fundamental activity that allows firms to achieve specific goals associated with their performance, but corruption can distort it. Private firm agents play an important role in these allocation decisions.
It is believed that firm-level corruption can occur if individuals, often those at the helm of a company are motivated to engage in corrupt acts in exchange for personal gains (Morrison and Milliken, 2004; Pinto, Leana and Pil, 2008). Executives, managers and other individuals may be involved in corrupt acts to attain firm-level goals that result in higher compensation for themselves, or that, in order to reach certain organizational goals, managers feel under pressure and motivate others employees to engage in corrupt acts in exchange for private benefits. Such private benefits would be granted to employees as a reward for participating in corrupt acts because corruption is an illegal activity, which is reprehensible.
Corruption is a crime in many countries (such as USA, UK, Germany, Peru, Brazil, Mexico and Chile), and corrupters and corruptees are punished. Brazil4 is one of those countries where executives, managers and other employees were arrested for participating in corrupt practices (Connors, Jelmayer and Kiernan, 2015; Segal, 2015). However, it is important to consider that the corrupt practices are not always reported and offenders are not always convicted or punished severely. An effective judicial system is crucial to prosecute public officials and private firm agents involved in corruption.
The Rational Choice Theory emphasis that the crime decision is a rational process which the offender weights a risky choice in which the individual will engage on crime if the expected
4 Corruption is a crime in Brazil. The law 8,666/1993 is one of the most important national law that provides for
the accountability of both private parties and public officials. Under this law, offenders are subject to penalties. The Law 12,846/2013 is a recent Anti-Corruption law that provides for the accountability of companies and their managers. There are also other laws related to corruption in Brazil such as the Law 8,884/1994 (On repression of violations against the Economic Order), Law 1,079/1950 (On the Responsibility Crimes Procedural), and Law 9,034/1995 (On the prevention and repression of criminal organizations’ activities).
utility from committing the crime is greater than the expected utility from refraining from committing the crime (Becker, 1968).5 6 The probability of detection and sanctions are mechanisms that increases the individual´s cost to commit a crime. If the individual is risk-averse, the effect of severity of the sanction is more effective for the reduction of crime than the probability of detection. We expect the contrary for risk-lovers.
In that way, following Becker (1968) approach, it is assumed that private firms’ employees will engage in corrupt acts with government officials if they perceive greater rewards (high compensation or job stability) than the expected utility of not engaging in corruption. Hence, corrupt firms would have to reward workers who participated in corruption on behalf of the firm, because these employees run the risk of being caught and convicted. The rewards would be paid in the form of high compensations or high employment duration (job tenure). In that sense, corruption will affect the allocation decisions of firms in a non-efficient way, which is also in line with the literature that has suggested that corruption increases costs for firms and can affect their operational decisions, making them less efficient in terms of productivity (Faruq et al., 2013; Fisman and Svensson, 2007; McArthur and Teal, 2002).
In sum, the corruption is expected to increase the rewards paid to employees, in any of the following forms: high compensations and/or high tenure. The allocation of resources to employees will be affected in firms from private sector, in particular in firms from sectors associated with corruption. By allocating high compensation to those employees who participated in corrupt practices, on average, firms will present high compensations. By keeping the job of those employees who participated in corruption on behalf of the company and those employees who know the corrupt practices, on average, firms will have high tenure. Thus, the following hypothesis is suggested:
Hypothesis: Corruption increases the rewards paid to employees in legally registered firms.
5 The criminology literature attributes to Cornish and Clarke (1986) the foundation of RCT. However, Loughran
et al. (2016) emphasizes the seminal development of Becker (1968).
6 The rational choice for an individual j can be seen by the equation: E(Uj) = pjUj(Yj-fj) + (1-pj)U(Yj); where
E(Uj) is the individual ´s expected utility of crime (j); p is the probability of detection; Yj are the benefits that individual obtain after the successful of crime; and f is the severity of sanction that the individual receives if it is apprehended.
4. DATA AND EMPIRICAL STRATEGY 4.1. Data and Sample
This study employs information at firm-level from the Annual Report of Social Information or Relação Anual de Informações Sociais (RAIS Migra) from the Ministry of Labour and Employment of Brazil, and information at municipality-level from INEP, CGU, IPEA, TSE and IBGE. RAIS Migra data was extracted carefully and logically before to be incorporated into our main database. Next sections detail the data extraction process from RAIS and the description of variables.
From GCU reports, we use corruption and mismanagement measures, which were developed by Arvate and Figueiredo (2016) in line with Ferraz and Finan (2008, 2011), Brollo, et al. (2013), and Arvate and Tavares (2014)7. Both, corruption and mismanagement measures followed the same methodology and were based on the same audit reports available on the CGU website (reports). Moreover, since municipalities can be audited multiple times, we consider the number of corruption events and mismanagement observed the first year that municipalities were audited during our period of study because this allowed us to use a greater number of municipalities, which at least once were audited by the CGU. Each observation in the data corresponds to the year in which the municipality was audited. Thus, our data is cross-sectional. The considered period is from 2005 to 2008. We consider firms operating in municipalities that were audited in that period, which corresponds to a four-year mandate for mayors of Brazilian municipalities. The period was chosen because the data were complete and rich for that interval of time (RAIS data and corruption measure). Moreover, it was considered that CGU reports, which began to be produced in 2003 as part of the anti-corruption program, could have included more detailed information in the following years (since 2005).
Our full sample was composed of 144,444 firms with different sizes and economic activities, all of them located throughout 525 audited municipalities (with up to 500,000 inhabitants) and with business activity in the period 2005-2008. However, there were missing values for some characteristics of municipalities (information on mayor´s gender and level of education).
7 Arvate and Tavares (2014), in line with the definition of corruption by Ferraz and Finan (2011), codified the
irregularities into categories of corruption similar to those used by Brollo, et al. (2010), but they only considered some specific items to the Health sector. Arvate and Figueiredo (2016) re-classified those measures evaluating all sectors.
Excluding missing observations, our last sample was composed of 105,440 firms located throughout 480 audited municipalities from 2005 to 2008.
Of the total firms considered, 1,370 firms operated in more than one municipality. Thus, the breakdown of firms located in audited municipalities is as follows: 21,266 firms in 116 municipalities in 2005, 30,910 firms in 134 municipalities in 2006, 34,542 firms in 133 municipalities in 2007 and 18,796 firms in 97 municipalities in 2008. This information is consistent with all the data, which contains 105,514 observations.
4.1.1. RAIS Data extraction
The Annual Report of Social Information or Relação Anual de Informações Sociais (RAIS) is a matched employer-employee dataset from the Ministry of Labor and Employment of Brazil (MTE). It contains detailed information of all formal workers from Brazil. Each year, the MTE in order to regulate and control the Brazilian labor market, requires all legally registered firms to provide socioeconomic information on all formally employed workers. This declaration is mandatory for all companies including public administration organs and natural persons who have employed any worker in the previous year. Only the individual entrepreneur who did not employ workers the previous year is exempt from this declaration. Thus, a failure to deliver on these obligations is going to result in fines for the employer without exempting him from the obligation.
RAIS is also considered a census, which provides reliable statistical sources on the Brazilian formal labor market, for instance, the number of new formal jobs, which sector hired more workers, and other information on formal sector job.
Each year, employers report information on the characteristics of their workers as well as the characteristics of the job. All information is registered by worker, including a unique identifier for him. RAIS includes a unique identifier for the firm, as well as information about its economic activity, location and legal nature. Our main variables of interest are the compensation at December 31 expressed in number of minimal wages, the job tenure in months, the number of jobs for the worker during the year, the gender, the age, the economic activity of establishment classified according to National Classification of Economic Activities (CNAE 2.0) and the location of the worker´s establishment.
Taking into account the distribution of the firms by sectors is very important since there are sectors where the competition is intense and firms may need to reduce costs in order to improve their competitiveness.
The main information related to the economic activity of firms consists of two categorical variables: groups of economic activity sectors and economic activity sector (classification CNAE 2.0). Information about Groups of economic activity sectors includes six categories: Agriculture, Commerce, Construction, Industry, Services and Others/Ignored (auxiliary financial services, sales agents and representatives, maintenance and repair of vehicles, and other activities like recreational and sporting services). This classification groups all sectors of the economy, and it is used by the Statistics Brazilian System. The economic activity sector variable initially included nine sectors, but we excluded the public sector (Public Administration), because it was not considered part of the study. Then, we focus on eight sectors, which are Agriculture, Commerce, Construction, Mineral Extraction, Transformation Industry, Industrial Services of Public Utility, Services and Others/Ignored. In terms of groups of economic activity, the Industry group includes Mineral Extraction, Transformation Industry and Industrial Services of Public Utility sectors. The 08 sectors are also divided into 25 subgroups or subsectors, but in this study, economic activity sectors were considered according to available information for corrupt sector variable that will be explained in section 4.1.4. Since there is a unique identifier for the firm, we extract our variables of interest for every firm in every year from 2005 to 2008. Moreover, firms that were not registered for all years during that period were excluded, as well as registered workers who were less than 14 years old. In order to make good analyzes, different statistical measures were considered during the extraction process. For instance, we observed that some firms had registered more than one economic activity in their municipalities. To deal with these cases, and in order to extract summarized information by firm and by municipality, we calculate the mode of the economic activity for each firm, that is, the economic activity where the firm registered the highest number of employees.
To extract the compensation and the job tenure variables, it was considered that employees occupy different positions in a company, and that the job tenure varies among employees, and therefore, the distribution of both compensation and job tenure (employment duration) presents high variance among employees in a firm. In order to get a better view of the results using these
variables, we use different measures of location such as mean, median and others percentiles to extract both variables. That is, the mean and the ith percentile of both variables for the firm i located in the municipality j. The 90th percentile of the compensation variable indicates the compensation at which 90% of the employees in a firm have earning below it, and probably this value reflects the compensation of those employees with high positions in the firm. The 10th percentile of the tenure variable indicates the number of months at which 10% of the employees in the firm have months of being recruit below it, and this value reflects the tenure (employment duration) of those employees that were newly recruited in the firm.
To extract the number of jobs and age variables, we calculate the mean of these variables for each firm in each municipality similar to the other variables. Based on the gender variable, it was possible creates two new variables to know the number of male and female employees in each firm. To extract the location of the worker´s establishment, it was sufficient to keep the information of the first row because this information is the same for any employee in a firm. Finally, once the variables were extracted for each firm in each municipality, all data was joined to the main database (data at the firm and municipality level). There were firms whose average compensation and job tenure were equal to zero. These firms were excluded, because it was considered information that could have been erroneously reported.
4.1.2. Firm expansion variable
As mentioned above, RAIS includes a unique identifier for the firm. This identifier allows us track whether the firm operates in different municipalities and/or states. Based on this identifier, we create a new dummy variable, which indicates 1 if the firm operates in two or more municipalities of Brazil, and 0 otherwise.
4.1.3. Firm size variable
Firm size is an important factor that may influence the allocation of resources in firms. To create this variable, it was important to consider the most common criteria for the classification of firms in Brazil. There are two most common criteria to classify companies. BNDES, SEBRAE and IBGE adopted criteria that are commonly used as national reference. According with these criteria, companies are classified by the number of employees or by the annual gross operating revenue. The BNDES (National Bank for Economic and Social Development) has adopted the classification by the annual gross operating revenue. This is an important parameter to define a
company´s size. However, the classification by the number of employees adopted by the Brazilian Institute of Geography and Statistics (IBGE) and the Brazilian Service to Support Micro and Small Enterprises (SEBRAE) is used most often for research purposes. This classification would be advantageous due that the number of employees tends to be more easily available information and perhaps less constrained. Tables 1 and 2 show the business classification according to the two above-mentioned criteria.
Table 1. Classification of the size of companies according to their Annual Gross Operating Revenue or Annual Income.
Classification Annual Gross Operating Revenue or Annual Income.
Micro Up to BRL 2.4 million.
Small Over BRL 2.4 million and less than BRL 16 million.
Medium Over BRL 16 million and less than BRL 90 million.
Medium-Large Over BRL 90 million and less than BRL 300 million.
Large Over BRL 300 million.
Source: Website from BNDES. Consult in 10.11.2016
http://www.bndes.gov.br/wps/portal/site/home/financiamento/guia/quem-pode-ser-cliente
Table 2. Classification of the size of companies according to the number of employees.
Classification Sector
Industry Commerce / Services
Micro Up to 19 Up to 9
Small From 20 to 99 From 10 to 49
Medium From 100 to 499 From 50 to 99
Large 500 or more 100 or more
Source: Website from SEBRAE and IBGE. Consult in 10.11.2016
http://www.sebrae-sc.com.br/leis/default.asp?vcdtexto=4154
In several of the studies, the number of employees was used as the measure of firm size (Hancock, Allen, Bosco, McDaniel and Pierce, 2013; Nguyen, Le and Bryant, 2013; Devicienti,
Fanfani and Maida; 2016). In this study, the number of employees was used to measure firm size. To create this variable, it was adopted the criteria of classification proposed by the IBGE/SEBRAE, as detailed above. This classification considers not only the number of employees, but also the economic activity sector of the firm, which is useful to distinguish companies with more similar characteristics.
Taking into account the classification by the number of employees detailed in table 2, and considering the six groups of economic activity mentioned in section 4.1.1. (Agriculture, Commerce, Construction, Industry, Services and Others/Ignored), it was created the “Firm Size” variable. The groups of economic activity sectors “Construction”, “Agriculture” and “Others/Ignored” were classify in the same way as the Industry group. The number of firms according to their size and sector can be found in appendix A.
4.1.4. Corrupt sector variable
The data used to create this variable were based on a sub-sample of firms involved in corruption, which were listed in CGU audit reports (those reports that were used in the construction of our measure of corruption). We looked at 156 municipal audit reports carried out by CGU, 111 of which reported in 2005 and 45 in 2006. In these reports, we found 350 firms involved in corrupt acts, but in data RAIS it was possible to identify the economic sectors for 259 firms. Descriptive statistics for the sector and size of these firms are presented in appendix B.
As mentioned previously, information about sector of economic activity in RAIS database refers to eight sectors (excluding the Public Administration sector), which are divided into 25 subsectors (by IBGE). We focus on these sectors and create a dummy variable that equals one if a sector is associated with corruption, and zero otherwise.
Descriptive statistics reveal that the economic sectors of the sub-sample of firms involved in corrupt practices are Commerce (56.7%), Construction (30.1%), Services (8.1%) and Industry Transformation (5.0%) (for more detail please see “Appendix B”). Information about the subsectors is scattered across firms (259 firms), which does not allow us to classify properly taking into account sub sectors. Descriptive statistics also reveal that firms involved in corruption could be of different sizes (micro, small, medium and large).
Once we had identified the economic activity sectors of firms, we created the dummy variable, in which the four economic sectors associated with corruption (Commerce, Construction, Services and Industry Transformation) took the value of 1, and 0 otherwise.
The value of 0 was assigned to any of the remaining four sectors not associated with corruption. These sectors are Agriculture, Mineral Extraction, Industrial Services of Public Utility and Others/Ignored (auxiliary financial services, sales agents and representatives, maintenance and repair of vehicles, and other activities).
4.2. Variables
Estimating the effect of local corruption on the resource allocation of firms is complicated because it is influenced by a variety of factors, which are connected with the situation of a given country, the financial situation of companies, and other factors influencing on decisions of firms. We use valuable information and control for variables at the firm and municipality level.
4.2.1. Dependent variables
To estimate the effect of corruption on resources’ allocation, two dependent variables were considered at the firm-level. The first variable is the average compensation expressed in number of minimal wages at December, 31, and the second depended variable is the average tenure expressed in number of months. Both variables were extracted from RAIS, and for further analysis, depending of first results, we will use the ith percentile of the compensation distribution in firms (as mentioned in section 4.1.1).
In order to get a better fit of our proposed regression model, we use the logarithmic transformation for both dependent variables (natural logarithm). By transforming the dependent variable when residuals have skewed distribution, it is possible to use ordinary least-squares estimators (OLS), greatly reducing the concern about the normality assumptions for linear regression. The purpose of a transformation is to obtain residuals that are approximately symmetrically distributed (Wooldridge, 2015).
For the first analysis, we use as main independent variable a dummy variable that indicates whether the economic activity sector of a firm is associated or not with corruption. Corrupt sectors are Commerce, Construction, Services and Industry Transformation. In these analyses, we also consider disaggregated sectors as main independent variables.
For secondary analysis, the main independent variable is the number of corruption events or irregularities detected in the municipality. Arvate and Figueiredo (2016), as mentioned above, developed this variable. Their measure of corruption is based on randomized audit reports from an anticorruption program implemented by the CGU (as mentioned in Section 4.1).
4.2.3. Covariates
Covariates at the firm-level were included in order to control for heterogeneity across firms. Larger firms may pay higher wages for employees (Gomez-Mejia et al., 1987; Dahl and Klepper, 2015). Studies has found that larger firms are more efficient (Oczkowski and Sharma, 2005) and contract features are influenced by determinants such as firm characteristics, economic activity sector and tenure (Stathopoulos, Espenlaub and Walker, 2004; Tran, 2011). The information at the firm-level was collected from the Annual Report of Social Information or Relação Anual de Informações Sociais (RAIS Migra). They include: the average number of jobs of employees during the year, the number of men and women employees, the average age of employees, the firm expansion, the economic activity sector of the firm (a set of dummy variables indicating the economic activity sector of the firm), and the firm size (a set of dummy variables indicating the firm size).
Characteristics at the municipality-level were considered in order to control for economic, social and political differences among municipalities. This information came from different sources, INEP, IPEA, TSE, IBGE and CGU.
The number of enrolled children in school (from the 1st to 8th grade) came from the National Institute for Educational Studies and Research "Anísio Teixeira" (INEP). We use this variable as a proxy for the provision of educational services (Arvate and Figueiredo, 2016).
Two variables came from the Institute for Applied Economic Research (IPEAData): the number of beneficiaries of Bolsa Familia Program and the gross domestic product (GDP). These
variables provide important information about socioeconomic characteristics of each municipality, which can influence on the labor market.
Political variables were collected from the Superior Electoral Court or Tribunal Superior Eleitoral (TSE). They are the gender and the level of education of mayors, which were chosen because they are important control variables.
The number of mismanagement events is another important control variable, which may influence on resource allocation in firms, since that excessive procurement prices paid by public bodies can be due to their inefficiency or mismanagement. Separating mismanagement and corruption measures came from Bandiera, Prat and Valletti (2009) who find a distinction between passive waste (inefficiency due to red tape or mismanagement in this research) and active waste (bribery or corruption) as referring that public bodies with lower passive waste do not have higher active waste.
Finally, we use more sets of dummy variables for the year when the municipality was audited (2005-2008), and for the region where the municipality is located (North, Northeast, Central-West, Southeast and South). Table 3 reports the description and source for each one of the above-mentioned variables. Table 4 presents descriptive statistics of variables, Table 4A and 4B show descriptive statistics according to year of audit of municipalities, and Table 5 presents the correlation matrix.