Sustainability quantification of renewable energy
conversion systems for electricity supply
Rui Pedro Mendes1, Pedro Dinis Gaspar 2, Luís Carrilho Gonçalves 3
1,2 University of Beira Interior, Faculty of Engineering, Department of Electromechanical Engineering 1
[email protected]; 2 [email protected]; 3 [email protected] Conference Topic – CT 9
Abstract
The sustainability of renewable energy conversion systems for electricity supply is quantified and compared. The energy conversion systems considered are: wind, photovoltaic, geothermal, hydro, hydrogen, ocean (wave and tidal power) and nuclear. The sustainability analysis is performed covering technological, economic, environmental and social aspects. The indicators selected to characterize and quantify the sustainability of each subgroup are: efficiency, lifetime, electricity generation cost, capital cost, CO2 emissions, area occupied,
employment creation and social acceptance. Membership functions are applied to determine the sustainability index that quantifies how sustainable is each energy conversion system depending on the most relevant indicator. This procedure includes a weighting coefficient that varies in each case study to magnify the importance of one indicator relatively to the others. Sustainability indices are compared in order to assess the energy conversion systems mix for electricity supply more sustainable now and in the near future. Comparing the several case studies, the global sustainability indicators suggest that the mix of energy conversion systems for electricity supply should be based on hydro, wind and nuclear systems.
Keywords: Sustainability indicators; Renewable energy; Electricity supply.
1. Introduction
The renewable energy systems became largely used due to the global necessity to reduce fossil fuel consumption and consequently environment carbon footprint. However, the energetic density provided by these systems is minimal when compared, as example, with the nuclear energy which nowadays can be considered as "almost" a renewable source because the new generation plants can reuse uranium. The recent accident in the 3rd reactor of
Fukushima Daiichi nuclear power plant in Japan caused by a natural disaster rise the necessity of thinking again about mix of renewable energy sources used for electricity supply. This accident brought back the undesirable impacts of nuclear energy. As the construction of fossil fuel electric power plants is not an option due to their negative environmental impacts, the sustainability of conversion processes and systems into electricity based on renewable sources needs to be systematic evaluated. The scope is to assess their technological evolution, environmental and economic impact and social approval in order to define a proper strategy for the mix of renewable sources in electricity supply.
The renewable energy conversion systems assessed in this paper are wind, photovoltaic (PV), nuclear, ocean, geothermal, hydro and hydrogen fuel cells. Wind energy has reached 159,2 GW of worldwide installed capacity [1] and 340 TWh of produced energy (2% of the electricity global consumption). The nominal installed capacity of PV systems in 2010 was about 21 GW. The PV market is ruled by Germany, which owns more than half of global market, followed Italy, Japan and Spain. The latter was a global leader in 2008 but since then started to reduce the growth of new installations [2]. Portugal had 2 MW of installed capacity in 2003 and defined a goal of 150 MW to 2010 horizon [3].The nuclear energy resource has been used along many decades and has a great potential for electricity productions. Although, it usage has been always controversial due to social acceptance questions. Nuclear energy supplies
about 13% ( 624 GW) of the world electric energy demand. The electricity generation through nuclear energy has reached a value of 2558 TWh in 2009 [3-4]. The United States of America is the country with more electricity through nuclear power plants with 19% of the total consumption [5]. In 2006, France has bet this value with 80% of consumed electricity produced by nuclear power plants [6]. The ocean energy contained in tides and waves are a renewable source with a great energy density with about 320 GW available along the European coast, which is 16% of the global resource [7-8]. However, the conversion technology for ocean energy is still in a development stage. It is available very few information about the electricity production from this resource. The geothermal resource is based on the heat provided by the subsoil at depths of 3 km [9]. This energy can be used for direct heating or for electricity generation by producing steam to drive a turbine [10]. Only the latter process will be assessed in this work. In the past 25 years, the electricity production by geothermal resource has significantly grown, reaching in 2007 about 10 GW of worldwide installed capacity [11]. Hydro energy is based on river water storage in dams for further utilization. The stored water is direct to a hydraulic turbine in order to drive an electric generator [12]. Hydro energy is a resource globally wide spread with an installed capacity of about 720 GW around the world [13]. Electricity production from hydrogen is accomplished through fuel cells. Two kinds of fuel cells will be considered, the phosphoric acid fuel cells and solid oxide fuel cells. Hydrogen is an abundant substance in the planet due to its presence in the water molecule. However, the fuel cells are available in units of 5 to 250 kW, being more suitable for decentralized electricity production.
2. Sustainable assessment
To assess the sustainability of a technological process it must be employed indicators that define and quantify the subsystems involved in the process. As the system properties are not directly measurable, it should be used assessment tools in order to obtain their indicators. Within the scope technological sustainability, the indicators must quantify the process considering the environment impact, the associated costs, the conversion efficiency and the lifetime of the technology. From the available indicators, it must be chosen those which best represent and quantify these parameters. Selected the proper indicators, an index is formulated to quantify the sustainability of each energy conversion process.
2.1 Chosen Indicators
In this study, 9 indicators were selected to describe the several energy conversion processes. These are divided in 4 distinct groups, in which group corresponds to a different subsystem. The used indicators are:
Technological performance indicators Energy conversion efficiency Lifetime
Energy payback time (E.P.B.T.) Economic indicators
Electricity generation cost Technology capital cost Environmental indicators
Greenhouse gas emissions (CO2)
Occupied land Social indicators
Job creation Social acceptance
2.2. Formulation of the sustainability index
After selecting the indicators, it is necessary to relate them in order to express them in a single value that can quantify the technological process sustainability. This relationship is achieved through a sustainability index formulation using the mathematical expression suggested by [15]. It is necessary to assign a membership function, q(xi) to each xi indicator. For each indicator, we have to:
Select the maximum, max (xi) and minimum, min(xi), values.
Indicate if the function q(xi) is increasing or decreasing with xi. According to the membership function variation with the indicator, the proper expression should be chosen.
If q(xi) value increases with the indicator xi the Equation 1 is used:
0 if min( ) min( ) ( ) if min( ) max( ) max( ) min( ) if max( ) 1 i i i i i i i i i i i i x x x x q x x x x x x x x (1)
Otherwise, if q(xi) value decreases with the indicator xi, Equation 2 should be chosen:
1 if min( ) min( ) ( ) 1 if min( ) max( ) max( ) min( ) if max( ) 0 i i i i i i i i i i i i x x x x q x x x x x x x x (2)
The sustainability index (Q) is given by the sum of the several indicators accounting with the respective weight (wi) that each one has in the index formulation. Considering m indicators for the energy conversion process characterization, the final index mathematical expression is given by Equation 3:
1 ( ; ) m i i i Q q w w q (3) 3. Sustainability indicatorsThe numerical values used for each indicator and energy conversion technology were collected from several assessment studies performed by other authors. For the energy conversion efficiency which quantifies the percentile of effective primary energy converted into electricity, the values range was obtained in [14,16-18]. The lifetime of technology, given in years, indicates the total time of operation of an energy conversion technology. For this indicator the values were consulted in [12,14,17,19-20]. The E.P.B.T. is referred to the time necessary for a technology generates the same amount of energy needed for its manufacture and installation. Expressed in months, the values for E.P.B.T. were given be [12, 19-25]. For the capital cost of each technology (expressed in €/MW) that represents the costs of a technology power plant, were used values provided by [14,30-32]. For the greenhouse gas emissions indicator, only CO2 emissions during the manufacturing and installation of the
conversion technologies are considered in this work. This indicator is given in gCO2/kWh of
electricity generated and the values used to quantify it were obtained in [12,14,16,17,34-38]. The occupied land is referred to the field area used by the technology structure expressed in km2/MW. For this indicator, were used values collected in [14,16,34,39-40]. The job creation
indicates the capacity of employment of each installed technology. Its unit is (jobs n.er)/MW.
population approval to install and explore a certain technology power plant. This indicator encompasses the social-politic, community and market approval [46]. This indicator quantification relies on statistical studies which were provided by [46-48]. All the values ranges used in this work are graphically indicated in [49]. In the latter reference a description of the used indicators is also presented.
4. Sustainability index application
According to values range obtained through extensive bibliographic review, two index values are calculated, one referred to minimum values and other to maximum ones. For the indicators that have just a single value, this one is uses in both situations. Several case studies are performed. In first case scenario (case study n.er 1), all indicators are considered
of equal importance, i.e. having the same weight. In the remaining case studies, per case, one indicator is considered more important than the others. This indicator will have a higher weight and the remaining an equal lower weight coefficient. In this work, efficiency, electricity generation costs, capital costs, CO2 emissions, E.P.B.T. and social acceptance are
decisive indicators in the quantification of conversion system sustainability [14]. According to [14,15] where similar studies are presented, the most important indicator weight coefficient, is within the range of 60-70%. In this present work, the mean value will be considered, a 65% weight coefficient for the most important indicator in each case study. In Table 1 is indicated the expression used for each indicator according to the membership function variation with the indicator.
Table 1. Sustainability variation with increase of indicator value.
Indicator Sustainability Equation used
q1 Energy conversion efficiency Increases Equation 1
q2 Lifetime
q3 Energy payback time (E.P.B.T.)
Decreases Equation 2
q4 Electricity generation cost
q5 Technology capital cost
q6 CO2 emissions
q7 Occupied land
q8 Job creation Increases Equation 1
q9 Social acceptance
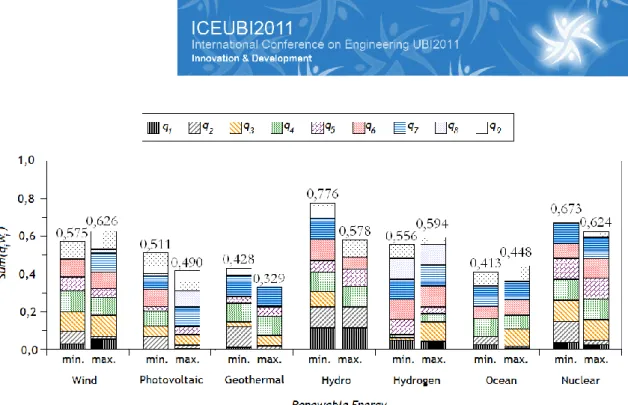
In Figure 1 is shown the sustainability index for each technology within its minimum and maximum values range having all indicators the same weight. The following considerations can be highlighted:
(1) The high efficiency and lifetime of hydro systems contribute significantly to its global sustainability index;
(2) The reduced E.P.B.T. and low cost of electricity generation associated with wind and nuclear systems contribute to their overall levels of sustainability;
(3) The capital cost needed to generate energy by photovoltaic systems, geothermal and ocean (wave and tidal) penalizes their sustainability indexes;
(4) The reduced CO2 emissions associated with wind systems, hydro, hydrogen and nuclear
contribute to their sustainability indexes;
(5) The reduced area occupied by geothermal, hydrogen, nuclear and ocean energy conversion systems also has influence on this technologies global sustainability index;
(6) The number of jobs generated by conversion systems of hydrogen into electricity and in a lesser extent by photovoltaic systems potentiates their index;
(7) Social acceptance is less controversial in the wind, photovoltaic and hydro systems; The analysis of this figure allows us to suggest a hierarchy of sustainability ranking of conversion technologies and propose a mix of technologies to convert energy into electricity. Thus, wind, hydro and nuclear conversion systems are the ones who stand in front of a sustainable future for the electricity supply. If nuclear energy, given the controversy it generates, was excluded from this comparison, hydrogen and photovoltaic system are included in the front line of most sustainable energy conversion systems.
Figure 1: Sustainability index for each technology and maximum and minimum values range - Case 1 (Same weight for all indicators).
Nevertheless, this analysis can be refined considering the following case studies where the global sustainability is analysed from a single indicator view point. This kind of analysis is important to figure which are the indicators more significant on the sustainability.
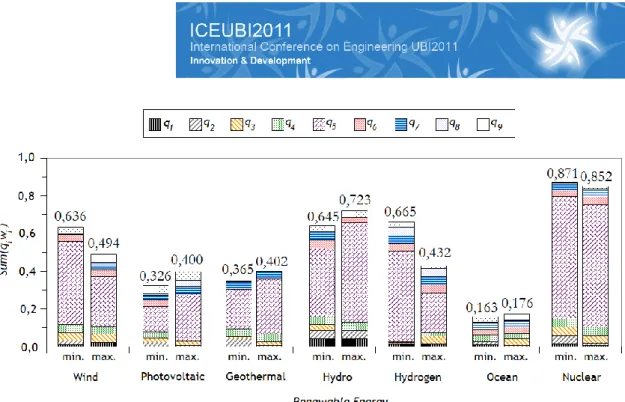
Figure 2 shows the sustainability index for each technology considering energy conversion efficiency as the core indicator (case study n.er 2). Hydro, wind and nuclear energy conversion
systems are the most sustainable. By other hand, photovoltaic and geothermal systems are the less sustainable.
Figure 2: Sustainability index for each technology and maximum and minimum values range - Case 2 (Efficiency as most relevant indicator).
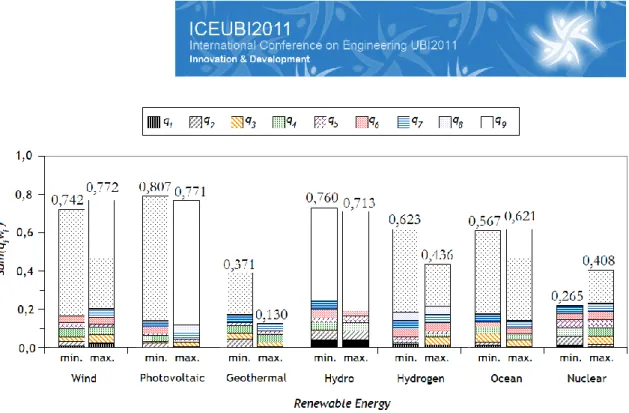
Considering case study n.er 3 where capital cost is the most relevant indicator, the same
energy conversion systems (hydro, wind and nuclear) as in previous case study get reach the most significant results. In this case study, ocean energy conversion system is the less sustainable.
Figure 3: Sustainability index for each technology and maximum and minimum values range - Case 3 (Capital cost as most relevant indicator).
Likewise in the previous case studies, hydro, nuclear and wind conversion systems are the most sustainable when electricity generation cost is considered the most relevant indicator to assess sustainability (case study n.er 4). Photovoltaic and hydrogen conversion systems are the
less relevant.
Figure 4: Sustainability index for each technology and maximum and minimum values range - Case 4 (Electricity generation cost as most relevant indicator).
If CO2 emissions are considered as the most relevant indicator (case study n.er 5), two of the
previous energy conversion systems leaders of sustainability continue show the highest values (hydro and nuclear conversion systems). However, hydrogen conversion system also includes the leading group of most sustainable conversion systems in this case study. Geothermal energy conversion system is the less sustainable.
Figure 5: Sustainability index for each technology and maximum and minimum values range - Case 5 (CO2 emissions as
most relevant indicator).
Case study n.er 6 considers E.P.B.T. as the core indicator. As for previous case studies,
nuclear and wind energy conversion systems continue to go ahead in the mix for electricity supply. Photovoltaic and geothermal energy conversion systems are the less sustainable.
Figure 6: Sustainability index for each technology and maximum and minimum values range - Case 6 (E.P.B.T. as most relevant indicator).
In case study n.er 7, where social acceptance is considered as a meaningful indicator, there is
a shift on leadership of sustainability global index of energy conversion systems for electricity supply. Photovoltaic system is considered as the most sustainable while hydro and wind continue in leading group. However, nuclear and geothermal energy conversion systems are now the less sustainable.
Figure 7: Sustainability index for each technology and maximum and minimum values range - Case 7 (Social acceptance as most relevant indicator).
Table 2 includes a summary of the several case studies. It is considered a ranking varying from 1 to 7 (equal to the number of the energy conversion systems accessed), corresponding from the most sustainable to the less sustainable respectively. The sum of the global sustainability index for each energy conversion system considering the different assessments based on one important indicator provide an insight of the electricity supply portfolio mix more sustainable. As shown in each of case studies, hydro, wind and nuclear energy conversion systems are the most sustainable for the electricity supply taking into account the individual significance of each indicator. Geothermal and ocean energy conversion systems are the opposite counterpart, i.e., are the less sustainable.
Table 2. Global sustainability index variation depending on the most relevant indicator.
Case Relevant indicator Wind PV Geothermal Hydro Hydrogen Ocean Nuclear
1 Equal weight 2 5 7 1 4 6 3 2 Efficiency 2 7 6 1 3 5 4 3 Capital cost 4 6 5 2 3 7 1 4 Electricity gen. cost 3 6 4 1 7 5 2 5 CO2 emissions 4 5 7 1 2 6 3
6 E.P.B.T. 2 6 7 4 3 5 1 7 Social acceptance 2 1 7 3 4 5 6
Total 19 36 43 13 26 39 20
5. Conclusions
The paper uses a wide range of indicators to characterize the technological, economic, environmental and social sub-systems of current renewable energy sources conversion systems into electricity. Minimum and maximum values of selected indicators were collected from specialized and specific literature for each energy conversion system.
Firstly, the same weight is given to all indicators in order to evaluate a global sustainability index from an equality point of view. Then, indicators are used separately to assess sustainability assuming that each indicator is the most relevant one. A hierarchy ranking is outlined from the results analysis. Hydro, wind and nuclear energy conversion system mix stands out for a sustainable future for the electricity supply. Notice that social acceptance of nuclear technology was based on data collected prior to the disaster in Fukushima power station. Nowadays, the social acceptance of this technology is probably lesser affecting its overall level of sustainability. In the opposite side, geothermal and ocean energy conversion
systems are the less sustainable. This condition arises from the specific needs for the location of geothermal power plants as well as from the low values for each indicator when comparing with the others energy conversion systems. Ocean energy conversion system also includes this group mainly due to its technological infant stage. This energy conversion system still requires a lot of research and development to be competitive.
This paper aims to provide an update on variation range of different sustainability indicators. Due to constant technology improvements that increase the energy conversion efficiency and reduce their greenhouse gases emissions, installation and operation costs reductions, society mentality changes, the implementation of a particular system type over another changes continuously. This work aims to contribute on the debate on current and future electricity supply from renewable energy conversion systems.
References
[1] WWEA, World Wind Energy Report 2009, World Wind Energy Association-WWEA. Feb. 2010. [2] REN21, Renewable 2010 - Global Status Report, Renewable Energy Policy Network for the
21st Century, 2010.
[3] DGEG, Energia Solar, Direcção-Geral de Energia e Geologia (DGEG), 2010.
[4] WNA, Another drop in nuclear generation, World Nuclear Association News, May 2010. [5] EIA, Summary status for the US, U.S. Energy Information Administration, January 2010. [6] Beardsley, E. "France Presses Ahead with Nuclear Power", NPR, 2006.
[7] J.M.B.P. Cruz, A.J.N.A. Sarmento, Energia das ondas: Introdução aos aspectos tecnológicos, económicos e ambientais, Instituto do Ambiente, 2004.
[8] Wave Energy Centre, "Potential and Strategy for the Development of Wave Energy in Portugal", 2004.
[9] F. A. Farret, M. G. Simões, Integration of alternative sources of energy, Wiley-IEEE, 2006. [10] B. Erdogmus et al., "Economic assessment of geothermal district heating systems: A case
study of Balcova-Narlidere, Turkey," Energy and Buildings, vol. 38, pp. 1053-1059, 2006. [11] D. L. Gallup, "Production engineering in geothermal technology: A review," Geothermics,
vol. 38, pp. 326-334, 2009.
[12] Varun et al., "Energy, economics and environmental impacts of renewable energy systems," Renewable and Sustainable Energy Reviews, vol. 13, pp. 2716-2721, 2009. [13] J. K. Kaldellis, "Critical evaluation of the hydropower applications in Greece," Renewable
and Sustainable Energy Reviews, vol. 12, pp. 218-234, 2008.
[14] N. H. Afgan, M. G. Carvalho, "Sustainability assessment of hydrogen energy systems," International Journal of Hydrogen Energy, vol. 29, pp. 1327-1342, 2004.
[15] K. Hanjalic, R. van de Krol, A. Lekic, Sustainable Energy Technologies, Options and Prospects: Springer, 2008.
[16] A. Evans et al., "Assessment of sustainability indicators for renewable energy technologies," Renewable and Sustainable Energy Reviews, vol. 13, pp. 1082-1088, 2009. [17] S. Roth et al., "Sustainability of electricity supply technology portfolio," Annals of Nuclear
Energy, vol. 36, pp. 409-416, 2009.
[18] A. Brito, J Huckerby, "Implementing Agreement on Ocean Energy Systems," Internation Energy Agency, Annual Report 2010.
[19] S. Banerjee, L. J. Duckers, R. Blanchard, B K Choudhury, Life Cycle Analysis of Selected Solar and Wave Energy Systems, Advances in Energy Research, 2006.
[20] R. Parker et al., "Energy and carbon audit of an offshore wave energy converter," in Proc. of the Institution of Mechanical Engineers, Part A: Journal of Power and Energy, vol. 221, pp. 1119-1130, 2007.
[21] H. C. Soerensen, S. Naef, S. Anderberg, M. Z. Hauschild, “Life Cycle Assessment of the Wave Energy Converter: Wave Dragon,” in Proc. Of International Conference on Ocean Energy, Bremerhaven, 2007.
[22] A. Vob, "A Comparative Assessment of Electricity Generation Options from an ecological and sustainability viewpoint," Institute of Energy Economics and Rational Use of Energy, University of Stuttgart.
[23] World Nuclear Association, "Energy Analysis of Power Systems " January 2011.
[24] J. Randolph, G. M. Masters, Energy for Sustainability: Technology, Planning, Policy Island Press, 2008.
[25] A. J. Mansure, D. A. Blankenship, "Energy Return in Energy Investment, An Important Figure-Of-Merit For Assessing Energy Alternatives," in Proc. 25th Workshop on Geothermal
Reservoir Engineering, Standford University, California, February 1-3, 2010.
[26] G. J. Dalton et al., "Case study feasibility analysis of the Pelamis wave energy convertor in Ireland, Portugal and North America," Renewable Energy, vol. 35, pp. 443-455, 2010. [27] D. Dunnett, J. S. Wallace, "Electricity generation from wave power in Canada," Renewable
Energy, vol. 34, pp. 179-195, 2009.
[28] G. Allan et al., "Levelised costs of Wave and Tidal energy in the UK: Cost competitiveness and the importance of "banded" Renewables Obligation Certificates," Energy Policy, vol. 39, pp. 23-39, 2011.
[29] T. J. Lee et al., "Strategic environments for nuclear energy innovation in the next half century," Progress in Nuclear Energy, vol. 49, pp. 397-408, 2007.
[30] E. Denny, "The economics of tidal energy," Energy Policy, vol. 37, pp. 1914-1924, 2009. [31] World Nuclear Association, "The Economics of Nuclear Power," url:
http://www.world-nuclear.org/info/inf02.html acessed: [28-04-2011].
[32] P. Lako, "Marine Energy " International Energy Agency, Technology Brief E13 Nov. 2010. [33] U.S. Energy Information Administration (EIA), "Updated Capital Cost Estimates for
Electricity Generation Plants," U.S. Department of Energy, WashingtonNovember 2010. [34] L. Gagnon et al., "Life-cycle assessment of electricity generation options: The status of
research in year 2001," Energy Policy, vol. 30, pp. 1267-1278, 2002.
[35] R. Kannan et al., "Life cycle assessment study of solar PV systems: An example of a 2.7 kWp distributed solar PV system in Singapore," Solar Energy, vol. 80, pp. 555-563, 2006.
[36] A. F. Sherwani et al., "Life cycle assessment of solar PV based electricity generation systems: A review," Renewable and Sustainable Energy Rev., vol. 14, pp. 540-544, 2010. [37] Varun, I.K. Bhat, R. Prakash, LCA of renewable energy for electricity generation
systems--A review. Renewable and Sustainable Energy Reviews, 2009a. 13(5): p. 1067-1073.
[38] M. Raugei, P. Frankl, Life cycle impacts and costs of photovoltaic systems: Current state of the art and future outlooks. Energy, 2009. 34(3): p. 392-399.
[39] F. Evrendilek, C. Ertekin, "Assessing the potential of renewable energy sources in Turkey," Renewable Energy, vol. 28, pp. 2303-2315, 2003.
[40] F. O. Rourke et al., "Tidal energy update 2009," Applied Energy, vol. 87, pp. 398-409, 2010.
[41] L. Frantzis, "Job Creation Opportunities in Hydropower," National Hydropower Association Annual Conference 2010.
[42] G. J. Dalton, T. Lewis, "Metrics for measuring job creation by renewable energy technologies, using Ireland as a case study," Renewable and Sustainable Energy Reviews, vol. 15, pp. 2123-2133, 2011.
[43] J. M. Rinebold, T. Drajer, A. Brzozowski, "A National "Green Energy" Economic Stimulus Plan Based in Investment in the Hydrogen and Fuel Cell Industry," The Connecticut Center for Advance Technology, Inc.2009.
[44] N. Peters, "Promoting Solar Jobs: A policy framework for creating solar jobs in New Jersey," New Jersey 2010.
[45] C. Plowman, "U.S. Job Creation Due to Nuclear Power Resurgence in United States," U.S. Department of Energy 2004.
[46] EWEA, “Wind Energy – The Facts: Chapter 6: Social acceptance of wind energy and wind farms," European Wind Energy Association (EWEA), Earthscan Ltd., March 2009.
[47] P. Ungemach, “Conclusions of the Workshop: Increasing policy makers awareness and public acceptance,” From E. Kontoleontos (eds.), in ENGINE Workshop 6 "Increasing policy makers ’awareness and the public acceptance”, ENhanced Geothermal Innovative Network for Europe (ENGINE), Athens, Greece, September 2007.
[48] B. van Bree, I. Bunzeck, “WP6: D6.1: Social acceptance of hydrogen demonstration projects,”, NextHyLights Industry and Institute partners, Supporting Action of the Fuel Cell and Hydrogen Joint Undertaking (FCH JU), New Energy World JTI framework, European Commission, August 2010.
[49] R.P. Mendes, L.C. Gonçalves and P.D. Gaspar , "Comparação da sustentabilidade das tecnologias de conversão de energia a partir de fontes renováveis por indicadores tecnológicos, económicos, ambientais e sociais" em: actas do X Congresso Ibero - Americano em Engenharia Mecânica , Porto, Portugal, 4-7 de Setembro, 2011