UNIVERSIDADE DA BEIRA INTERIOR
Ciências
Understanding the interaction between pDNA and
different chromatographic supports
Gregory Silva Dutra
Dissertação para obtenção do Grau de Mestre em
Bioquímica
(2º ciclo de estudos)
Orientador: Prof. Doutor Ana Cristina Mendes Dias Cabral
Co-orientador: Prof. Doutor Fani Sousa
Acknowledgments
First of all, I would like to thank Professor Cristina Dias-Cabral for her guidance, supervision, support and encouragement. Her enthusiastic and contagious passion in this investigation project was essential in this work accomplishment.
A special thanks to my co-supervisor Professor Fani Sousa. Her prompt availability and help were also a key for the project to come forward.
I would also like to acknowledge the research center CICS-UBI and lab colleagues, especially from my work group. Patrícia, Filipa, Cláudia, Sara, John, Gonçalo, Francisco and João thanks for the best working environment. This is also yours.
A very special tanks to John for his friendship and lessons. You already change someone in the world.
To my friends, especially from Desertuna, thank you for being part of my life. To my little brother that have the capability to cheer me up even in my worst days. Now and always to mom and dad.
Resumo Alargado
A terapia génica e as vacinas de DNA são terapias recentes que aproveitam o potencial do DNA plasmídeo (pDNA) como uma molécula terapêutica para o tratamento e cura de muitas doenças. Na última década, as empresas farmacêuticas deram muita atenção a ambas as técnicas devido à sua simplicidade, versatilidade e segurança.
O uso do pDNA como uma molécula com um propósito farmacêutico requer a sua produção em grande escala, com um alto grau de pureza e homogeneidade. Estes parâmetros são fundamentais para garantir uma boa resposta e a segurança do paciente.
São utilizados vários processos na purificação de plasmídeos, tanto na eliminação de impurezas como restos celulares, proteínas, DNA genómico, etc., como para separar as diferentes isoformas em que um plasmídeo se pode encontrar (linear, circular aberto ou superenrolado). As propriedades únicas do pDNA fazem com que a sua purificação seja a parte mais complicada de todo o processo de fabrico.
A cromatografia de troca aniónica e de interação hidrofóbica são as técnicas utilizadas com mais sucesso na purificação de plasmídeos. Contudo, o mecanismo de separação de plasmídeos por estas técnicas não é totalmente compreendido. É difícil prever o comportamento das moléculas durante a separação, e ainda, os métodos usados na escala laboratorial são economicamente e ambientalmente incompatíveis com a escala industrial. Assim sendo, uma melhor compreensão dos mecanismos subjacentes à cromatografia terá um elevado interesse prático.
A análise dos eventos termodinâmicos dos processos de adsorção através da Microcalorimetria de Fluxo (FMC) tem vindo a provar a sua boa utilidade na obtenção de uma melhor compreensão das forças motrizes, dos mecanismos e das cinéticas envolvidas no processo de adsorção de biomoléculas em diferentes sistemas cromatográficos. Por isso, neste trabalho, através da utilização da microcalorimetria de fluxo, pretende-se compreender e comparar o mecanismo de adsorção de um plasmídeo na sua forma linear (ln pDNA) a um suporte cromatográfico de troca aniónica (Q-sepharose Fast Flow) e a um suporte cromatográfico de interação hidrofóbica (Phenyl-sepharose 6 Fast Flow), e ainda a adsorção de um plasmídeo na sua forma linear e superenrolada (sc pDNA) a um suporte cromatográfico de troca aniónica (Q-sepharose Fast Flow). Os resultados serão analisados dando enfase às diferenças entre cada sistema. Para além da microcalorimetria de fluxo, foram também realizados estudos da capacidade de ligação em modo estático (static binding capacity) para obter uma melhor compreensão do mecanismo de adsorção.
Os resultados obtidos nos estudos de capacidade de ligação revelaram que o processo de adsorção do plasmídeo na forma linear segue uma isotérmica de Langmuir até uma certa
concentração de plasmídeo em equilíbrio. Em todos os casos testados, a capacidade de ligação do suporte aumenta com o aumento da concentração de plasmídeo em equilíbrio até se atingir um patamar em que a saturação do suporte cromatográfico é alcançada. O suporte de troca iónica revelou ter uma capacidade de ligação maior para o ln pDNA do que o suporte de interação hidrofóbica, como esperado. Não foi possível fazer os mesmos testes com o sc pDNA dado a sua instabilidade nas condições em que os testes são realizados. Não obstante, conseguiu-se de forma teórica chegar a uma previsão da capacidade máxima de ligação do sc pDNA ao suporte de troca aniónica que revelou ser inferior à capacidade teórica atingida na adsorção de ln pDNA.
Os estudos realizados utilizando a microcalorimetria de fluxo foram efetuados na zona linear das isotérmicas. Dois modos diferentes de injeção foram utilizados através da introdução de um pulso de amostra na célula do microcalorímetro ou através da alimentação contínua de amostra à célula. Estes modos de injeção foram conseguidos usando loops de diferentes volumes.
Considerando os resultados do FMC obtidos com a adsorção do ln pDNA à Phenyl Sepharose, todos os termogramas são compostos por um pico endotérmico seguido de um ou dois picos exotérmicos, dependendo do modo de injeção, e um último pico endotérmico. Os termogramas foram deconvoluidos e as áreas e o timing dos picos considerados na comparação com o processo de adsorção do ln pDNA a Q-Sepharose. O primeiro pico endotérmico relaciona-se com o processo de desolvatação. O primeiro pico exotérmico está associado à interação entre o ln pDNA e o suporte. Visto que este apresenta valores energéticos similares aos da interação do ln pDNA com a Q-Sepharose, verificou-se que a Phenyl Sepharose também interage electrostaticamente com o DNA plasmídeo através de interações anião- Utilizando a alimentação contínua da coluna (loop de 430 µL), encontraram-se diferenças não só na magnitude e no timing de cada sinal, como também no perfil do termograma. A presença de diferentes picos num termograma indica a existência de diferentes eventos durante o processo de adsorção. O segundo pico exotérmico, encontrado apenas utilizando o modo de alimentação contínua, está relacionado com adsorção secundária. Este processo também acontece na adsorção do ln pDNA à Q-Sepharose. Considerou-se que o último pico endotérmico estivesse relacionado com a reorganização das moléculas de água e iões na interface do ln pDNA com a solução. Acredita-se que este processo seja causado pela alta concentração de sulfato de amónio na solução.
As experiencias realizadas no FMC com sc pDNA e Q-Sepharose resultaram em termogramas compostos por um pico endotérmico seguido de um exotérmico. O pico endotérmico obtido com o loop de 430 µL foi deconvoluidos, posteriormente, em dois sinais endotérmicos. Tal como no caso anterior, as intensidades, áreas e o timing dos sinais foram considerados na comparação com a adsorção do ln pDNA à Q-Sepharose. Acredita-se que o primeiro sinal endotérmico esteja relacionado com processo de desolvatação, tal como na adsorção do ln pDNA. Contudo,
verificou-se que o processo é mais energético no caso do sc pDNA dado que este tem uma maior densidade de carga que é conferida pela isoforma superenrola, conduzindo a um maior gasto energético na desolvatação. Ao utilizar o loop de 430 µL conseguiu-se promover uma sobrecarga no volume de amostra que passa na coluna. Este método resultou no aparecimento de um segundo sinal endotérmico. Este sinal relaciona-se com as repulsões entre as moléculas de sc pDNA livres na solução. Por último, a área e o timing do pico exotérmico leva-nos a acreditar que este está relacionado com a reorientação da molécula e com adsorção secundária. As entalpias de adsorção revelaram que o processo global de adsorção é exotérmico (perto de zero) na adsorção do ln pDNA à Phenyl Sepharose. Alguns estudos mostram que os processos cromatográficos que envolvem interações hidrofóbicas são fortemente influenciados pela variação da entropia, e são muitas vezes considerados maioritariamente endotérmicos. Neste caso particular, não temos um processo só com interações hidrofóbicas o que explica a divergência dos resultados. Na adsorção do sc pDNA à Q-Sepharose, o processo global é conduzido entropicamente visto que este é endotérmico para todos os casos estudados, este resultado é similar aos obtidos anteriormente com o estudo da adsorção pela análise de van´t Hoff [24].
Palavras-chave
Microcalorimetria de Fluxo; Adsorção; DNA plasmídeo linear e superenrolado; Cromatografia de troca aniónica; cromatografia de interação hidrofóbica.
Abstract
Gene Therapy and DNA vaccines are recent therapies that take advantage of the potential of plasmid DNA as a therapeutic molecule for the treatment and cure of several diseases. In the last decade both techniques have received a great deal of attention by pharmaceutical companies due to their simplicity, versatility and safe profile. Hence, the usage of pDNA as biopharmaceutical molecule requires its production at the gram scale, with a high purity and homogeneity level as a vital parameter to ensure a good response and the patient safety. Anion-exchange chromatography and hydrophobic interaction chromatography have been successfully used in pDNA purification. Nevertheless, the mechanism of pDNA separation for both purification techniques is still not completely understood. A better understanding of the driving forces and mechanisms underlying both purification processes are of great interest to help optimize chromatographic systems.
Flow Microcalorimetry (FMC) has proven its ability to provide an improved understanding of the driving forces, mechanisms and kinetics involved in the interaction process during biomolecules adsorption onto several chromatographic systems]. Thus, using Flow Microcalorimetry as a central technique, this study aims to understand and compare the interaction between different pDNA isoforms (pVAX1-LacZ) and the anion-exchange support (Q-sepharose Fast Flow) or the hydrophobic support (Phenyl Sepharose 6 Fast Flow), considering only the isotherm linear conditions, showing the role of nonspecific effects on the adsorptive process.
The results obtained in the binding capacity studies revealed that the ln pDNA adsorption process follows a Langmuir isotherm up to a specific ln pDNA equilibrium concentration. In all cases, the binding capacity increases with the plasmid concentration in equilibrium until it reaches a level at which saturation of the chromatographic medium is achieved. The anion-exchange support was found to have a higher binding capacity for ln pDNA adsorption than the hydrophobic interaction support, as expected. FMC results reveled that for both processes the endothermic heat major contributor was suggested to be the desolvation and changes in the solvation shell processes while exothermic heats were related to the interaction (electrostatic attraction) between pDNA and support and also to the secondary adsorption of already adsorbed pDNA molecules. The enthalpies of adsorption showed that the overall adsorption process is mainly enthalpically driven for the adsorption of ln pDNA onto Phenyl Sepharose and entropically driven for the sc pDNA-Q-sepharose system.
Keywords
Flow Microcalorimetry; Adsorption; Supercoiled and linear plasmid DNA; Anion-exchange chromatography; Hydrophobic Interaction chromatography.
Table of Contents
1. Introduction ... 1
1.1. Plasmid DNA (pDNA) ... 1
Gene Therapy and DNA Vaccines: pDNA as biopharmaceutical molecule ... 1
1.1.2. Structure and Proprieties ... 3
1.1.3 Plasmid conformational forms ... 5
1.2. Biotechnological plasmid DNA production... 7
1.2.2. Upstream Processing ... 8
1.2.3. Downstream Processing ... 9
1.3. Liquid Chromatography technique for pDNA purification ... 13
1.3.1. Physical proprieties of different stationary phases. ... 15
1.3.2. Anion-Exchange Chromatography principles for pDNA purification ... 17
1.3.3. Hydrophobic Interaction Chromatography principles for pDNA purification .... 19
1.4. Adsorption process and equilibrium ... 21
1.4.1. Langmuir Model and static binding capacity ... 22
1.5. Thermodynamic study of biomolecules adsorption ... 25
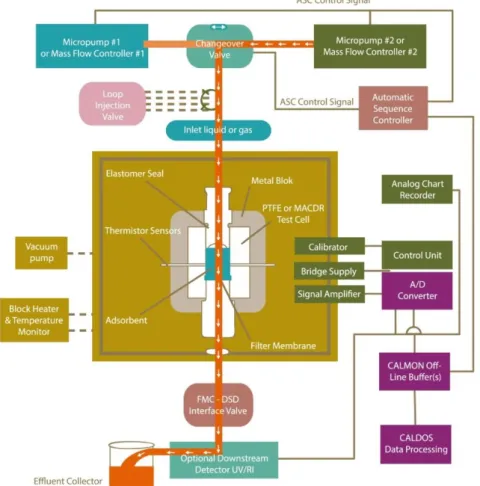
1.5.1. Flow Microcalorimetry ... 25
1.6. Goal of Study ... 29
2. Materials and methods ... 31
2.1. Materials ... 31
2.2. Apparatus and Software ... 31
2.3. Plasmid DNA Production ... 31
2.3.1. Fermentation ... 31
2.3.2. Recovery ... 32
2.3.3. Plasmid DNA quantification ... 33
2.3.4. Plasmid Isoform Separation ... 33
2.3.5. Agarose Gel Electrophoresis ... 33
2.4.1. sc pDNA purification with Toyopearl GigaCap Q 650-M ... 33
2.4.2. sc pDNA purification with CIM DEAE ... 34
2.4.3. Sample Concentration and buffer change... 34
2.4.4. Sample Characterization ... 34
2.5. Flow Microcalorimetry (FMC) ... 35
3. Results and Discussion ... 37
3.1. Plasmid production ... 37
3.2. sc pDNA Purification ... 38
3.2.2. Toyoperl GigaCap Q 650-M ... 38
3.2.3. CIM DEAE ... 40
3.3. Static Binding Capacity ... 41
3.4. Flow Microcalorimetry ... 43
3.4.1. ln pDNA adsorption onto Phenyl-Sepharose... 44
3.4.2. sc pDNA adsorption onto Q-Sepharose ... 53
4. Conclusion and Future work ... 61
5. References ... 63
Figures
Figure 1.1.1 - Indications addressed by plasmid-based gene therapy clinical trials. Adapted
image from The Journal of Gene Medicine [59] ... 1
Figure 1.1.2 - Vectors used in gene therapy clinical trials. Adapted image from The Journal of Gene Medicine [59] ... 2
Figure 1.1.3 – DNA nucleotide chemical structure ... 3
Figure 1.1.4 – DNA different nucleotide bases... 4
Figure 1.1.5 - DNA chain ... 4
Figure 1.1.6 - Linear, open circular and supercoiled plasmid DNA, respectively. ... 5
Figure 1.1.7 - Schematic model a negatively supercoiled plasmid [19,30]. The DNA double helix is represented by the thick line. The superhelix axis is the dashed curve crossing the nodes and bisecting the area enclosed by the two DNA double strands between adjacent nodes. The superhelix radius is the distance between the superhelix axis and the DNA double strands. .... 6
Figure 1.2.1 - Schematic process steps for the development of plasmid DNA. ... 7
Figure 1.3.1 - LC molecule-stationary phase base interaction illustration. Respectively SEC, HIC, IEX and AC [31]. ... 14
Figure 1.3.2 – Structure illustration of the different types of stationary phase’s composition. A) Gels (e.g. agarose, cellulose…) B) Rigid porous media (e.g. Silica, alumina…) C) Composite media (e.g. Silica/dextran, agarose/dextran…) D) Monoliths (e.g. Polyacrylamide) [22]. ... 15
Figure 1.3.3 - Different ligand architecture in the stationary phase pore; A) without spacer – Because they are connected directly on the surface wall, the interaction may be limited once many of them are accessible. B) with spacers – the spacers where designed to attend the accessibility problem, however, some controversial discussions throughout the literature whether it will be a source of non-specific interactions. C) Polymeric modification (Graft) – grafted ligands shows a more promising alternative for attend the accessibility drawback and have already showed a higher binding capacity [23]. ... 16
Figure 1.3.4 - Anion-exchange separation principles. Adapted from GE Healthcare handbook. ... 17
Figure 1.3.5 - Typical AEC chromatogram. (D) - Denaturated pDNA (OC) – open circular isoform (SC) supercoiled isoform. [60] ... 19
Figure 1.3.6 - A) Highly ordered water shells surround the hydrophobic surfaces of ligands and proteins. Hydrophobic substances are forced to merge to minimize the total area of such shells. Salts enhance the hydrophobic effect. B) The equilibrium of the hydrophobic interaction is controlled predominantly by the salt concentration [31]. ... 19 Figure 1.3.7 - Solubilizing properties of water molecules and its ability to interact with dipoles and form hydrogen bonds [31] . ... 20 Figure 1.4.1 - Langmuir adsorption isotherm with the limiting behavior for low and high C values. M is the initial slope and 1/K is the liquid phase concentration in equilibrium with one-half of qm [22]. ... 24
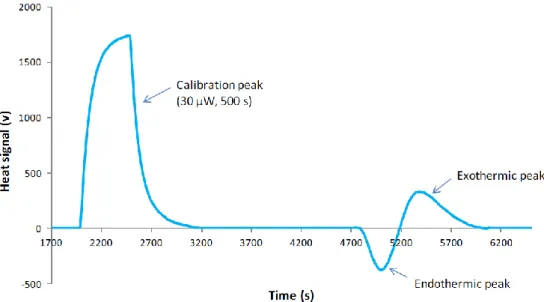
Figure 1.5.1 - Flow microcalorimeter representative scheme. ... 26 Figure 1.5.2 - Typical FMC thermogram for linear pDNA adsorption on Q-Sepharose. ... 27 Figure 3.1.1 - Electrophoresis results of pDNA in different conformations. A – pDNA after recovery and clarification with Qiagen Kit. B – pDNA after 1 day at room temperature after A. C - pDNA after 2 day at room temperature after A.D – (a) pDNA after 3 day at room temperature after A and (b) pDNA after Hind II digestion. 1 – Open circular (oc) pDNA. 2 – linear (ln) pDNA. 3 – supercoiled (sc) pDNA. 4 – molecular weight marker (adapted from [1]). ... 37 Figure 3.1.2 – Typical chromatogram obtained by injection of the plasmid sample recovered from the the Qiagen Kit, onto the CIMac™ DEAE column. ... 38 Figure 3.2.1 - Chromatographic profile of the plasmid isoform separation from a clarified pDNA sample (sc + oc) in the Toyoperl GigaCap Q 650-M column. The Elution method was based in the separation method suggested by Prazeres et al.[18] ... 39 Figure 3.2.2 -Tipycal chromatographic profiles of the plasmid isoform separation from a clarified pDNA sample (sc + oc) in the Toyoperl GigaCap Q 650-M column. Different colors mean different injection concentrations. ... 40 Figure 3.2.3 - Chromatographic profile of the plasmid isoform separation from a clarified pDNA sample (sc + oc) in the with the CIM® DEAE-0.34 Disk. ... 41 Figure 3.4.1 - Thermograms of ln pDNA adsorption onto Phenyl-sepharose using the 230 μL loop. Black 124.97 µg pDNA/g Phenyl Sepharose; Red 171.75 µg pDNA/g Phenyl Sepharose; Blue 413.18 µg pDNA/g Phenyl Sepharose. Vertical dashed line represents the time where the pDNA solution plug is replaced with pDNA-free mobile phase around 1650 seconds. ... 44 Figure 3.4.2 - Thermograms of ln pDNA adsorption onto Phenyl sepharose using the 430 μL loop. Black 117.67 µg pDNA/g Phenyl Sepharose; Green 363.42 µg pDNA/g Phenyl Sepharose; Orange
614.70 µg pDNA/g Phenyl-Sepharose. Vertical dashed line represents the time where the pDNA solution plug is replaced with pDNA-free mobile phase around 2100 seconds. ... 44 Figure 3.4.3 - PEAKFIT de-convolution of 230 µL loop thermograms for loading concentrations of A – 124.97 µg pDNA/g Phenyl Sepharose; B 171.85 µg pDNA/g Penyl Sepharose; C – 413.18 µg pDNA/g Phenyl Sepharose. Curves shown are for experimental data. Total peak fit (black line (–)) and peaks resulting from deconvolution (blue and red lines (...))Vertical dashed line represents the time where the pDNA solution plug is replaced with pDNA-free mobile phase around 1650 seconds. ... 46 Figure 3.4.4 - PEAKFIT de-convolution of 430 µL loop thermograms for loading concentrations of A – 117.45 µg pDNA/g Phenyl Sepharose; B - 362.91 µg pDNA/g Penyl Sepharose; C – 613.82 µg pDNA/g Phenyl Sepharose. Curves shown are for experimental data. Total peak fit (black line (–)) and peaks resulting from deconvolution (blue and red lines (...)). Vertical dashed line represents the time where the pDNA solution plug is replaced with pDNA-free mobile phase (Grey – 230 µL loop and Black – 430 µL loop). ... 47 Figure 3.4.5 - Endothermic heats of ln pDNA adsorption onto (●) Phenyl Sepharose (♦) Q-Sepharose [1]. ... 49 Figure 3.4.6 - Exothermic heats of ln pDNA adsorption onto (●) Phenyl Sepharose (♦) Q-Sepharose [1]. ... 50 Figure 3.4.7 – Comparison between the ln-pDNA-Q-Sepharose first endothermic peak energy (♦) and ln-pDNA-Phenyl Sepharose second endothermic peak (●). ... 51 Figure 3.4.8 - Net heats (sum of all energetic contributions) of ln pDNA adsorption onto (●) Phenyl Sepharose (♦) Q-Sepharose [1]. ... 52 Figure 3.4.9 - Thermograms of sc pDNA adsorption onto Q-sepharose using the 30 μL loop. Black 13.24 µg pDNA/g Q-Sepharose; Red 52.97 µg pDNA/g Q-Sepharose; Blue (--) 102.85 µg pDNA/g Q-Sepharose. Vertical dashed line represents the time where the pDNA solution plug is replaced with pDNA-free mobile phase around 1150 seconds. ... 53 Figure 3.4.10 - Thermograms of sc pDNA adsorption onto Q-sepharose using the 430 μL loop. Black 117.26 µg pDNA/g Q-Sepharose; Blue 1172.60 µg pDNA/g Q-Sepharose. Vertical dashed line represents the time where the pDNA solution plug is replaced with pDNA-free mobile phase around 2100 seconds. ... 53 Figure 3.4.11 - PEAKFIT de-convolution of thermograms for loading concentrations of A – 13.24 µg pDNA/g Q-Sepharose; B -13.24 µg pDNA/g Q-Sepharose; C - 102.85 µg pDNA/g Q-Sepharose. Curves shown are for experimental data. Total peak fit (black line (–)) and peaks resulting from
deconvolution (blue and red lines (...))Vertical dashed line represents the time where the pDNA solution plug is replaced with pDNA-free mobile phase around 1150 seconds. ... 55 Figure 3.4.12 - Endothermic heats of sc pDNA adsorption (●) and ln pDNA adsorption (♦) onto Q-Sepharose[1]. ... 57 Figure 3.4.13 – PEAKFIT de-convolution of thermograms for loading concentrations of A – 117.86 µg pDNA/g Q-Sepharose and B - 1172.60 µg pDNA/g Q-epharose. Curves shown are for experimental data. Total peak fit (black line (–)) and peaks resulting from deconvolution (blue and red lines (...))Vertical dashed line represents the time where the pDNA solution plug is replaced with pDNA-free mobile phase around 2100 seconds. ... 57 Figure 3.4.14 - Endothermic heats of sc pDNA adsorption onto (●) and ln pDNA adsorption (♦)onto Q-Sepharose [1]. ... 59 Figure 3.4.15 – Net heats (sum of all energitc contributions) of sc pDNA adsorption onto (●) and ln pDNA adsorption (♦)onto Q-Sepharose [1]. ... 60 Figure 3.4.16 - Thermograms of ln pDNA adsorption onto Q-Sepharose, at pH 8. Injection loop: 30 µL. (a) Black (–) 12.6 µg ln pDNA/g Q-Sepharose; red (– –) 53.4 µg ln pDNA/g Q-Sepharose; blue (-..-) 111.2 µg ln pDNA/g Q-Sepharose; (b)–(d) PEAKFIT deconvolution of thermograms for loading concentrations of (b) 12.6 µg ln pDNA/g Q-Sepharose, (c) 53.4 µg ln pDNA/g Q-Sepharose and (d) 111.2 µg ln pDNA/g Q-Sepharose. Curves shown are for experimental data (red line (– )); total peak fit (black line (–)) and peaks resulting from deconvolution (blue line (...)). Vertical dashed line represents the time where the pDNA-containing plug of solution is replaced with pDNA-free mobile phase. ... 70 Figure 3.4.17 - Thermograms of ln pDNA adsorption onto FF Q-Sepharose. Injection loop: 429 µL. PEAKFIT de-convolution of thermogram for loading concentrations of 1359.6 µg ln pDNA/g Q-Sepharose. Vertical dashed line represents the time where the pDNA-containing plug of solution is replaced with pDNA-free mobile phase. ... 71
Tables
Table 1.2.1 – Agencies guidelines for application of pharmaceutical grade of sc pDNA. ... 11 Table 1.3.1 - Branches of modern Liquid Chromatography summary. ... 13 Table 2.3.1 - Recovery of pDNA using QIAGEN® Plasmid Maxi Kit. ... 32 Table 3.4.1 - Heat of adsorption for ln pDNA adsorption onto Phenyl-sepharose using the 230 and 430 μL loop. ... 45 Table 3.4.2 – Sum of heat of adsorption for ln pDNA adsorption onto Phenyl-sepharose using the 230 and 430 μL loop. ... 45 Table 3.4.3 - Heat of adsorption for sc pDNA adsorption onto Q-sepharose using the 30 and 430 μL loop. ... 54 Table 3.4.4 - Classification and properties of the different support media used in Liquid Chromatography. ... 69 Table 3.4.5 - Heat of adsorption for ln pDNA adsorption on Q-Sepharose at pH 8; flow rate: 1.5 mL/h; adsorbent sample size: 21.89 mg; and temperature: 25◦C. Enthalpies were determined from the deconvoluted thermograms. ... 70
1. Introduction
1.1. Plasmid DNA (pDNA)
Gene Therapy and DNA Vaccines: pDNA as biopharmaceutical molecule
Plasmid DNA (pDNA) is the base for promising DNA vaccines and gene therapies against many infectious resulting from acquired or genetic diseases [3–11]. For approximately two decades, these techniques elicited a great deal of attention and like any other novel therapeutic approach, it has also given rise to excessive short-term expectations [4,12]. The data on Figure 1.1.1 shows the main indications and target diseases where plasmid-based therapies have been applied.
Gene therapy can be defined as a treatment strategy which uses heterologous genetic information, usually in the form of deoxyribonucleic acid (DNA), to compensate or correct a genetic malfunction in order to obtain a therapeutic effect in animal models and human individuals [12]. DNA vaccines are made of small circular genetically engineered pieces of DNA, pDNA, used to generate in situ production of antigen that promotes immunological responses against infectious agents [3,10,13]. Naked pDNA vaccines first received attention in the 1990s, since then, a great deal of progress has been made [10].
Indications Adressed by Plasmid-based Gene
Therapy Clinical Trials
Cancer diseases 58% (n=223) Cardiovascular diseases 23% (n= 89) Infection diseases 4% (n=15) Healthy volunteers 4% (n=15) Neurological diseases 3% (n=13) Monogenic diseases 2% (n=6) Ocular diseases 1% (n=5) Other diseases 5% (n=21)
Figure 1.1.1 - Indications addressed by plasmid-based gene therapy clinical trials. Adapted image from The Journal of Gene Medicine [59]
These therapeutic applications involve essentially three steps: (1) Administration of a gene or a vector containing a gene into the body; (2) Gene delivery from the site of administration to the nucleus of the target cells and (3) gene expression, leading to the production of a therapeutic molecule/antigen[12].
As much significant as the gene that is introduced, the vehicle that will transport it to the target cells also plays a very important role. These vehicles are called vectors, and the main types are viral and non-viral vectors. All viruses attack their hosts and introduce the genetic material into the host cell as a part of their replication cycle [14,15]. Gene therapy based on viral vectors exploit part of this natural process in order to introduce exogenous DNA to the target cells. [15,16]. Following this, a burst of clinical studies came up showing the wide range application for this type of therapy. However, this enthusiastic period didn’t last long due to therapy risks, its limitations and the occurrence of deaths during clinical trials [14,15]. Besides some unexceptional results of most clinical studies, other several viral and hosts factors hampered the progress [15]. Nevertheless, the search for a safe gene delivery didn’t stop and non-viral vectors began to attract attention as result of their universal application range and, mostly, their high delivery safety level [3,16]. According to the internet Wiley database of gene therapy (www.wiley.com/legacy/wileychi/genmed/clinical/) and as we can see on Figure 1.1.2, 17.4 % of all clinical trials developed until July 2015 used plasmid DNA as non-viral vectors. Thus, gene therapy continues to hold great promise for new therapeutic solutions to as-yet incurable diseases. Also, DNA vaccines are experiencing a resurgence as a result of the success with the prime-boost immunization [3,4,10]. Due to simplicity, versatility, safe profile and low cost storage, pDNA vaccines clinical studies have reappeared. Hence the number of applications of pDNA is still growing [3,10,13], new developments and progress solutions are gradually emerging as a result of the increased demand for the pDNA-based treatments [13].
Vectors use in Gene Therapy Clinical Trials
Adenovirus 22,2% (n=506) Retrovirus 18,4% (n=420) Naked/Plasmid DNA 17,4% (n=397) Vaccina virus 7,2% (n=165) Adeno-associated virus 6% (n=137) Lipofection 5% (n=115) Lentivirus 5% (n=114) Other vectors 15,3% (n=348) Unknown 3,3% (n=76)
Figure 1.1.2 - Vectors used in gene therapy clinical trials. Adapted image from The Journal of Gene Medicine [59]
To date, three veterinary DNA vaccines are licensed for treatment, the west wile virus in horses, infectious hematopoietic necrosis virus in salmon and melanoma in dogs [11]. The awareness about the relevance of the pDNA as a therapeutic is growing and causing a substantial demand for this therapeutic molecule. This higher demand of pDNA for different indications combined with the amount of pDNA used per dose, which are much higher compared with the protein-based biotherapeutics, intensifies the need for a large scale of production. In addition, a high purity level and homogeneity is a pivotal parameter to ensure a good therapeutic response and the patient safety. Thus, an efficient purification process is vital as well. Furthermore, the whole production process and storage requires an efficient quality control characterization. Thus, all the manufacturing steps, from production to the final product, are analyzed and controlled by regulatory agencies guidelines like Food and Drug Administration (FDA), European Agency for the Evaluation of Medical Products (EMEA) and World Health Organization (WHO). Summarizing, it’s needed a well-established and economically affordable process that can be controlled and that ensures a large scale production and highly pure pDNA [3]. The well-publicized potential of gene therapy, together with ongoing clinical trials of DNA vaccines and an increase in the number of the regulatory approvals for veterinary vaccines, makes enormous the market potential for pDNA [3]. Nevertheless, research, laboratory and industrial innovation is still needed to enable the efficient production and control of these high pure quantities [3,10,11].
1.1.2. Structure and Proprieties
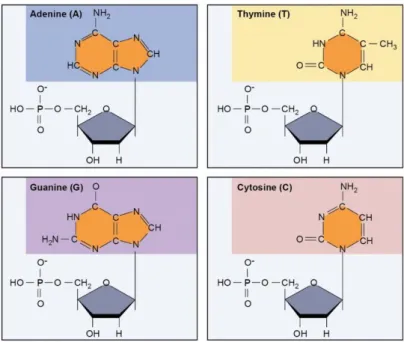
A DNA molecule consists of a linear polymer made of repeated units called nucleotides. These nucleotides are comprised with a phosphate group, a five carbon sugar and a nitrogenous base (Figure 1.1.3). Also, there are two types of nitrogenous bases, purines and pyrimidines. Adenine and Guanine bases belong to purine and Thymine and Cytosine bases belong to pyrimidine type.
The unique structure of these nitrogenous bases, as shown in Figure 1.1.4, is responsible for a phenomenon called complementary base paring, where adenine always pairs with thymine, whereas guanine pairs with cytosine. The linear chain is created by a phosphodiester bond between the sugar of one nucleotide and the phosphate group of the next that creates a sugar phosphate backbone. This backbone structure is negatively charged when the pH > 4 (Figure 1.1.5).
Figure 1.1.5 - DNA chain Figure 1.1.4 – DNA different nucleotide bases.
The winding of two anti-parallel complementary nucleotides in each DNA strand are connected by hydrogen bonds, along a common axis forming the well-known right-handed double helix structure with highly hydrophobic grooves accessible to solvents and ligand molecules [13]. Plasmids are molecules in which the two ends of the DNA strand are covalently linked, forming a closed loop. Like the chromosomal DNA, it contains genetic information that can benefit the host. In addition, it is physically separated from the chromosomal DNA which makes this molecule a form of gene transmission. Plasmids are considered replicons, which are capable of autonomously replicate inside a suitable host. They can occur naturally in bacteria, but can also be found in some eukaryotic organisms [13,17].
The size of the plasmids can vary from 1 to over 1000 kilo-base pair (kbp) and the number of plasmids inside the same cell can be enormous under some circumstances and may appear in one of many conformations. The conformations can greatly influence the biological activity of plasmids, and this is one of the reasons of the importance of separation studies, that enable the purification of the most active pDNA topology. Thus, different conformational types of pDNA should be regarded in this work [13].
1.1.3 Plasmid conformational forms
The pDNA molecule can mainly exist in three topological conformations namely, linear (ln), open circular (oc) and supercoiled (sc), Figure 1.1.6. The ln pDNA form has been deemed unsatisfactory for clinical purposes due to its perceived risk of recombination, integration into the genomic DNA and more rapid intracellular degradation. The oc pDNA represents a minor risk for clinical application compared with the ln form, but the parameters such as safety, stability and activity are superior in the sc form [13,18].
Supercoiled pDNA is considered as a nanoparticulate material. The length of this molecule may range in order of hundreds of nanometers (nm) whist having a very small diameter, between 9.9 and 13.4 nm. As we can see in Figure 1.1.6 the supercoiled isoform has a higher order structure due to a coil of the helix axis in space[18].
The number of times that the two strands of DNA helix are intertwined is called linking number, Lk. For an oc pDNA the linking number is Lko, which is equal to the number of base pairs (bp)
in the molecule divided by the helical repeat (10.6 bp/turn). The negatively charged sc plasmids are characterized by a deficiency in the Lk, in which Lk<Lko. These supercoiling degree can also
be described in terms of a specific linking number difference, or superhelix density, σ, given by: [18,19]
𝜎 =
(𝐿𝑘−𝐿𝑘𝑜)𝐿𝑘𝑜
(1)
Most supercoiled plasmids molecules isolated from prokaryotes have σ values between -0.05 and -0.07. [18]. At these degree of supercoiling, plasmid molecules have a clearly defined branched shape as shown in Figure 1.1.7.
In addition, Boles et al. [19] found out that for 3.5 and 7.0 kbp molecules, the superhelix axis length is independent of σ and is about 41% of the total DNA length. For the same plasmids, the superhelix radius decreased hyperbolically with the superhelix density, σ, according to the relation [18,19] :
1
r= 0.00153 − 0.268𝜎 (2)
Moreover, it is important to mention that the size of pDNA for vaccine production typically ranges from 3 to 15 kbp, depending on the vector complexity, with the expectation that the size could increase in the future, namely for the production of multivalent vaccines [18,19] .
Figure 1.1.7 - Schematic model a negatively supercoiled plasmid [19,30]. The DNA double helix is represented by the thick line. The superhelix axis is the dashed curve crossing the nodes and bisecting the area enclosed by the two DNA double strands between adjacent nodes. The superhelix radius is the distance between the superhelix axis and the DNA double strands.
1.2. Biotechnological plasmid DNA production
As stated before, the potential of gene therapy and DNA vaccines are increasing the interest of using pDNA as a biopharmaceutical molecule. This interest already increased the need of a large scale manufacture and also the improvement of good manufacturing practices (GMP) [3,5].
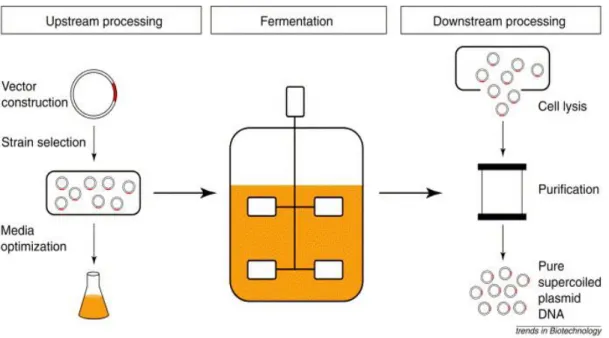
The pDNA biotechnological production process can be divided into two sequential phases. The upstream processing which comprise the steps that goes from the plasmid production and host development to the cell fermentation. The downstream processing is responsible for the harvest, lysis and purification of the desired molecule. With the scale up to an industrial production, some methods used in laboratory-scale became inadequate and had to be replaced by others more economically reliable and environmentally safer. Figure 1.2.1 shows the general steps in the pDNA production [3,5,13].
The final product quality depends on the production system. Thus, it is very important to design and evaluate all the manufacturing steps previous to the scale up in order to achieve the best pDNA productivity and quality. Even with a well stabilized process of manufacturing, it is crucial to control all the steps [5,13].
1.2.2. Upstream Processing
The manufacturing process begins with the isolation of the desired gene and its insertion on the plasmid, a process known as vector construction. Generally, the vector consists of a plasmid backbone that includes very common elements like one replication origin, a stronger promoter, a polyadenylation signal sequence, an antibiotic resistance gene and the encoding therapeutic gene. Next, the host cells to take up the designed vector need to be prepared. All process is well characterized and has been used for years, making the vector construction and cell bank preparation to take about 1-2 weeks. The use of antibiotics assist the strains selection [3,5]. The most commonly used host for pDNA production is the bacterium Escherichia coli (E. coli) for high cell-density cultivations (HCDC). Several strains have been reported to be effective in the pDNA production and most of them are selected because of its well documented usage in laboratory-scale protocols. For HCDC, the commercial E. coli DH5α strain still have some drawbacks, like the increased aerobic acetate production that causes loss of productivity and waste of carbon source. Even so, this commercial strain has a higher production when compared with the other strains like DH5, DH1, DH10B and JM108 that are used in laboratory-scale as well. In addition, the DH5α strain cultivations have a higher supercoiled fraction in comparison with the above cited strains. For a plasmid size of 6.1 kbp, the commercial E. coli DH5α have shown to produce 12.73±0.10 mg/L of pDNA with 80% of supercoiled fraction, when cultivated with 100 g/L of glucose to achieve the HCDC in batch mode [5,20].
Nevertheless, the host and strain selection is by far the only factor to have in concern. Other factors as medium composition, growth temperature, and time of fermentation are also very important and have a direct relation on the quality and quantity of the product. At laboratory scale, the production of plasmids seems to be relatively easy and simple once the fermentations are conducted in a batch mode and the quantity needed it’s not very high [5]. Plasmids represents around 3% WW-1 of the E. coli total extract, and since the open circular and linear
ones are considered unsatisfactory by the regulating agencies, the final and desired product will be even smaller [5,13]. Biomass productivity (volumetric yields), plasmid number of copies (specific yields) and quality are key concerns that have to be improved trough the optimization of the biological production system for an economically affordable industrial scale-up. In this process, for an optimal plasmid production both volumetric and specific yields have to be maximized. Thus, high volumetric yields will enable smaller and economical fermentations and high specific yields will increase the plasmid purity leading to an easier and reliable economic separation and purification process [5].
1.2.3. Downstream Processing
Sequentially, after the whole production procedure, the recovery and purification processes are necessary. These include the cell harvest, lysis, separation of the cellular debris, clarification, chromatographic purification and concentration [3,13]. In general, this is the most technically difficult part, since the product of interest are labile requiring mild processing conditions. Specially in this case, pDNA has some concern associated with the conventional purification of biological samples [13]. These major concerns are related substantially with the pDNA structural nature, mainly the conformation. As stated before, only the supercoiled fraction has clinical importance, as it presents higher biological activity. The diversity of biomolecules present in the pDNA containing extracts and the structural and chemical similarities between the pDNA and impurities are also some of the central challenges for the recovery and purification of pDNA [3,13]. Actually, most of the critical contaminants share some similar characteristics like: negative charge (RNA, genomic DNA, and endotoxins), identical size (genomic DNA, endotoxins) and hydrophobicity (endotoxins). Samples with these kind of complexity and similarities usually require the establishment of purification processes with larger number of steps to efficiently separate the different species [5,13]. However, the intensification of the process steps in extraction, isolation and purification induce a considerable structural stress which can result in damage of the supercoiled isoform. Once more, it is crucial to evaluate every step previously in order to avoid product degradation and maximize the product yield [3,13].
Before the lyses, the cell harvest must be performed. This is a process that will decrease the fermentation volume by concentrating the cells 3 to 5 times. Depending on the scale, either centrifugation or filtration are suitable to be used on the cell harvesting. The filtration step needs to minimize shear and permeate control. On the other hand, centrifugation is more cost-effective at large scales but to maintain the throughput necessary, high shear forces are needed; therefore, filtration should be preferred at all scales [5,13].
On the lysis process, the main goal is to disrupt the cell to release the pDNA and eliminate the solid debris. There are chemical, physical and mechanical methods for this step, however for pDNA recovery, alkaline lysis accompanied by the use of detergents such as Triton was developed many years ago and it still is one of the most methods used at laboratory-scale. This is a very well stabilished method, since the detergent solubilizes the cell wall and the alkaline environment denatures the genomic DNA. Generally, after the chemical lysis, a chemical precipitation is performed in order to remove major impurities such as high molecular weight RNA, proteins, endotoxins and genomic DNA and concentrate the sample. It is important to mention that this last step is not a good process for the scale up and other methods should be considered for an industrial scale [3].
At the end of the lysis step the sample remains with some of the impurities and most important, all the plasmid conformational states are present[13],but the initial volume decrease substantially and more vital, the pDNA molecule is maintained in solution which will facilitate the purification process [3,13]. There are a few purifications processes, but liquid chromatography (LC) is the most commonly used technology for biological sample purification, either as processing step or as analytical tool [5,17,18].
In the last few decades, some advances in the biotechnological areas have introduced several technologies for the purification of complex biomolecules [5]. Even so, an evaluation of the global process showed that the downstream operations have a significant relevance, being one of the most important and more expensive steps [5]. Some precipitation and ultrafiltration techniques can be involved in the isolation process, and also aqueous tow-phase systems have been applied in the purification steps; however LC is undoubtedly the most used technique [3,5].
Liquid chromatography is central not only to the small-scale purification of plasmids, but also to the industrial large-scale. This technique can be used as a purification step and as an analytical tool used for monitoring process development and product quality control [13,18]. The goal of LC as a separation step consists in the separation of the pDNA from residual impurities and undesirable isoforms through biomolecule capture and flow-through steps [5,18]. The different proprieties such as the size, the conformation form and hydrophobicity of different nucleic acids have been explored in order to give some insight about the possible interactions that are responsible for their adsorption process. Information is crucial to better understand the chromatographic step, with the final goal of improving future systems [5]. For a therapeutic application of pDNA, the final product has to be in a highly purified and homogenous preparation of sc isoform, to obey the strict guidelines established by the regulatory agencies. Table 1.2.1 shows the prerequisites of pDNA for therapeutic application [3,5,13].
To sum up, the development of a plasmid purification process must first consider the complex origin of the plasmid-containing extract. As stated before, one of the problems on the sc pDNA purification is mainly due to the physiochemical similarities between the target molecule and the contaminants. Unquestionably the central technique used to purify sc pDNA from its other isoforms and related impurities is liquid chromatography.
There are several chromatographic systems used to purify such molecules. These chromatographic systems and their differences will be addressed in the following chapter.
Table 1.2.1 – Agencies guidelines for application of pharmaceutical grade of sc pDNA.
FDA and EMEA Units
sc pDNA >97 %
gDNA <2 µg/mg pDNA
Proteins <3 µg/mg pDNA
RNA <0.2 µg/mg pDNA
1.3. Liquid Chromatography technique for pDNA purification
Mikhail Tswett defined chromatography as: “Any liquid or gaseous mixture of the substances is divided into its components during the process of its movement through a layer of sorbent, if there are differences in sorption interaction between the components of the mixture and the sorbent” [21]. Nowadays, LC can be defined as a two-dimensional process that employs a fixed-bed, known as the stationary phase, to separate a mixture of components that are carried though the bed by a fluid phase known as the mobile phase. When different components are fed into the stationary phase, they are expected to have different types of interaction. The feed components that interact more strongly with the stationary phase are retarded and are eluted later than those that interact more weakly and travel faster. Thus, the nature of interactions of solutes between the two phases depends on the molecular interactions between the feed components, the functional groups present on the surface of the stationary phase and the system conditions provided by the mobile phase. One exception is the size exclusion chromatography, where the stationary phase is steric leading to a separation based only on the size of molecules [22]. Table 1.3.1 provides a brief summary of the various branches of modern LC as they apply to biopolymer separation, defined by the type of stationary phase ligate. Table 1.3.1 - Branches of modern Liquid Chromatography summary.
Stationary phase
interaction type Mobile phase Branch Acronym
None Aqueous Size exclusion SEC
Hydrophobic
Normally an aqueous solution with high kosmotropic salt concentration. Elution
by decreasing salt concentration. Hydrophobic Interaction HIC
Charged
Normally an aqueous solution with low salt concentration. Elution with
increasing salt concentration. Ion exchange IEX
To the date, these chromatographic branches have already been applied to the pDNA purification with the goal to achieve higher productivities. Figure 1.3.1 illustrates the up mentioned separation principles for purification.
Size exclusion chromatography (SEC) fractionates the molecules based on molecular size. The molecules do not actually bind to the chromatographic support, which means that the buffer composition does not interfere on the resolution (the degree of separation between two peaks). SEC can be used in the pDNA separation due to the reduction of the plasmid hydrodynamic radius due to the supercoiling, however it’s advised to be used as a final polishing technique to separate it from RNA and smaller proteins. [3,13].
Hydrophobic interaction chromatography (HIC) is a well-established bioseparation branch that separates the biomolecules according to differences in their surface hydrophobicity by exploiting the reversible interaction between the molecule and the hydrophobic ligand on the support matrix surface. HIC was introduced as a pDNA purification method due to the fact that single stranded nucleic acid impurities (RNA and desaturated DNA) are more hydrophobic than double stranded DNA [5], thus being applied as a negative chromatography [17].
Ion-exchange chromatography (IEX) principle is based on the electrostatic interactions that occour between biomolecules and stationary phase. Thus, biomolecules are separated according to the differences in their net charges. Plasmid purification by IEX, more specifically anion-exchange chromatography takes advantage from the interaction between the negatively charged DNA backbone created by the phosphate groups and the positively charged ligands on the support surface. [5,13].
Affinity chromatography (AC) has been suggested as an alternative and high selective method that uses natural biological interaction processes such as molecular recognition on the basis of their biological function or chemical structure. In spite of its excellent selectivity, the method
Figure 1.3.1 - LC molecule-stationary phase base interaction illustration. Respectively SEC, HIC, IEX and AC [31].
suffers from limitations like slow kinetic and ligand fragility that are associated with low binding capacity [3].
As we have seen through this chapter, the ligands on the stationary phase have a crucial importance on the separation process [23]. Thus, the last decade of research brought also the attention to support matrixes composition [23–25]. At this moment, important information showed that not only the ligand itself but also support matrix composition, physical structure and ligand distribution have some contribution to the separation process [22,24–28].
1.3.1. Physical proprieties of different stationary phases.
The need for high amount of pharmaceutical-grade biomolecules with a therapeutic purpose brought the requirement for high production quantities [5]. Over the last three decades, there have been significant improvements on the upstream processes that have increased the feedstock concentrations. Unfortunately, there hasn’t been a concomitant increasing in the downstream processes improvements. As stated above, the downstream processes, more specifically the LC technique, are the most expensive part of the production system. The only way to reduce the costs of such an operation is to increase the overall throughput (i.e, increase the ratio final product per time unit). The most common way to accomplish this is to increase the scale of operation (e.g., increase the number or size of the chromatography columns) or by using continuous methods. Yet, another efficient method is to increase the stationary phase capacity of purification through an optimization of its physical and chemical proprieties [22,23]. Some desirable features for a stationary phase support matrix include low non-specific adsorption, high mechanical strength, high surface functionality for immobilization of ligands, absence of toxic leachable, and stability in solution used for cleaning and sanitation. A variety of materials are available that meet these requirements and form the basis for modern chromatography media, Figure 1.3.2. The Table 3.4.4 (appendix) summarize classification and properties of the different support media used in LC [22]. The majority of supports used to date are based on particles (beads) that are packed into a column forming a homogenous bed. More recently, the continuous stationary phases appeared, and are known as monoliths. The monoliths are produced in situ crating a network of pores or channels through which the fluid flows [5,23–25,28].
C D
A A
B
Figure 1.3.2 – Structure illustration of the different types of stationary phase’s composition. A) Gels (e.g. agarose, cellulose…) B) Rigid porous media (e.g. Silica, alumina…) C) Composite media (e.g. Silica/dextran, agarose/dextran…) D) Monoliths (e.g. Polyacrylamide) [22].
In order to attain a high productivity a high binding capacity is a crucial parameter. As we have seen in this work, the majority of separation techniques depends on the interaction between the ligand and the molecules. Thus, if the surface of interaction increases, the number sites available for the molecule to interact can also increase leading to a higher capacity [23]. Considering this strategy, both support matrices (beads and monoliths) used in these applications are usually porous [22,23]. The porosity is a form to enhance the surface area available as long as the pore size is sufficient to allow molecule diffusion through the porous network [22]. Some structural illustrations are shown on Figure 1.3.2.
Another important aspect of the construction of stationary phases is the form of how the surface modification is taken to introduce the ligands. The global ligand architecture will affect the binding capacities and sometimes non-specific interactions. These non-specific interactions may unpredictably influence the adsorption process for an individual molecule. Chemical modification is needed in order to functionalize the support matrix. Ligands need to be connected to the base material backbone. There are general possibilities to connect ligands to the pore wall of a resin. Moreover, the final formulation of matrix bound ligands is also a main properties that can influence the binding capacity [23]. A schematic representation is shown on Figure 1.3.3.
The purification of pDNA using conventional chromatographic media (packed beads) face some limitations, not only related to the similarities, but also related with the limitations of avaliable stationary phases, mainly because of their low capacity to bind large biomolecules. For instance, it has to be considered that the hydrodinamic radious of a pDNA molecule is larger than the average of a protein and has a very low diffusivity. Hence, the packed columns with soft chromatographic beads are limited by mechanical factors such as bed instability and mass transfer problems [5]. These drawbacks led to the development of monoliths. Chromatographic monoliths repersents the 4th generation of stationary phases. Consisting in a single piece of
highly porous material and a network of channels through which the mobile phase flows. The particular monolith structure inherently reflects in several key propreties such as: very high
A B C
Figure 1.3.3 - Different ligand architecture in the stationary phase pore; A) without spacer – Because they are connected directly on the surface wall, the interaction may be limited once many of them are accessible. B) with spacers – the spacers where designed to attend the accessibility problem, however, some controversial discussions throughout the literature whether it will be a source of non-specific interactions. C) Polymeric modification (Graft) – grafted ligands shows a more promising alternative for attend the accessibility drawback and have already showed a higher binding capacity [23].
porosity, high binding capacity for extremely large molecules and mass transport bases on convection [28]. Among to the different chromatographic stationary phases methacrylate monoliths seem to be especially attractive due to a short purification time, flow unafected properties, high dynamic bindig capacity and aplicability to industrial scale [26,28]. The typical plasmid size found in DNA vaccines ranges from 3 to 15kbp with the future expectation that the size could increse [3]. With the aplication of monolithic stationary phases, the “small” plasmid purificatin turned to be easier and separation of plamids up to 62kbp already began to appear [26–28].
1.3.2. Anion-Exchange Chromatography principles for pDNA purification
An Anion-Exchange chromatographic column consists of a matrix substituted with ionic groups that are positively charged. The first step in a chromatographic procedure is to equilibrate the stationary phase (Figure 1.3.4 A) with a buffer that has adequate pH and ionic strength to bind the negatively charged sc pDNA and not bind positively charged impurities. The bound biomolecules are concentrated in the column while biomolecules with the same charge as the medium pass through the column (flow through), eluting during or just after the sample application (Figure 1.3.4 B). After all the sample has been loaded into the column and non-binding biomolecules eluted (UV signal returns to baseline) conditions are altered by changing the buffer, usually increasing the ionic strength (salt concentration), leading to the elution of the bound biomolecules. These biomolecules start to elute as the ionic strength increases because salt ions start to compete for the medium binding sites (Figure 1.3.4 C). The first biomolecules to be eluted from the column are the ones with the lowest net charge at the
A B
C D
Figure 1.3.4 - Anion-exchange separation principles. Adapted from GE Healthcare handbook.
selected pH, thereafter, the ones with the higher net charge will be most strongly retained and be eluted last. Thus, controlling the changes in ionic strength, different biomolecules can be eluted differentially in a purified and concentrated form [29].
The final step is the regeneration of the column through the use of a very high ionic strength buffer that will remove all the tightly bound biomolecules (Figure 1.3.4 D). Before a next run, the column has to be re-equilibrated using the same initial conditions buffer and the process can work as a cycle [29].
Depending on the source of the feed material, various types of impurities (host cell proteins, nucleic acids, retroviral particles, process additives and lipids) if not removed during the washing, may be trapped in the chromatography medium causing carryover from one cycle to the next. In that case, cleaning-in-place (CIP) of the chromatography column is important for the integrity and safety of the final product. Sodium hydroxide is the gold standard for cleaning and sanitizing chromatography columns [30].
Different molecules exhibit different degrees of interaction with positively charged media according to their overall charge, charge density and surface charge distribution. Hence, the overall interaction between the pDNA and the stationary phase is based in the local attraction generated by the opposite charges. The isoforms will have different retention times in an increasing salt gradient, especially the supercoiled form which have a higher charge density, binds more strongly to the stationary phase eluting after the oc and the ln isoforms [5,13,18]. In addition to the charge density effect, the separation of linear isoforms it’s also affected by other parameters such as dispersive forces, hydrogen bonding, dipole-dipole attraction, solvophobic repulsion and AT content which can interfere with the charge density. Nevertheless, the selectivity towards pDNA or impurities (gDNA, RNA and endotoxins) is poor due to the non-specific binding to the anion-exchange stationary phase [5]. Still, when using anion-exchange chromatography to separate pDNA its advised load the sample at a high salt concentration (typically > 0.5 M NaCl) to avoid an unnecessary adsorption of low charge density impurities such as low MW RNA, oligonucleotides and proteins [18]. Under these conditions a significant amount of impurities elute in the flow through and the capacity can be fully exploited for pDNA adsorption. The Figure 1.3.5 shows the typical chromatogram of an anion-exchange chromatography separation process with the different isoforms retention times and elution salt concentration [44].
Some authors suggests that anion-exchange chromatography should be used in series with other purification techniques to guarantee the quality established by the regulatory agencies [5,18]. Notwithstanding, a single step pDNA purification have been further from happening. The combination of ion-exchange and hydrophobic interaction in a single monolith was developed creating the concept of conjoint liquid chromatography. This concept brought the possibility to
achieve a pDNA sample with the level required for human treatment in a single chromatographic step [26].
1.3.3. Hydrophobic Interaction Chromatography principles for pDNA purification
HIC separates molecules according to differences in their hydrophobicity by exploiting a reversible interaction between them and the hydrophobic surface of a HIC medium. Thus, molecules with different degrees of surface hydrophobicity can be separated. In contrast to anion-exchange chromatography, the interaction between the pDNA and the HIC medium is influenced significantly by the presence of kosmotropic salts in the running buffer. In pure water any hydrophobic effect is too weak to cause interaction between ligand and molecules or between the molecules themselves. However, kosmotropic salts enhance hydrophobic effect, and adding salts bring about binding of the target biomolecule to HIC media. High salt
Figure 1.3.6 - A) Highly ordered water shells surround the hydrophobic surfaces of ligands and proteins. Hydrophobic substances are forced to merge to minimize the total area of such shells. Salts enhance the hydrophobic effect. B) The equilibrium of the hydrophobic interaction is controlled predominantly by the salt concentration [31].
Figure 1.3.5 - Typical AEC chromatogram. (D) - Denaturated pDNA (OC) – open circular isoform (SC) supercoiled isoform. [60]
concentrations enhances the interaction while lowering the salt concentration weakens the interaction [31]. Figure 1.3.6 shows the main principles in HIC.
Hydrophobic effect depends on the behavior of the water molecules rather than on direct attraction between the hydrophobic molecules. Water is a good solvent for polar substances, but poor solvent for the non-polar ones. In liquid water, the majority of the water molecules occur in clusters due to hydrogen bonding between themselves [31], illustrated on Figure 1.3.7. Although the half-life of water clusters is very short, the net effect is a very strong cohesion among the water molecules. When a hydrophobic substance is immersed in water, the water molecules arrange themselves into a strong shell of highly ordered structure. Here, the possibility to form hydrogen bonds in no longer in balance, but is denominated by the hydrophobic substance immersed because the water molecules cannot “wet” the substance hydrophobic surface. Instead they form a highly ordered shell around the hydrophobic surface due to their inability to form hydrogen bonds in all directions. Minimizing the extent of this shell leads to a decrease in the number of ordered water molecules, that is, a thermodynamically more favorable situation in which entropy increases. So, in order to gain entropy hydrophobic substances are forced to merge to minimize the total area of such shells [31].
All three pDNA conformations interact with the hydrophobic surface of the HIC medium, but, as the buffer ionic strength (salt concentration) is reduced, the interaction is reversed and the molecule with the lowest degree of hydrophobicity is eluted first. The most hydrophobic elutes last, requiring a greater reduction in salt concentration [31].
The first step on a HIC chromatographic procedure is to equilibrate the medium with the selected buffer with adequate pH and salt concentration to bind the most hydrophobic species. When loading, the sample must have the same salt concentration as the equilibration buffer to ensure the molecules binding. The bound biomolecules are concentrated on the column while
Figure 1.3.7 - Solubilizing properties of water molecules and its ability to interact with dipoles and form hydrogen bonds [31] .
the molecules that don’t interact with the media flows through. After all the sample has been loaded into the column and non-binding biomolecules eluted, conditions are altered by decreasing the buffer salt concentration, leading to the elution of the bound biomolecules. The first biomolecules being eluted from the column are the ones with the lowest hydrophobicity at the selected ion strength, thereafter, the ones with the higher hydrophobicity that are strongly retained and be eluted last. Once more, controlling the ionic strength, different biomolecules can be eluted differentially in a purified and concentrated form [31].
The final step is the regeneration of the column through a zero salt concentration buffer that will remove all the tightly bound biomolecules. Before a next run, the column has to be re-equilibrated using the same initial conditions buffer and the process can work as a cycle [31]. HIC has also been used analytically for the monitoring and control of pDNA quality. The sc and oc pDNA isoforms ranging from 4 to 30 kbp were successfully resolved in a TSKgel Butyl-NPR analytical column (Tosoh). Due to the predominantly hydrophilic nature of pDNA, very high salt concentrations (about 3M of ammonium sulfate) is required to bind the sc pDNA onto the resin surface. A reverse salt gradient was used to elute the oc and sc isoforms sequentially. The separation of the isoforms was attributed to the increased exposition of hydrophobic bases as a consequence of the underwinding of the sc form [17].
1.4. Adsorption process and equilibrium
As discussed earlier in this work, the increasing demand for pharmaceutical-grade pDNA is requiring an improvement in the industrial purification systems. These improvements rely on the system optimization, and for that, it is essential to understand the mechanism underling the adsorption process onto the chromatographic media.
In general, adsorption is defined as the concentration of species at a solid surface. The chromatographic separations may involve many different non-covalent interactions between the molecule and the ligand on the solid support. The interaction with surface can result in two types of forces: dispersion-repulsion forces that are also known as London or van der Waals forces; and electrostatic forces which depends of the molecule net charge. Short-range repulsive forces are dominant very near the surface, but decrease rapidly as the distance from the surface increases, while electrostatic forces are generally longer range. As a result, the concentration of molecules near the surface varies with the distance from it. The process seems quite simple, however, adsorption of macromolecules is usually much more complicated and currently not amenable to a precise theoretical treatment [22].
There are several adsorption complicating factors, and as result of this complexity, empirical or semi-empirical approaches are generally needed to describe the adsorption equilibrium. The
prediction of multicomponent adsorption it’s even more challenging. Experimental determinations are almost always necessary. Thus, adsorption equilibria is frequently measured by suspending the particles in a protein solution and allowing the sufficient time for equilibrium to be attained. It is often easier to determine the ultimate binding capacity with a high protein concentration. However, the same can’t be applied when working with more labile molecules such as sc pDNA. In addition, determine the binding capacity at low concentration is often difficult since the time needed to achieve the equilibrium can become very long. Chromatographic methods like fontal analysis, isocratic elution and linear gradient elution can be one alternative to determine the adsorption equilibria with molecules like plasmids. In practice, in the context of a biopharmaceutical process development, acquisition of adsorption equilibrium data is often difficult because the amounts of pDNA can be very limited. As a result, care must be taken to ensure that precise data are obtained with minimal waste. Following empirical determinations of adsorption equilibria, the data is generally correlated using suitable adsorption isotherm expressions [22].
1.4.1. Langmuir Model and static binding capacity
The concentration of adsorbed molecule in the stationary phase at equilibrium with the mobile phase is expressed by the adsorption isotherm. The molecules are adsorbed on a fixed number of located sites, which can accept only one molecule, and are organized as monolayers. [22,32]. So, by definition the binding capacity can be defined as:
Q =
Bound moleculesVolume of packed resin (3)
The binding capacity (Q) has to be defined for a specific process, a specific resin and individual type of molecule [23]. The adsorption isotherms are obtained while maintaining constant the mobile phase composition, temperature and pH [22]. A linear relationship between the bounded molecules and free molecules at equilibrium, is expected in the low concentration range, but the relationship becomes non-linear at higher concentrations reaching to a maximum capacity. At high concentrations, the adsorption sites become saturated, leading to a curvature of the isotherm into an asymptote [1,32]. So, the linear limit is dependent on the concentration of accessible binding sites. Conversely, the maximum capacity is generally limited by the accessible area or by the mumber of binding sites [22].
A model commonly used to describe the protein adsorption equilibrium is the Langmuir isotherms, which was originally developed for adsorption of gases onto metal surfaces [1,22,23,32,33]. Ferreira et al (2000) tried to propose a model of adsorption-desorption of plasmid onto an anion-exchange support but given to some drawbacks, the Langmuir model was favored to study the plasmid adsorption mechanism [33]. The Langmuir model states that the molecules are adsorbed on a limited number of sites, which accepts only one molecule. Also, every adsorption site is energetically equivalent and there is no interaction between adsorbed


![Figure 1.3.7 - Solubilizing properties of water molecules and its ability to interact with dipoles and form hydrogen bonds [31] .](https://thumb-eu.123doks.com/thumbv2/123dok_br/19176478.943418/40.892.166.629.630.868/figure-solubilizing-properties-molecules-ability-interact-dipoles-hydrogen.webp)