February, 2007
THE EUROPEAN TOURISM REGIONS: LOCATION
AND ECONOMIC SIGNIFICANCE
Jorge Miguel Andraz Nélia Afonso Norte João Albino Silva Faculdade de Economia Faculdade de Economia Faculdade de Economia Universidade do Algarve Universidade do Algarve Universidade do Algarve Campus de Gambelas Campus de Gambelas Campus de Gambelas
8005-139 Faro 8005-139 Faro 8005-139 Faro
E-mail: jandraz@ualg.pt E-mail: nnorte@ualg.pt E-mail: jsilva@ualg.pt
Abstract
Tourism is one of the largest and fastest growing industries, playing a key role in the economic growth of many European countries, with direct and indirect impacts on other economic sectors through multiplier effects. The national authorities are aware of its role and have given important steps attempting to influence the number of visitors, the timing and duration of visits. Nevertheless, little is known about the relative importance of tourism on a regional basis and little has been done regarding the creation of a truly common european tourism policy.
This paper aims at providing an analysis of european regions regarding the importance tourism activities have on their economic structure. For analysis purposes, we consider regions Nuts II from a group of European Union western countries: Portugal, Spain, France, Luxemburg, the Netherlands, Belgium, The United Kingdom, Germany, Italy, Austria, Greece, Denmark, Ireland and Finland.
We start by outlining a quantified analysis of tourism activities structure in each country by building a weighted tourist location index in order to provide a ranking of regions by the importance those activities have on each country’s economic structure.
Finally, we analyse the basic trends of tourism policies international framework by focusing the main vectors of national policies, in particular, promotion, direct investment, subsidies, labour market intervention and regulation.
THE EUROPEAN TOURISM REGIONS: LOCATION
AND ECONOMIC SIGNIFICANCE
1. Introduction
Tourism is one of the largest and fastest growing industries, playing a key role in the economic growth of many European countries, with direct and indirect impacts on other economic sectors through multiplier effects. The tourism sector has suffered an exponential growth all over Europe, in particular since de beginning of the 80s. Is has become an extremely important engine of the growth process across European countries. The growth magnitude of this industry translates into a significant presence in economic activity and the positive evolution of the main supply and demand indicators. Over the last decade, the number of bed-places increased by 14,6% and the number of nights spent by non-residents in hotels and other similar establishments raised by 82,1% (source: Eurostat).
The increased relevance of tourism in the development processes of economies is mirrored in the increased importance given to its role at regional level. In fact, tourism activities are often considered regional alternatives to structural weaknesses that characterize most of the traditional economic sectors. National authorities are aware of its role and have given important steps attempting to influence the number of visitors, the timing and duration of visits. Nevertheless, little is known about the relative importance of tourism on a regional basis and little has been done regarding the creation of a truly common European tourism policy.
Therefore, this amazing dynamic, together with regional economies specialization, makes urgent the discussion on the tourism’s potential for regional development and the situation of the sector at national level should not misleading the regional differences in tourism patterns that result from location factors and differences in regional productive structures.
The objectives of this paper are twofold. First, through the use of a weighted tourist location index, we provide a ranking of regions by the importance of tourism activities. This type of analysis allows us to assess the eventual relationship between the significance of tourism in a region and the region’s economic importance. Second, we analyse the basic trends of tourism policies international framework by focusing the
main vectors of national policies, in particular, promotion, direct investment, subsidies, labour market intervention and regulation.
This paper is organised as follows. Section 2 briefly describes the data and its main stylized facts. Section 3 describes the regional tourism importance procedure adopted in this paper. Section 4 applies the methodology using the selected data and identifies the countries and regions in which tourism activities assume higher expression. Section 5 describes the main vectors of tourism national policies. Finally, Section 6 concludes the paper.
2. Data Sources and Description
To identify the relative importance of tourism activities in regions we follow a two-step procedure. First, we identify the absolute importance of tourism in each region. Second, we apply this information to assess each region’s relative importance in the European context. Therefore, we need two types of data: regional data on tourism to perform the analysis in absolute terms and regional economic and social data to perform the analysis in relative terms.
We consider aggregate data and regional data for the administrative regions Nuts II of fifteen European Union member states: Belgium, Denmark, Germany, Finland, France, Greece, United Kingdom, Ireland, Italy, Luxembourg, the Netherlands, Austria, Portugal, Sweden and Spain. Altogether, the analysis involves one-hundred and fifty seven regions Nuts II.
2.1 Tourism data
The data on tourism includes the main vectors directly related to the activity. We use data on number of bed places, number of nights spent by residents and non-residents in hotels and similar establishments, as well as on employment in a subgroup of the services sector in 2004. The activities included in the services sector are wholesale and retail trade, repair of motor vehicles, motorcycles and personal and household goods; hotels and restaurants; transport, storage and communication. These activities are supposed to be impacted both directly and indirectly by tourism activities. Data on tourism demand and employment comes from statistical issues published by the
Eurostat, which is also available at http://epp.eurostat.ec.europa.eu/.
In terms of the countries’ share of tourism variables in the European context, Germany, Italy, France, the UK and Spain are by far the most important countries. Together, they account for 76.5% of the total number of bed-places, 88.5% of the total number of nights spent by residents, 61.5% of the total number of nights spent by nonresidents and 77.5% of the total employment in the services sector.
Table 1: Countries’ shares on tourism variables in 2004
Countries’ Shares (%) Countries
Bed-places Nights by residents Nights by non
residents Employment Luxembourg 0.14 0.01 0.29 0.10 Denmark 0.70 0.70 1.18 1.61 Sweden 1.91 2.35 1.25 2.26 The Netherlands 1.91 1.97 3.61 4.79 Finland 1.21 1.43 0.93 1.30 United Kingdom 12.29 15.21 13.27 17.99 Austria 5.73 0.94 13.61 2.56 Belgium 1.23 0.58 2.54 2.48 Germany 16.17 22.62 9.04 19.65 France 12.72 16.87 8.38 13.76 Italy 20.09 19.54 23.97 13.81 Spain 15.19 14.29 6.81 12.30 Greece 6.71 1.90 9.45 3.14 Portugal 2.55 1.59 5.67 3.05 Ireland 1.45 1.25 1.94 1.19
Source: authors’ calculation.
2.2 Economic and social data
Since countries, as well as regions, have different sizes it is necessary to calibrate the analysis with indicators of countries’ (and regions’) dimension in the European context. This will allow us to compare directly the importance of tourism among countries and regions of different sizes. We use the gross added value and the resident population as indicators of the economic importance of national economies. The data comes also from the Eurostat sources and is also available at http://epp.eurostat.ec.europa.eu/.
The countries with higher shares either in gross added value or resident population are again the same group described before as having the highest shares on tourism variables. In fact, the UK, Germany, France, Italy and Spain account for 78.6%
of the European gross added value and 79.1% of the total resident population.
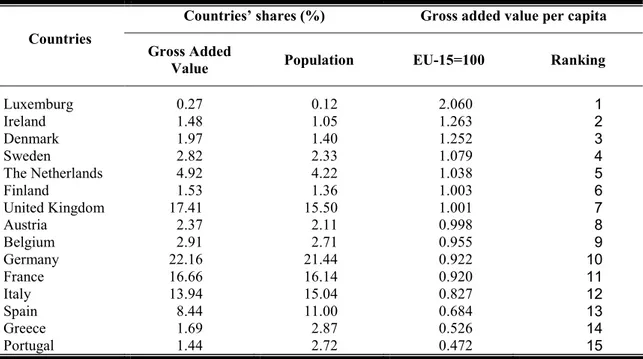
Table 2: Countries’ shares on GDP and resident population in 2004
Countries’ shares (%) Gross added value per capita Countries
Gross Added
Value Population EU-15=100 Ranking
Luxemburg 0.27 0.12 2.060 1 Ireland 1.48 1.05 1.263 2 Denmark 1.97 1.40 1.252 3 Sweden 2.82 2.33 1.079 4 The Netherlands 4.92 4.22 1.038 5 Finland 1.53 1.36 1.003 6 United Kingdom 17.41 15.50 1.001 7 Austria 2.37 2.11 0.998 8 Belgium 2.91 2.71 0.955 9 Germany 22.16 21.44 0.922 10 France 16.66 16.14 0.920 11 Italy 13.94 15.04 0.827 12 Spain 8.44 11.00 0.684 13 Greece 1.69 2.87 0.526 14 Portugal 1.44 2.72 0.472 15
Source: authors’ calculation.
Attending to gross added value per capita, the numbers depict a different picture and a clear geographic pattern, in which it is possible to identify three groups. The first group of countries, with gross added value per capita above the European average is composed by the northern countries of Luxemburg, Ireland, Denmark, Sweden, the Netherlands, Finland and the United Kingdom, being Austria the exception as it is located in the center of the European mainland. The second group, with values marginally lower than the average is composed by Belgium, Germany and France. Finally, the third group is composed by southern countries as Italy, Spain, Greece and Portugal.
3. Methodological framework
The first step of our analysis consists in calculating a weighted structure of the tourism variables. The spatial patterns of tourism supply and demand, as well as the employment directly connected to the tourism sector are integrated in one single vector, called tourism vector weighted index (TVWI). This coefficient was firstly proposed by Silva and Silva (2003) and applied to the Portuguese regions (Nuts III). This indicator
summarizes all the tourism activity components and weights differently the vectors according to their relative importance in strengthening the tourist structure of each region. Therefore, it weights heavily the components which are more representative of tourism economy and generate higher potential impacts on the regions’ economic structure, in particular the employment, the number of bed-places and the number of nights spent by non-residents in hotels and other similar establishments.
The TVWI for region i is obtained by the following expression:
8 2 3
2BPi Ei NNi NRi
TVWI = + + + ,
where, AHi represents the regional share of bed-places; Ei represents the regional share
of employment in the previous mentioned sectors; DEi represents the regional share of
the number of nights spent by non-residents; and DNi represents the regional share of
the number of nights spent by residents.
Since the regional structure of the considered variables is strongly affected by the regional economic and social dimensions, the previous coefficient is calibrated by the regional gross added value and population shares. This correction leads to the weighted tourist location index. This index is calculated for each region as
(
)
2 i i i RP GAV TVWC WTLI + = ,where, GAVi represents the share of regional gross added value and RPi represents the
share of resident population. By this analysis we identify not only the absolute importance of tourism in each region, but also its importance relatively to the regions’ dimension in terms of product and population.
According to the location index values, we can classify the regions in either one of the following groups: extremely intense location (for values above 10), intense location (for values between 1 and 10), moderate location (for values between 0.75 and 1), reduced location (for values between 0.25 and 0.75) and extremely weak location (for values under 0.25).
4. Identifying the European Tourism Regions
We start by introducing the results at the nation-wide level. Although this is not the focus of our discussion, we start with the aggregate analysis to bring a general perspective to the regional-level results that follow.
4.1 The country level analysis
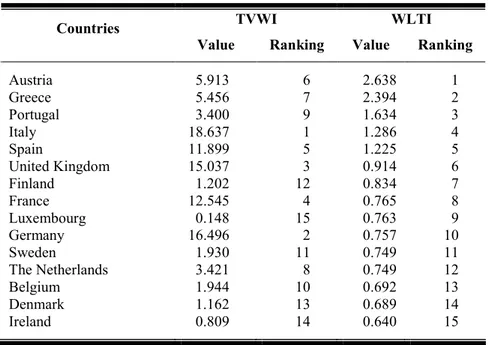
The results of TVWI and WLTI are reported in Table 3. The empirical evidence points toward the idea that the macroeconomic structure of the countries is not positively correlated with their share in tourism demand and supply variables. In general, we observe precisely the opposite as the countries’ position in TVWI ranking is more or less inverted when compared to what is observed with the gross added values per capita. Countries like Luxemburg, Ireland, Denmark, Sweden, the Netherlands and Finland which depict the highest shares of gross added value per capita are in the lowest positions regarding the tourism vector structure. This issue explains the changes in the ranking when the tourism relative measure of importance is calculated.
Table 3: Weighted tourism indexes
TVWI WLTI Countries
Value Ranking Value Ranking
Austria 5.913 6 2.638 1 Greece 5.456 7 2.394 2 Portugal 3.400 9 1.634 3 Italy 18.637 1 1.286 4 Spain 11.899 5 1.225 5 United Kingdom 15.037 3 0.914 6 Finland 1.202 12 0.834 7 France 12.545 4 0.765 8 Luxembourg 0.148 15 0.763 9 Germany 16.496 2 0.757 10 Sweden 1.930 11 0.749 11 The Netherlands 3.421 8 0.749 12 Belgium 1.944 10 0.692 13 Denmark 1.162 13 0.689 14 Ireland 0.809 14 0.640 15
Source: authors’ calculation.
The countries with higher gross added values, show lower dynamic in terms of tourism activity. This is the case of Germany, Sweden, the Netherlands, Belgium, Denmark and Ireland which are in the last six positions of the ranking. The middle
income group, composed by the UK, Finland and France and Luxemburg, is also located in the middle position of the location index ranking. At last, in the first positions of the ranking are Greece, Portugal, Italy and Spain, which occupy the lowest positions in gross added value, together with Austria.
4.2 The regional level analysis
We consider now the results of the location index at the regional level. The results for each country are reported in Tables 4 to 18.
Austria
Austria is the first country of the WTLI ranking. The values range from 10.754 to Tirol, which is fourth in the ranking, to 1.045 to Niederösterreich. The disaggregate results justify the first position of the country at the European level since all regions report values for the location index above unity. Nevertheless, it is important to note that of the nine regions of the country, Tirol report an extremely intense location of tourism, with a value more than ten times above the combined regional shares of product and population. It also should be noted that other regions like Salzburg, Vorarlberg and Kärnten report values more than three times above the regions relative dimension. These results reflect the huge importance of tourism to all regions and in particular to these regions.
Table 4: Weighted tourism location index for Austria
Nuts II WTLI Ranking
Austria 2.638 1 Tirol 10.754 4 Salzburg 6.404 12 Vorarlberg 3.673 20 Kärnten 3.554 21 Burgenland 1.519 45 Steiermark 1.369 48 Wien 1.321 50 Oberösterreich 1.067 72 Niederösterreich 1.045 73
Figure 1: Map of regions Nuts II - Austria
Greece
Greece is ranked second in the location index ranking. The disaggregate results for the thirteen regions show a great variability. The values range from 18.067 to Notio Aigaio, which places this region in the top of the European ranking, to 0.695 to Dytiki Makedonia. This range of values includes a group of two regions with an extremely intense location of tourism, nine regions with an intense location, one region with moderate location and also one region with reduced location. Therefore, the results suggest that in most regions tourism assumes a huge importance an it exceeds the region´s relative importance in product and population. The two only exceptions are Attiki and Ditiki Makedonia which are indicated in Figure 2.
Table 5: Weighted tourism location index for Greece
Nuts II WTLI Ranking
Greece 2.394 2 Notio Aigaio 18.067 1 Ionia Nisia 11.103 3 Kriti 9.832 5 Voreio Aigaio 4.141 19 Peloponnisos 1.789 33 Kentriki Makedonia 1.547 44 Sterea Ellada 1.403 47 Thessalia 1.318 51 Anatoliki Makedonia, Thraki 1.241 58 Dytiki Ellada 1.194 63 Ipeiros 1.127 69 Attiki 0.975 80 Ditiki Makedonia 0.695 125
Figure 2: Map of regions Nuts II - Greece
Portugal
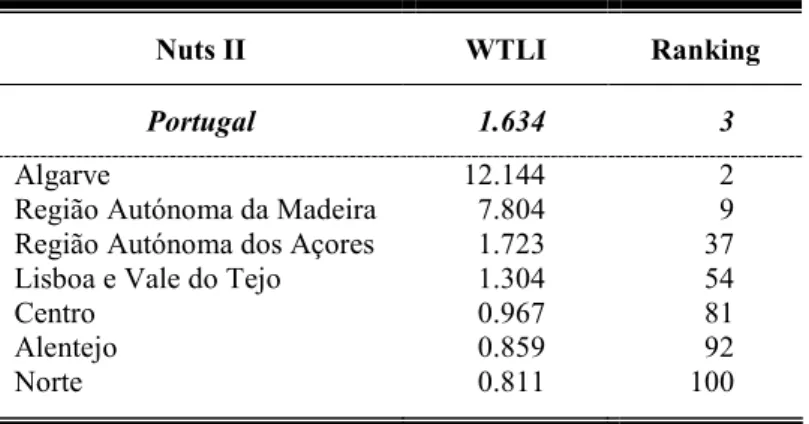
Portugal is ranked third in the location index ranking. The disaggregate results for the seven regions range from 12.144 in Algarve, which is ranked second in the European ranking, to 0.811 in Norte. The Algarve is the only region classified as having an extremely intense location of tourism; two other regions also reflect high values of the WTLI and are classified as having intense location of tourism. The remaining regions are of moderate location. Altogether, there are four regions with the WLTI above unity, in which the importance of tourism exceeds the relative dimension. These are the regions of Algarve, Lisboa e Vale do Tejo, Madeira and Açores. These regions are highlighted in Figure 3.
Table 6: Weighted tourism location index for Portugal
Nuts II WTLI Ranking
Portugal 1.634 3 Algarve 12.144 2 Região Autónoma da Madeira 7.804 9 Região Autónoma dos Açores 1.723 37 Lisboa e Vale do Tejo 1.304 54 Centro 0.967 81 Alentejo 0.859 92 Norte 0.811 100
Figure 3: Map of regions Nuts II – Portugal
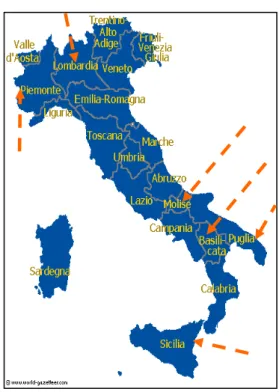
Italy
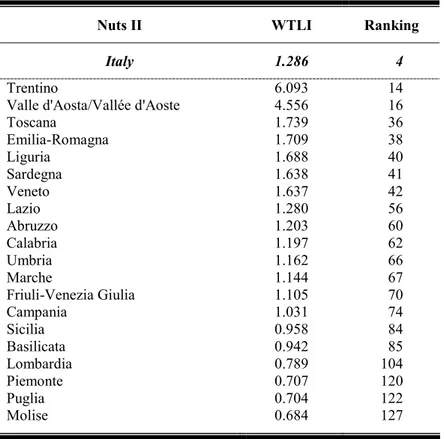
The country is ranked fourth in the location index ranking. The disaggregate results for the nineteen regions range from 6.093 in Trentino, which is ranked fourteenth in the European ranking, to 0.684 in Molise.
Table 7: Weighted tourism location index for Italy
Nuts II WTLI Ranking
Italy 1.286 4 Trentino 6.093 14 Valle d'Aosta/Vallée d'Aoste 4.556 16 Toscana 1.739 36 Emilia-Romagna 1.709 38 Liguria 1.688 40 Sardegna 1.638 41 Veneto 1.637 42 Lazio 1.280 56 Abruzzo 1.203 60 Calabria 1.197 62 Umbria 1.162 66 Marche 1.144 67 Friuli-Venezia Giulia 1.105 70 Campania 1.031 74 Sicilia 0.958 84 Basilicata 0.942 85 Lombardia 0.789 104 Piemonte 0.707 120 Puglia 0.704 122 Molise 0.684 127
The country accounts for fourteen regions of intense location of tourism, in which the WTLI assumes higher values. This reflects largely the importance of tourism to these regional economies. The remaining regions, which are located in the north and the south of the country, with lower values are highlighted in Figure 4.
Figure 4: Map of regions Nuts II – Italy
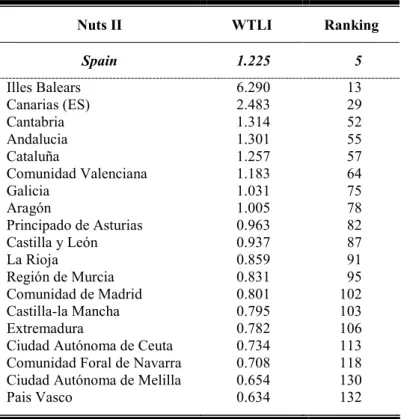
Spain
Spain is the fifth country of the ranking and is composed by nineteen regions. The results range from 6.290 in Illes Baleares, which is assumed as the main tourism destination in the country and is ranked thirteenth, to 0.634 in Pais Vasco. The country accounts for eight regions of intense location of tourism, in which the importance of tourism activities exceeds the regions’ relative dimension. These regions are indicated in Figure 5. There are also seven regions of moderate location and four regions of reduced location.
Table 8: Weighted tourism location index for Spain
Nuts II WTLI Ranking
Spain 1.225 5 Illes Balears 6.290 13 Canarias (ES) 2.483 29 Cantabria 1.314 52 Andalucia 1.301 55 Cataluña 1.257 57 Comunidad Valenciana 1.183 64 Galicia 1.031 75 Aragón 1.005 78 Principado de Asturias 0.963 82 Castilla y León 0.937 87 La Rioja 0.859 91 Región de Murcia 0.831 95 Comunidad de Madrid 0.801 102 Castilla-la Mancha 0.795 103 Extremadura 0.782 106 Ciudad Autónoma de Ceuta 0.734 113 Comunidad Foral de Navarra 0.708 118 Ciudad Autónoma de Melilla 0.654 130 Pais Vasco 0.634 132
Source: authors’ calculation.
The United Kingdom
The United Kingdom is the sixth country of the ranking and is composed by eleven regions. The results range from 9.659 in London, which is assumed as the main tourism destination in the country and is ranked sixth, to 0.499 in West Midlands. All regions of the country are classified as having intense location of tourism. These results imply that all regions report values for the WTLI above unity and reflect the huge importance of this activity for the regional economies’ performance.
Table 9: Weighted tourism location index for the United Kingdom
Nuts II WTLI Ranking
The United Kingdom 0.914 6
London 9.659 6
Yorkshine and the Humber 9.489 7
South East 8.473 8
South West 7.677 10 North West including Merseyside 4.532 17
Eastern 3.033 23 East Midlands 2.845 25 Scotland 2.651 27 Wales 2.359 30 North East 1.698 39 West Midlands 1.568 43
Source: authors’ calculation.
Finland
Finland is ranked seventh and accounts for five regions. The results range from 2.511 in Åland, which is assumed as the main tourism destination in the country but is ranked twentieth-eight, to 0.717 in Länsi-Suomi. Therefore, there isn’t one single region of extreme intense location of tourism. Instead, two regions are considered as being of intense location, and other two regions of moderate location. Finally, one region is classified as of reduced location. Only two regions record values of the WTLI above unity. They are Åland, in the south and Pohjois-Suomi (Lappi) in the north of the country, as indicated in Figure 7.
Table 10: Weighted tourism location index for Finland
Nuts II WTLI Ranking
Finland 0.834 7 Åland 2.511 28 Pohjois-Suomi (Lappi) 1.165 65 Itä-Suomi 0.893 90 Etelä-Suomi 0.786 105 Länsi-Suomi 0.717 115
Source: authors’ calculation.
France
France is ranked eight and is composed by twenty-one regions. The results range in a narrow set of values. The highest value of 1.759 is achieved in Corse, which is ranked thirtieth-four, and the lowest of 0.578 is obtained in Lorraine. The country accounts for two regions of intense location of tourism, eight regions of moderate location and twelve regions of reduced location. Therefore, the country accounts for two only regions in which the importance of tourism exceeds their relative dimension. These are Corse and Provence-Alpes-Côte d'Azur, as indicated in Figure 8.
Table 11: Weighted tourism location index for France
Nuts II WTLI Ranking
France 0.765 8 Corse 1.759 34 Provence-Alpes-Côte d'Azur 1.002 79 Bourgogne 0.902 88 Alsace 0.899 89 Basse-Normandie 0.846 93 Languedoc-Roussillon 0.832 94 Auvergne 0.826 96 Île de France 0.823 97 Rhône-Alpes 0.775 107 Poitou-Charentes 0.766 108 Aquitaine 0.726 114 Centre 0.707 119 Champagne-Ardenne 0.704 121 Bretagne 0.698 123 Limousin 0.677 129 Pays de la Loire 0.649 131 Franche-Comté 0.615 135 Nord - Pas-de-Calais 0.602 138 Haute-Normandie 0.600 139 Picardie 0.579 141 Lorraine 0.578 142
Figure 8: Map of regions Nuts II – France
Luxemburg
Luxemburg is ranked ninth in the European country level ranking but it constitutes one single region with a location index of 0.763. Therefore, as a region Nuts II it is classified as being of moderate location in the tourism activity.
Table 12: Weighted tourism location index for Luxemburg
Nuts II WTLI Ranking
Luxembourg 0.763 9 Luxembourg (Grand-Duché) 0.763 109
Source: authors’ calculation.
Germany
The country is composed by fifth teen regions and is ranked tenth. The results range from 7.575 in Nordrhein-Westfalen, which is ranked eleventh, to 0.088 in Bremen. Therefore, the regions’ classification includes the intense location category, with eleven regions, the moderate location with one single region and finally the extremely weak location category, with two regions. The most important regions in terms of tourism location are Nordrhein-Westfalen, Hessen, Bayern and Sachsen. Only
four regions record values for the WTLI lower than unity. These regions are indicated in Figure 10.
Table 13: Weighted tourism location index for Germany
Nuts II WTLI Ranking
Germany 0.757 10 Nordrhein-Westfalen 7.575 11 Hessen 4.698 15 Bayern 4.300 18 Sachsen 3.099 22 Schleswing-Holstein 2.856 24 Niedersachsen 2.791 26 Rheinland-Pfalz 1.873 32 Baden-Wurttemberg 1.752 35 Berlin 1.448 46 Hamburg 1.358 49 Sachsen-Anhalt 1.199 61 Brandenburg 0.960 83 Thuringen 0.708 117 Saarland 0.166 156 Bremen 0.088 157
Source: authors’ calculation.
Sweden
Sweden is the eleventh country of the ranking and is composed by eight regions. The results range within a small set of values, from 0.942 in Mellersta Norrland, which is assumed as the main tourism destination in the country but is ranked eightieth-six, to 0.622 in Östra Mellansverige. These values suggest a reduced importance of tourism activities in regional economies. Therefore, regions’ classification accounts for five regions of moderate location and three regions of reduced location. Such results imply that all regions record values for the WTLI lower than unity.
Table 14: Weighted tourism location index for Sweden
Nuts II WTLI Ranking
Sweden 0.749 11 Mellersta Norrland 0.942 86 Stockholm 0.820 98 Övre Norrland 0.803 101 Västsverige 0.756 110 Norra Mellansverige 0.752 111 Småland med öarna 0.715 116 Sydsverige 0.695 124 Östra Mellansverige 0.622 134
Source: authors’ calculation.
The Netherlands
The Netherlands is the twelfth country of the ranking and is composed by twelve regions. The results range from 1.312 in Noord-Holland, which is assumed as the main tourism destination in the country but is ranked fiftieth-three, to 0.446 in Groningen. Three regions are considered as being of intense location, one single region is classified as being of moderate location and eight regions are of reduced location. This means that the WTLI assumes values above unity in only three regions, which are indicated in Figure 11.
Table 15: Weighted tourism location index for the Netherlands
Nuts II WTLI Ranking
The Netherlands 0.749 12 Noord-Holland 1.312 53 Flevoland 1.230 59 Zeeland 1.068 71 Limburg (NL) 0.818 99 Friesland 0.738 112 Drenthe 0.625 133 Gelderland 0.568 144 Noord-Brabant 0.568 145 Zuid-Holland 0.537 147 Utrecht 0.516 150 Overijssel 0.512 151 Groningen 0.446 154
Source: authors’ calculation.
Figure 11: Map of regions Nuts II – The Netherlands
Belgium
The country is ranked thirteenth in the location index ranking. The disaggregate results for the eleven regions range from 1.135 in Prov. West-Vlaanderen, which is ranked sixtieth-eight in the European ranking, to 0.414 in Prov. Hainaut. The country accounts for three regions of intense location of tourism and eight regions with reduced location.
In the first group are the Prov. West- Vlaanderen, the Arr. de Bruxelles-Capitale and the Prov. Luxembourg located in the norwest, the center and the southeast of the country, respectively.
Table 16: Weighted tourism location index for Belgium
Nuts II WTLI Ranking
Belgium 0.692 13 Prov. West-Vlaanderen 1.135 68 Prov. Luxembourg (B) 1.011 76 Arr. de Bruxelles-Capitale/Arr. van Brussel-Hoofdstad 1.006 77 Prov. Vlaams Brabant 0.679 128
Prov. Namur 0.604 137
Prov. Liège 0.589 140
Prov. Antwerpen 0.571 143 Prov. Limburg (B) 0.554 146 Prov. Oost-Vlaanderen 0.531 148 Prov. Brabant Wallon 0.493 152 Prov. Hainaut 0.414 155
Source: authors’ calculation.
Denmark
Denmark is ranked fourteenth in the European country level ranking but it constitutes one single region with a location index of 0.689. Therefore, according to our scale, it is classified as being of reduced location in the tourism activity.
Table 17: Weighted tourism location index for Denmark
Nuts II WTLI Ranking
Denmark 0.689 14 Denmark 0.689 126
Source: authors’ calculation.
Ireland
The country is ranked fifteenth in the location index ranking. The country accounts only for two regions, namely the region of Southern and Eastern and the region of Border which report values for the location index of 0.611 and 0.517, respectively. Therefore, both regions are classified as being of reduced location.
Table 18: Weighted tourism location index for Ireland
Nuts II WTLI Ranking
Ireland 0.640 15 Southern and Eastern 0.611 136 Border 0.517 149
Source: authors’ calculation.
4.3 The Main European Tourism Regions
This paper analyzes empirically the relative importance of tourism activities for fourteen European countries at the aggregate and regional levels. More specifically, this paper presents a measure of the significance of tourism relatively to the countries’ dimension in terms of product and population, and relatively to the regions’ dimension. In doing so, we attempt to uncover the diversity behind the aggregate results and to identify the relative importance of tourism activities to regional economies.
The empirical analysis in this paper is based on data set on tourism supply and demand variables for 2004. Methodological speaking, we calculate a weighted location index, which accounts for the significance of tourism variables in each region relatively to regions’ economic and social dimensions.
Empirical results at the aggregate level suggest the existence of four groups of countries according to tourism importance of their economic structure. The first group, in which the index assumes values above one there are Austria, Greece, Portugal, Italy and Spain. Surprisingly, with the exception of Austria, these countries present lower performance in terms of macroeconomic variables. These countries are considered as having intense location of tourism activities. The second group, in which the index assumes values between unity and 0.75, includes the United Kingdom, Finland, France, Luxemburg and Germany. These countries are considered as having moderate location of tourism. Finally, the third group, with lower values, include Sweden, the Netherlands, Belgium, Denmark and Ireland. In these countries, we find a reduced location of tourism activities.
The pattern of results at the aggregate level opens the door to the next stage of our analysis: the index values calculation at the regional level. In fact, we found that the aggregate results mask a wide disparity of results at the regional level. In Austria, all regions are considered as having extreme intense location or intense location of tourism. In Greece, the classification ranges from the extremely intense location to reduced location. In Portugal, the classification ranges from the extremely intense location to moderate location. In Italy, Spain, Finland, France, the Netherlands and Belgium it goes from intense location to reduced location. In the UK, tourism is considered as having an intense location in all regions. In Luxemburg, there is a moderate location of tourism activities and in Germany, the classification ranges from intense location to extremely weak location. In Sweden it goes from moderate location to reduced location. In Denmark and Ireland, there is a reduced location of tourism activities.
The analysis allow us to establish a ranking of the European regions on the basis of the importance tourism has on their economic structure. Tourism presents an extremely intense location in Tirol in Austria, Notio Aigaio and Ionia Nisia in Greece, and Algarve in Portugal. In these regions, the location index assumes values of more than ten times the regions’ average dimension. Other regions also deserve a special remark for the index high values. These regions are Salzburg, Vorarlberg and Kärnten in Austria, Kriti and Voreio Aigaio in Greece, Madeira in Portugal, Valle d'Aosta/Vallée d'Aoste in Italy, Canarias in Spain, London, Yorkshine and the Humber, South East, South West, North West, Eastern, East Midlands, Scotland and Wales in the UK, Åland in Finland, Nordrhein-Westfalen, Hessen, Bayern, Sachsen, Schleswing-Holstein and Niedersachsen in Germany.