Economic and accounting evaluation of rice milled production chains in
Rio Grande do Sul (Brazil) and Uruguay with application of the Policy Analysis Matrix
Avaliação econômica e contábil das cadeias produtivas do arroz beneficiado no
Rio Grande do Sul (Brasil) e Uruguai com aplicação da Matriz de Análise de Políticas
Ângela Rozane Leal de Souza1* Jean Philippe Palma Revillion1 Paulo Dabdab Waquil1 Luiz Clovis Belarmino2 Bruno Antonio Lanfranco3
ISSNe 1678-4596
INTRODUCTION
In the global market, Brazil is the largest rice producer and consumer, after Asia. Most of this production is from the South region of Brazil, and the state of Rio Grande do Sul (RS) concentrates about 65% of the national production. Therefore, rice occupies a prominent position from the economic point of view in this region of the country (BRASIL, 2013).
Due to this importance, several studies showed the academic interest in topics such
as productivity, prices, costs, efficiency, and
competitiveness of rice production, focused both in the South region and Brazil as a whole, as well as in other countries of the Southern Common
Market (MERCOSUR) (ALVIM & WAQUIL, 2003; MARION FILHO & EINLOFT, 2008; CAPITANI et al., 2009; MARCHEZAN& SOUZA, 2010; HENKIN, 2010; IRETA-PAREDES et al., 2011; SOUZA & RÉVILLION, 2013; FINGER & WAQUIL, 2013).
Uruguay (comparison country in this study) produces just over 10% of the volume produced in Brazil. However, 95% of this production is for export, giving Uruguay the position of the largest rice exporter of in the MERCOSUR (MÉNDEZ, 2013). In this context, Brazil is one of the main markets of Uruguayan rice, whose destination is facilitated especially by both geographic proximity and customs union agreement (which aims at the free trade within the bloc).
1Universidade Federal do Rio Grande do Sul (UFRGS), Porto Alegre, RS, Brasil. E-mail: [email protected]. *Corresponding author. 2EMBRAPA - Empresa Brasileira de Pesquisa Agropecuária Clima Temperado, Pelotas, RS, Brasil.
3Instituto Nacional de Investigación Agropecuaria. Economia Aplicada. INIA-Las Brujas, Rincón del Colorado, Canelones, Uruguai.
ABSTRACT:Rice is the basis of diet for almost half of the world population, and its culture is one of the strategic agroindustrial production chains in the agribusiness environment, in both economic and social levels. Thus, the comparative analysis between the production chains of rice milled in Rio Grande do Sul (RS), Brazil, and Uruguay was mainly motivated by the interest in knowing the differences in the business environment and public policies that
impact the competitiveness of this chain in both study regions. Therefore, the objective of this study was to assess the economic efficiency, competitiveness,
and effects of public policies of the rice production chain of milled rice in RS (Brazil) relative to Uruguay. The data collected in this study are from the 2011-2012 harvests and indicators were calculated by applying the concepts of the policy analysis matrix (PAM). Results showed that the chains in both study regions were competitive under the existing market and policy conditions, revealed comparative advantage, transferred a high load of resources to other sectors of the economy, and satisfactorily remuneration of the domestic production factors. However, the competitiveness and comparative advantage shown in this study were not due to the encouraging intervention policies, as both production systems pay high taxes.
Key words:agribusiness, comparative advantages, rice cultivation, policy analysis matrix (PAM).
RESUMO: O arroz é a base da alimentação para quase metade da população mundial, e sua cultura se situa como uma das cadeias produtivas
agroindustriais estratégicas no ambiente do agronegócio, tanto no nível econômico como no social. Assim, a análise comparativa entre as cadeias
produtivas do arroz beneficiado no Rio Grande do Sul (RS), Brasil e no Uruguai foi motivada, principalmente, pelo interesse em conhecer as
diferenças no ambiente de negócios e nas políticas públicas que afetam a competitividade desta cadeia nas respectivas regiões. Portanto, o
objetivo deste estudo foi avaliar a eficiência econômica, competitividade, e efeitos de políticas públicas da cadeia produtiva de arroz beneficiado
no RS (Brasil) em relação ao Uruguai. Os dados coletados neste estudo são das safras de 2011-2012 e, os indicadores foram calculados aplicando os conceitos da matriz de análise de políticas (MAP). Os resultados mostraram que as cadeias em ambas as regiões de estudo foram competitivas sob as condições de mercado e políticas existentes, evidenciaram vantagem comparativa, transferiram alto volume de recursos para outros setores da economia, remunerando satisfatoriamente os fatores domésticos de produção. Entretanto, tal competitividade e vantagem comparativa demonstrada não se deveram às intervenções políticas de incentivo, pois ambos sistemas de produção pagam elevados tributos.
Palavras-chave: agronegócio, vantagens comparativas, orizicultura, matriz de análise de políticas (MAP).
In this scenario, comparative analysis of the production chains of milled rice in RS and Uruguay was motivated by two reasons: the interest in knowing the differences between the business environments and current public policies that impact chain competitiveness in both regions and relevance of assessing the impact of public policies on the
profitability and efficiency of this production chain
in these markets.
Given the scenario explained above, establishing a framework to analyze rice production or
marketing based on indicators of economic efficiency,
evaluating public policies and possible distortions in this market is important. The aim of this study was to
assess the competitiveness and economic efficiency
of the production chain of rice milled in RS compared to Uruguay using the policy analysis matrix (PAM).
It should be emphasized that competitiveness analysis in this study was based on the theoretical reference frameworks of MONKE & PEARSON (1989) and competitiveness theoretical concepts of comparative advantage (BALASSA, 1965; PORTER, 1985, 1990; FERRAZ et al., 1996). They are the basis of the comparative advantage concepts used as a measure of social or economic
profitability, i.e., they are measures that indicated efficiency in allocation national resources.
The policy analysis matrix (PAM) developed by MONKE & PEARSON (1989) is an accounting tool that allows both a detailed description of intra- and intersectoral interdependence and evaluation of effects of economic policies on agriculture. In the international economic literature, PAM has been used as a consolidated analytical method in performance evaluation of agricultural production systems (YAO, 1997; ADESINA & COULIBAL, 1998; PEARSON et al., 2004; NAJAFI, 2005; REIG et al., 2008; SABAOUHI et al., 2011; ELBADAWI; et al., 2013).
MATERIALS AND METHODS
Given the objectives of this study, it was
classified as exploratory, since competitiveness of the
milled rice production chain was assessed in different countries (Brazil and Uruguay), and this subject is still little explored (TRIVINOS, 1992; POPPER, 1998).To achieve the overall goal, the study involved a bibliographic and documental survey, as well as non-standardized interviews.
Regarding the problem, the study had a qualitative and quantitative nature. In the qualitative aspect, contexts and processes that could not be restricted to operationalization of the numerical variables were evaluated for the rice production chain. In the quantitative aspect, raw data analysis (private and social costs) was performed by using the policy analysis matrix (PAM).
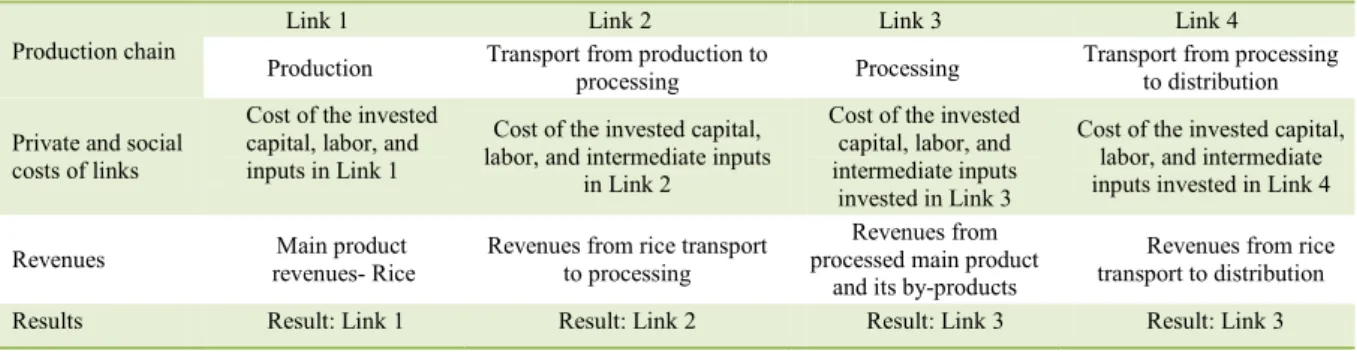
In order to build the PAMs and estimate the indicators, collection of data and information on private and social costs of the production links, transportation and processing of rice from RS and Uruguay, with the respective incomes obtained in each link (Table 1) were collected in the period Jan-Oct 2013. Technical visits were performed to obtain the primary and secondary data, with the institutional support of technicians from Embrapa Clima Temperado (Pelotas, RS, Brazil) and Instituto Nacional de Investigación Agropecuaria (INIA), together with the Uruguayan Departament o Estadísticas Agropecuarias (DIEA) and Ministerio de Ganadería, Agricultura y Pesca (MGAP).
The study was initiated with data from revenues and rice production costs in the establishments
of the primary sector. This was considered as the first
link in the production chain (Link 1). The second link was composed by the transport (Link 2) of rough rice from the production establishment to the industrial
Table 1 - The rice production chain and its links.
---Links of the rice production chain---
Production chain
Link 1 Link 2 Link 3 Link 4
Production Transport from production to processing Processing Transport from processing to distribution
Private and social costs of links
Cost of the invested capital, labor, and inputs in Link 1
Cost of the invested capital, labor, and intermediate inputs
in Link 2
Cost of the invested capital, labor, and intermediate inputs
invested in Link 3
Cost of the invested capital, labor, and intermediate inputs invested in Link 4
Revenues Main product
revenues- Rice
Revenues from rice transport to processing
Revenues from processed main product
and its by-products
Revenues from rice transport to distribution
milling plant. The establishment where the grain processing is performed, is the third link (Link 3). The fourth and last link is the freight from the third link to the marketing unit (Link 4).
The 2011-2012 harvest was analyzed and expressed in US dollars. In this period, the inputs and production factors were converted into the average US dollar value. To start the study, one establishment was considered to represent the production activity
and rice processing in the specific scenario of RS.
Data were collected directly from the accounting and administrative units, for both production costs and rice processing, and all values
were confirmed by technicians from Embrapa Clima
Temperado. Thus, the researcher technical visits to the units were accompanied by technicians from the EMBRAPA socioeconomic area. This procedure was adopted to obtain the accounting data and conduct
unstructured interviews with the financial supervisors,
producers, and managers of the units, and it was based on the integrated method spreadsheets included in the MS Excel editor.
In all cases in which secondary information was available at regional and national levels, values
and technical coefficients used in this study were
compared with the average values of the sector (CONAB, 2012) to verify the correct allocation of the data collected. Furthermore, additional data, survey of tax charges in both countries, transportation costs, port fees, storage costs, and import/export and
exchange tariffs were also obtained from official
organizations and experts acting in the market. The revenue and cost values were converted into the units most used in these economic analyses (hectare and tons). Then, the monetary values were converted into dollars per ton (US$/t) of processed product. In the respective calculations (input and factor prices, labor costs, and product prices), the components relative to subsidies, fees, taxes, social charges, and exchange variation, were considered in order to obtain the private costs and revenues. For social calculations, the production chain was completely alleviated from taxes and subsidies so that the effective total social chain contribution to the society could be evaluated. The data were analyzed
and interpreted in the light of theories and scientific
basis of the Policy Analysis Matrix (MONKE & PERSON, 1989; PEARSON et al., 2004).
RESULTS AND DISCUSSION
By performing the economic comparison between the competitiveness of rice production
chains in Uruguay and RS (Brazil) using the PAM method, applied to study links, the following results (Table 2) and indicators (Table 3) were obtained.
Table 2 shows that performance of the Uruguayan rice chain in rice production, transportation, and processing in the 2011/2012 harvest was more competitive than that one in Brazil
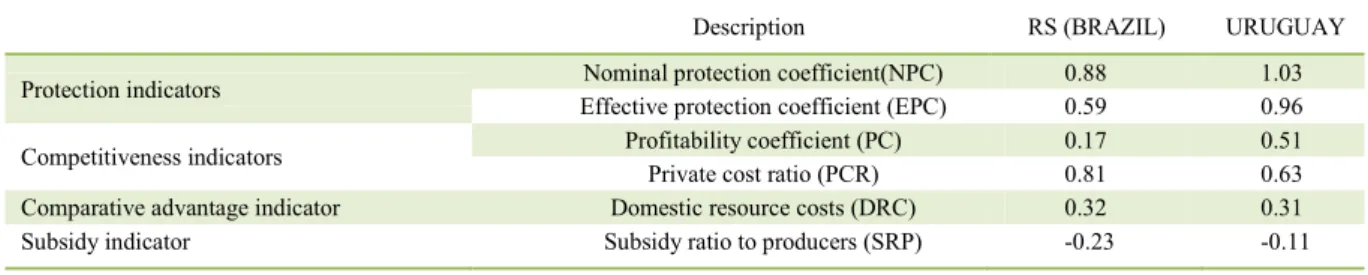
(RS). Regarding protection coefficients (Table 3), the nominal protection coefficient (NPC) indicated
that, differently from Uruguay, the prices practiced by the production chain in RS (Brazil) are below the international prices. Conversely, the effective
protection coefficient (EPC) indicated that the rice chain in the first region was strongly marked by taxes,
especially the production inputs. Although Uruguay has also adopted policies that cause distortion in the rice chain, this occurred in a much lesser degree (4%).
In Uruguay, rice production is closely linked to the international markets. In Brazil, rice is part of the basic food basket (related to food security), its production had successive government interventions that affected price changes. In Uruguay,
there is a significant degree of coordination between
producers and industry, and the production price has been established by private agreement between farmers and mills (GARCÍA et al., 2012).
Regarding the profitability coefficient
indicators (RS, Brazil: PC=0.17; Uruguay: PC=0.51),
an extremely reduced private profit was obtained
compared to what could be obtained in the chain
(social profit), in both RS (Brazil) and Uruguay,
although the reduction was lower in this country. As for the study chain capacity to ensure that the internal factor costs are covered and remain
competitive, this was confirmed by the private cost
ratio (PCR) indicator. Thus, the value of this indicator for Uruguay (PCR=0.63) was lower than that one for RS (PCR=0.81), showing that competitiveness of the rice chain in Uruguay is higher than that one in RS.
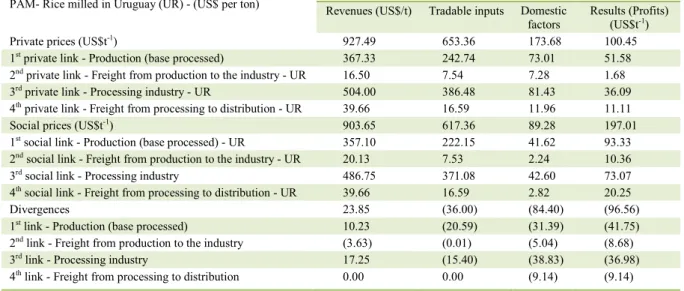
When the rice chain was decomposed in the production, processing, and transport links (Tables 4 and 5) and was examined, in RS and Uruguay there were main differences in the production and processing links and, to a lesser extent, in both transport links.
In tables 4 and 5, taking into account the
social profit of all chain links, one can see that the social profit in RS (Brazil) would be much higher
than in Uruguay, i.e., if the government interferences
and market failures were removed, the social profits
of the rice production and processing chains in RS would exceed those of Uruguay in almost 80%.
because this chain is highly demanding of tradable inputs and domestic production factors (land, capital, and labor). In addition, taxes on property, goods, and services, social charges on labor, and interests for capital recovery in Brazil are higher than those practiced in Uruguay.
The most significant differences between
the private and social values in the production link (Link 1) were due to capital costs, tax burden, and social charges in both study production chains. However, a 38% higher loss was observed in RS (subtracting the estimated subsidies). The main difference between them is that higher values in the social charges (58%), followed by total tax burden (ca. 40%) and capital cost (ca. 30%), were observed in RS relative to the same headings in Uruguay.
The costs of intermediate production inputs (Link 1) stand out as higher in RS relative to those in Uruguay in the following items: (A) conservation of
machinery, vehicles, and equipment (90% higher); (B) leasing (ca. 80% higher); and (C) items related to rice conservation and storage (ca. 80% higher).
Regarding transportation costs from production to processing (Link 2), the value for RS (US$1.07t-1) showed to be lower than that for
Uruguay (US$1.68t-1). However, these values are
low and; therefore, they have a low impact on the end result of the rice chain (adding the four links). As already mentioned in this study, the geographical proximity between production units and the industry in both RS and Uruguay allows that rates charged in bulk rice transports are negligible.
The processing link (Link 3) is one of those that have a greater impact on the chain. It is only less relevant than that of production (Link 1) in the degree of economic importance for the chain as a
whole. The financial, electricity, and rent costs in the
rice processing link (Link 3) in Uruguay showed to
Table 3 - Policy analysis matrix (PAM) coefficients for the production chain of milled rice in Rio Grande do Sul, RS (Brazil) and Uruguay- 2011/2012.
Description RS (BRAZIL) URUGUAY
Protection indicators Nominal protection coefficient(NPC) 0.88 1.03
Effective protection coefficient (EPC) 0.59 0.96
Competitiveness indicators Profitability coefficient (PC) 0.17 0.51
Private cost ratio (PCR) 0.81 0.63
Comparative advantage indicator Domestic resource costs (DRC) 0.32 0.31
Subsidy indicator Subsidy ratio to producers (SRP) -0.23 -0.11
Table 2 - Policy analysis matrix (PAM) results for the production chain of rice milled in Rio Grande do Sul (RS, Brazil) and Uruguay- 2011/2012 (US$ per ton).
Revenues (RS/BR) (US$/t)
---Costs - Rio Grande do Sul (Brazil) - (US$/t)---
PAM 1 Rio Grande do Sul
(RS/BR) Tradable inputs Domestic factors Profits (RS/BR) (US$t
-1)
Private prices A B C D
1,114.75 810.90 245.31 58.54
Social prices E F G H
1,265.09 746.57 165.83 352.69
Effects of divergences I J K L
(150.34) 64.33 79.48 (294.15)
---PAM 2---Uruguay (UR) Revenues (UR) (US$/t) Tradable inputs Domestic factors Profits (UR) (US$/t)
Private prices A B C D
927.49 653.36 173.68 100.45
Social prices E F G H
903.65 617.36 89.28 197.01
Effects of divergences I J K L
be greater than those in RS. In addition, the expenses with rice export from the Uruguayan chain, included
in these values are quite significant (about 20% of the
intermediate input costs). However, other production costs (packaging, rollers, other materials, etc.) and commission expenses were higher in RS. In this state,
the figure of intermediary agents is strongly present.
The presence of these agents is much reduced in the Uruguayan rice chain, in which the sales are generally
agreed by previous contracts between producers and processing industries.
Finally, according to the social results observed in the four links, this agroindustrial chain could achieve a higher performance in private profits in both study regions, especially RS. The results showed, the existence of high government aggravations in both rice chains. The economic efficiency could be much higher if Table 4 - Expanded policy analysis matrix (PAM) of the production chain of rice milled in Rio Grande do Sul (RS, Brazil) - 2011/2012.
PAM - Rice milled in Rio Grande do Sul (RS-Brazil) (US$ per ton)
---Costs (US$/t) - (RS/BR)---
Revenues (RS/BR)(US$/t)
Tradable inputs
Domestic factors
Results (RS/BR) (Profits) US$/t
Private prices (US$/t) 1,114.75 810.90 245.31 58.54
1st private link - Production (base processed) 444.54 263.67 163.20 17.67
2nd private link - Freight from production to the industry - RS 6.37 3.31 1.98 1.07
3rd private link - Processing industry – RS 594.18 507.68 62.17 24.33
4th private link - Freight from processing to distribution - RS 69.65 36.23 17.95 15.47
Social prices (US$/t) 1,265.09 746.57 165.83 352.69
1st social link - Production (base processed) – RS 574.32 221.07 116.72 236.52
2nd social link - Freight from production to the industry - RS 6.97 2.72 0.97 3.27
3rd social link - Processing industry – RS 614.15 496.15 37.48 80.52
4th social link - Freight from processing to distribution - RS 69.65 26.62 10.65 32.37
Divergences (150.34) (64.33) (79.48) (294.15)
1st link - Production (base processed) (129.78) (42.60) (46.48) (218.86)
2nd link - Freight from production to the industry (0.60) (0.59) (1.01) (2.19)
3rd link - Processing industry (19.97) (11.53) (24.70) (56.19)
4th link - Freight from processing to distribution 0.00 (9.61) (7.29) (16.90)
Table 5 - Expanded policy analysis matrix (PAM) of the production chain of rice milled in Uruguay - 2011/2012. Idem.
PAM- Rice milled in Uruguay (UR) - (US$ per ton)
---Costs (US$t-1)---
Revenues (US$/t) Tradable inputs Domestic factors
Results (Profits) (US$t-1)
Private prices (US$t-1) 927.49 653.36 173.68 100.45
1st private link - Production (base processed) 367.33 242.74 73.01 51.58
2nd private link - Freight from production to the industry - UR 16.50 7.54 7.28 1.68
3rd private link - Processing industry - UR 504.00 386.48 81.43 36.09
4th private link - Freight from processing to distribution - UR 39.66 16.59 11.96 11.11
Social prices (US$t-1) 903.65 617.36 89.28 197.01
1st social link - Production (base processed) - UR 357.10 222.15 41.62 93.33
2nd social link - Freight from production to the industry - UR 20.13 7.53 2.24 10.36
3rd social link - Processing industry 486.75 371.08 42.60 73.07
4th social link - Freight from processing to distribution - UR 39.66 16.59 2.82 20.25
Divergences 23.85 (36.00) (84.40) (96.56)
1st link - Production (base processed) 10.23 (20.59) (31.39) (41.75)
2nd link - Freight from production to the industry (3.63) (0.01) (5.04) (8.68)
3rd link - Processing industry 17.25 (15.40) (38.83) (36.98)
political reforms related to the social taxes and charges were proposed in both RS (where the difference between private and social results was very pronounced) and Uruguay.
Thus, this study allowed a deepening of this evaluation because it compared two regions using the MAP method (MONKE & PEARSON, 1989); based on the neoclassical theoretical basis of the nominal and effective protection theory (BALASSA, 1965) and competitive advantages (PORTER, 1990; FERRAZ et al., 1996).
CONCLUSION
The main objective of this study was
to assess the competitiveness and efficiency of the
production chain of rice milled in RS relative to Uruguay during the study period using the Policy Analysis Matrix (PAM). Thus, based on the PAM
indicators, it was possible to find that the chains in
both study regions were competitive in the existing market and policy conditions, revealed comparative advantage, transferred a high amount of resources to other sectors of economy, and satisfactorily remunerated the domestic production factors. However, such comparative competitiveness and advantage were not due to the incentive policy interventions, as both production systems suffered high taxation, although more strongly in RS. Despite this good performance, the rice chains in RS and Uruguay did not yet fully express their competitive potential.
The effects of the exchange rate variation
are among the aspects that influenced such
competitive potentials. For this reason, rice exported by Brazil and Uruguay becomes more competitive in the external market when the USA currency is
valued in both countries. Uruguay benefits from such
a situation because it exports about 95% of its rice production, and the effects of US dollar valuation in the positive private outcomes are evident. In RS, such effects can be observed in the inputs, but not as strongly in the prices, mainly because the rice market is essentially a domestic market. This is especially true because rice is one of the products of the basic food basket of Brazilians. A small portion (about 10%) of the production is for export, and the remaining is essentially consumed in the country (BRASIL, 2013).
Despite these differences in the demand, an indicator of extreme importance (domestic resource costs- DRC) was analyzed in this study, and virtually identical values were observed in both Uruguayan (DRC=0.31) and RS (DRC=0.32) rice chains. Such indicator showed that both chains use the domestic
resources with equal efficiency.
However, from the indicators analyzed in this study through the PAM, several factors that directly affect rice competitiveness in both study regions become clear. The outcomes showed that the tax burden, social charges, and capital costs in RS are greater relative to
Uruguay, confirming the need to adopt measures to
re-evaluate and promote policy reforms in this area.
In the data collected in this study, financial cost of fixed assets (fixed inputs) in RS is high, being significantly higher than that in Uruguay. In this country,
an effective system of providing services exists (as observed in the data of rice production link; Uruguayan
PAM) allowing that investments in fixed assets are minimized and a better efficiency is provided. Thus, this
study will permit that agents involved in the rice chain in
RS have inputs for reflection and evaluation of actions to
improve either organization of association activities or companies for provision of services related to planting, spraying, and harvesting rice.
The static nature of the PAM is a limitation of this study. Thus, considering the changes in the variables of possible scenarios for the study chain, sensitivity analyzes are suggested for future studies. Finally, extending the study of the rice chain to other MERCOSUR countries and expanding the analysis with focus on environmental questions are also suggested for future studies.
REFERENCES
ADESINA, A. A.; COULIBALY, O. N. Policy and competitiveness of agroforestry-based technologies for maize production in Cameroon: an application of policy analysis matrix. Agricultural Economics, Amsterdam, v.19, n. 1-2, p.1-13, 1998. Available from: <http:// www.sciencedirect.com/science/article/pii/S0169515098000516>. Accessed: Feb. 14, 2014. doi: 10.1016/S0169-5150(98)00051-6.
ALVIM, A. M.; WAQUIL, P. D. Acordos regionais de livre comércio e o mercado de arroz no Brasil. Revista de Economia e Agronegócio, v.1, n.3, p.315-340, 2003. Available from: <http:// www.novoscursos.ufv.br/projetos/ufv/rea/www/wp-content/ uploads/Artigo2_V1N3.pdf>. Accessed: Jan. 26, 2014.
BALASSA, B. Trade liberalization and ‘revealed’ comparative advantage. Manchester School of Economic and Social Studies, v.33, n.2, p.92-123, 1965.
BRASIL. Ministério da Agricultura, Pecuária e Abastecimento. Secretaria de Política Agrícola. Departamento de Comercialização e Abastecimento Agrícola e Pecuário. Análise do mercado
interno e externo do produto: arroz. Sumário Executivo
de Produtos Agropecuários - Arroz - 2013. Available from: <http://www.agricultura.gov.br/politica-agricola/publicacoes>. Accessed: Mar. 03, 2014.
CAPITANI, D. H. D. et al. Determinantes da demanda brasileira por importação de arroz do Mercosul. Revista de Economia e
<http://www.scielo.br/scielo.php?script=sci_arttext&pid=S0103-20032011000300002&lng=pt&nrm=iso>. Accessed: Jan. 12,2014. doi: 10.1590/S0103-20032011000300002.
CONAB (COMPANHIA NACIONAL DE ABASTECIMENTO).
Estimativas dos custos de produção de arroz. 2012. Available
from: <http://www.conab.gov.br/>. Accessed: Mar. 15, 2013.
ELBADAWI, E. et al. Assessing the competitiveness of sheep production in selected states in Sudan. Journal of Agricultural Science, v.5, n.1, p. 1-9, 2013. Available from: <http://www.ccsenet. org/journal/index.php/jas/article/view/20016>. Accessed: Jan. 28, 2014. doi: 10.5539/jas.v5n1p75.
FERRAZ, J. C. et al. Made in Brazil: desafios competitivos para a
indústria brasileira. Rio de Janeiro: Campus, 1996. 386 p.
FINGER, M. I. F.; WAQUIL, P. D. Percepção e medidas de gestão de riscos por produtores de arroz irrigado na Fronteira Oeste do Rio Grande do Sul. Ciência Rural, v.43, n.5, p. 930-936, 2013. Available from:<http://www.scielo.br/scielo. php?script=sci_arttext&pid=S0103-84782013000500029&lng =pt&nrm=iso>. Accessed: Jan. 15, 2014. doi: 10.1590/S0103-84782013005000033.
GARCÍA, F. et al. Efecto sobre el comercio y bienestar de
distintas estrategias tecnológicas para el arroz uruguayo. Série
Técnica INIA, 197, Jun. 2012. Available from: <http://www.inia.uy/ Publicaciones/Paginas/publicacion-2567.aspx>. Accessed: May 20, 2014. ISSN1688-9266.
HENKIN, H. (Org.). A economia do arroz: competitividade e estratégias de desenvolvimento da cadeia produtiva do Rio Grande do Sul. Porto Alegre: UFGRS, 2010.192 p. ISSN 978-85-386-0094-7.
IRETA-PAREDES, A. R. et al. Análisis de la competitividad de la cadena del arroz (Oriza sativa) con enfoque CADIAC, en el sur de Morelos, México. Agrociencia, México, v.45, n 2, p.259-265, Mar. 2011. Available from: <http://www.scielo.org.mx/scielo. php?script=sci_arttext&pid=S1405-31952011000200010&lng=pt &nrm=iso>.Accessed: Feb. 23,2014.
from: <http://bell.unochapeco.edu.br/revistas/index.php/rce/article/ view/189>. Accessed: Mar. 03, 2014. ISSN 1415-3939.
MARCHEZAN, A.; SOUZA, A. M. Previsão do preço dos principais grãos produzidos no Rio Grande do Sul. Ciência
Rural, v.40, n.11, p.2368-2374, 2010. Available from: <http://
www.scielo.br/scielo.php?script=sci_arttext&pid=S0103-84782010001100019&lng=en&nrm=iso>. Accessed: Feb. 01,2014. doi: 10.1590/S0103-84782010001100019.
MARION FILHO, P. J.; EINLOFT, N. E. A competitividade do arroz irrigado brasileiro no MERCOSUL. Organizações Rurais &
Agroindustriais, v.10, n.1, p.11-22, 2008. Available from: <http://revista.
dae.ufla.br/index.php/ora/article/view/88/86>. Accessed: Jan, 17, 2014.
MÉNDEZ, J. A. Produção vegetal: arroz (Anuario Estadístico Agropecuario) 2013. Available from: <http://www.mgap.gub.uy/portal/ page.aspx?2,diea,diea-anuario-2013,O,es,0,>. Accessed: May 16,2014.
MONKE, E. A.; PEARSON, S. R. The policy analysis matrix
for agricultural development. Ithaca and London: Cornell
University, 1989. 279p.
NAJAFI, B. Effects of government policies on wheat production in Iran: the application of policy matrix analysis. In: ECONOMIC RESEARCH FORUM 12th ANUUAL CONFERENCE, 19th – 21st, 2005, Cairo. Proceedings…Cairo, EGYPT: INSME 2005. Available from: <http://www.erf.org.eg/cms.php?id=conferences_ details&conference_id=3>. Accessed: Feb, 14, 2014.
PEARSON, S. et al. Applications of the policy analysis matrix in
indonesian agriculture. Jakarta: Indonesia, 2004. 368p.
POPPER, K. A lógica da pesquisa científica. São Paulo: Cultrix, 1998. 551 p.
PORTER, M. E. Competitive advantage. New York: Free Press, 1985. 557 p.
PORTER, M. E. The competitive advantage of nations. New York: Free Press, 1990. 897 p.
REIG, E. et al. The policy analysis matrix with profit-efficient data:
evaluating profitability in rice cultivation. Spanish Journal of
Agricultural Research, v.6, n.3, p.309-319, 2008. Available from: <http://revistas.inia.es/index.php/sjar/article/viewArticle/324>. Accessed: Jan. 12, 2014. doi: 10.5424/sjar%2F2008063-324.
SABAOUHI, M. et al. Economic evaluation and applications of the policy analysis matrix of sole and intercropping of leguminous and cereals case study: Shirvan city-Iran. African Journal of
Biotechnology, v.10, n.78, p.17948-17953, 2011. Available from:
<http://www.academicjournals.org/AJB>. Accessed: Jan. 27, 2014. doi: 10.5897/AJB11.403.
SOUZA, Â. R. L.; RÉVILLION, J. P. P. Rice production in Mercosur seen through a policy analysis matrix (PAM). Revista de Política Agrícola, v.22, n.1, p. 55-71, 2013. Available from: <http://ainfo. cnptia.embrapa.br/>. Accessed: Feb. 13, 2014. ISSN 1413-4969.
TRIVINOS, A. N. S. Introdução à pesquisa em ciências sociais: a pesquisa qualitativa em educação. São Paulo: Atlas, 1992. 175 p.