May, 2018
Francisco Luís Araújo do Carmo
Graduation in Engineering of Micro and NanotechnologiesStudy on production methods of Bioglass Porous
Structures for Bone Tissue Engineering
Dissertation to obtain the Master’s Degree in
Engineering of Micro and Nanotechnologies
Advisor: João Paulo Borges, Professor Auxiliar, FCT-UNL
Co-Advisor: Jorge Carvalho Silva, Professor Auxiliar, FCT-UNL
Panel:
Chairperson Hugo Manuel Brito Águas
Rapporteur Célia Maria Reis Henriques
iii
Study on production methods of Bioglass Porous
Structures for Bone Tissue Engineering
Copyright © Francisco Luís Araújo do Carmo, Faculty of Science and Technology, NOVA University of Lisbon
The faculty of Science and Technology and the NOVA University of Lisbon have the right, forever and without geographical limits, to file and publish this dissertation through printed copies reproduced in paper or by digital means, or by any other mean known or that may be invented, and to disclose it through scientific repositories and to allow its copyright and distribution for non-commercial educational or research purposes, provided that the author and editor are credited.
Copyright © - Todos os direitos reservados. Francisco Luís Araújo do Carmo; Faculdade de Ciências e Tecnologia, Universidade Nova de Lisboa.
v
Acknowledgements
First I would like to show my appreciation for the provided help, patience and availability that my advisor Professor João Paulo Borges offered throughout the several months to complete this study.
To my co-advisor Professor Jorge Carvalho Silva I thank all the explanations and suggestions given as well as the work done in the biological stage of this work.
To all the people who worked alongside with me in the “Laboratório de polímeros”: D. Augusta, Dr. João Canejo, Ana Almeida, Catarina and Dra. Susete I want to say thank you not only for the help provided but also for the proximity.
To the Professors Maria do Carmo Lança, Maria Margarida Lima and Regina Monteiro, I thank the help and equipment provided for the several tests and processes.
I’m also very thankful for all the good moments and for the support in desperation times given by some colleagues: Diogo Ramos, Andreia Lopes, Luís Martins, André Lopes, Cláudia Gouveia, Diogo Saraiva, Ana Gaspar and António Almeida who accompanied me through most of the work stages, helping me to achieve my goals.
I also would like to mention my college friends and housemates with whom I spend so much time and moments which I will never forget: João Mota, Bernardo Canelas, Mariana Barros, Marcos Rodrigues, Miguel Morais and Alexandre Mogárrio, thank you all for letting me be myself and help me grow as a person.
A special thanks to my big friend and colleague Eduardo Pontes for all things he taught me in the 3D printing area, all the long conversations, meals proportioned, relaxing breaks from the work that he kept pushing me to, for the videogame sessions and above all, for the friendship, that I’m sure will last for long.
A special thanks to the people who made this possible and that believed in me to accomplish the end of this journey. The people who showed their support no matter what, when or where. The people who always received me with open arms after long waiting months without seeing me or even hearing from me. To my family, my deepest of thanks.
vii
Resumo
O objetivo deste trabalho consistiu em estudar e produzir estruturas porosas à base de biovidro para aplicação como substituinte ósseo. Três métodos distintos de produção de estruturas foram usados assim como vários tipos de biovidro produzidos por sol-gel, como o 45S5 (45% SiO2; 24,5% CaO; 24,5%Na2O; 6% P2O5), o 80S20CC (80% SiO2; 20% CaO) e o 80S5P15C (80% SiO2; 5% P2O5; 15% CaO) (% mol).
Primeiramente estudou-se a fabricação de réplicas invertidas de cristais coloidais (ICCs). Para este efeito produziram-se microesferas de poliestireno por um processo de microfluídica. As esferas (~300 μm) foram depois introduzidas e organizadas numa estrutura hexagonal compacta centrada em poços de uma placa feita de Teflon. De seguida fez-se um tratamento térmico de maneira a que o poliestireno atingisse a transição vítrea permitindo a formação dos Cristais Coloidais (CCs). Utilizando diversos métodos de impregnação do sol-gel de maneira a preencher todo o espaço vazio entre as esferas dos CCs e fazendo tratamentos térmicos a mais de 900 ℃ para promover a densificação do material, não foi possível criar uma estrutura devido à reduzida massa de biovidro que se conseguiu impregnar nos CCs.
Para o segundo método foi utilizada a técnica de liofilização. Na produção de sol-gel estudaram-se diferentes concentrações de sólidos a 10, 12,5 e 15%. Estas soluções foram introduzidas em seringas, congeladas usando azoto líquido e liofilizadas. Apesar de algumas estruturas terem sido produzidas, estas possuíam muita irregularidade de poros o qua as tornou frágeis e difíceis de manusear. Um processo de sinterização foi feito na tentativa de as densificar mas sem sucesso.
Numa outra abordagem, a produção de um cimento à base de biovidro foi feita com a finalidade de obter estruturas porosas por impressão 3D. Dentro dos vários passos de otimização do método de produção, a otimização da pasta a imprimir e dos parâmetros de impressão foram os mais importantes. Após estes melhoramentos estruturas 3D foram impressas e sinterizadas a 1100 ℃. Através de imagens de microscopia eletrónica de varrimento (SEM) foi possível verificar a presença de uma superfície porosa. A densidade e porosidade das estruturas foi avaliada e obtiveram-se valores de densidade de 1,43 g/cm3 e de porosidade a 42%. Em estudos de compressão mecânica o máximo valor atingido foi de 6,5 MPa para a resistência à compressão e o módulo de Young foi calculado tendo-se obtido valores na ordem dos 80 MPa. Estudos de DRX e FTIR permitiram identificar a presença de fosfatos de cálcio amorfo e a presença de silicatos em amostras sinterizadas a 1100 ℃.
ix
Abstract
This works’ objective was to study and produce bioglass based porous structures for bone tissue engineering. Three different production methods were studied as well as different bioglass sol-gel systems such as: 45S5 Bioglass (45% SiO2; 24,5% CaO; 24,5%Na2O; 6% P2O5), 80S20CC Bioglass (80% SiO2; 20% CaO) and 80S5P15C (80% SiO2; 5% P2O5; 15% CaO) (% mol).
In the first method a study on inverted colloidal crystals (ICCs) was made. To achieve these type of structure polystyrene microspheres were produced through a microfluidic apparatus. Microspheres (~300 μm) were then introduced in a Teflon container to organize them into a hexagonal closed pack structure. Posteriorly a thermal treatment was made to promote the adhesion between spheres allowing for the production of the Colloidal crystals (CCs). Using different methods, bioglass sol-gel impregnation was achieved and thermal treatments above 900℃ were performed to promote densification. Unfortunately, it was not possible to produce an ICC structure due to the reduced mass of bioglass that was impregnated in the CCs..
For the second method, the technique of lyophilization was used. In the sol-gel production, different solids concentrations were studied at 10, 12.5 and 15%. These solutions were filled into syringes, frozen using liquid nitrogen and lyophilized. Although some structures were produced, they had a lot of pore irregularity which made them brittle and difficult to handle. A sintering process was done in an attempt to densify them but without success.
In another approach, the production of a bioglass based cement was done with the purpose of obtaining 3D printed porous structures. Within the various optimization steps of the production method, the optimization of the printing slurry and the printing parameters were the most important. After these improvements, 3D structures were printed and sintered at 1100 ℃. Scanning Electron Microscopy (SEM) images allowed the presence of a porous surface to be detected. The density and porosity of the structures were evaluated. Density values of 1,43 g/cm3 and porosity of 42% were obtained. In mechanical compression studies the maximum value reached was 6.5 MPa for the compressive strength and Young's modulus was calculated with values in the order of 80 MPa. XRD and FTIR studies allowed to identify the presence of amorphous calcium phosphates and the presence of silicates in sintered samples at 1100 ℃.
xi
Table of contents
Acknowledgements ... v
Resumo ... vii
Abstract ... ix
1 Objective ... 1
2 Introduction ... 3
2.1 Bioglass ... 3
2.2 Fabrication of 3D scaffolds ... 4
2.2.1 Inverse colloidal crystals ... 4
2.2.2 Freeze Drying of BGs ... 5
2.2.3 3D printing ... 5
2.3 Studies on Bioglass scaffolds ... 6
3 Materials and Methods ... 9
3.1 Sol-gel synthesis of Bioglasses ... 9
3.2 Microspheres and Colloidal Crystals production ... 9
3.3 Colloidal crystals impregnation with Bioglass ... 9
3.4 Freeze-drying of BG ... 10
3.5 3D printing of Bioglass cement ... 10
3.6 Characterization ... 10
3.6.1 Optical microscopy ... 10
3.6.2 Scanning Electron Microscopy (SEM) ... 10
3.6.3 Fourier-transform infrared spectroscopy (FTIR) ... 11
3.6.4 Mechanical ... 11
3.6.5 Cytotoxicity and cell viability ... 11
3.6.6 DSC-TG ... 11
3.6.7 X-Ray Diffraction ... 11
3.6.8 Densification study ... 11
3.7 Flowchart of 3D structures production ... 11
4 Results and Discussion ... 13
xii
4.1.1 Microspheres diameter and roundness ... 13
4.1.2 Optical Microscopy of CCs ... 14
4.2 Density studies of 45S5 Bioglass ... 14
4.3 Impregnation of CCs with bioglass ... 15
4.4 Freeze-drying of bioglass sol-gel ... 17
4.5 3D printing of bioglass cement ... 18
4.5.1 Optimization process ... 18
4.5.1.1 Slurry ... 18
4.5.1.2 Printing parameters ... 20
4.5.2 Optical microscopy and Scanning Electron Microscopy (SEM) ... 20
4.5.3 DSC-TG ... 21
4.5.4 X-Ray Diffraction ... 22
4.5.5 FTIR ... 23
4.5.6 Mechanical characterization ... 24
4.5.6.1 Compressive strength and elastic modulus ... 24
4.5.6.2 Porosity study (Archimedes method) ... 24
4.5.7 Cytotoxicity ... 26
5 Conclusion and Future perspectives ... 29
6 Bibliography ... 31
Appendix I ... 35
Appendix II ... 37
Appendix III ... 39
Appendix IV ... 41
xiii
List of Figures
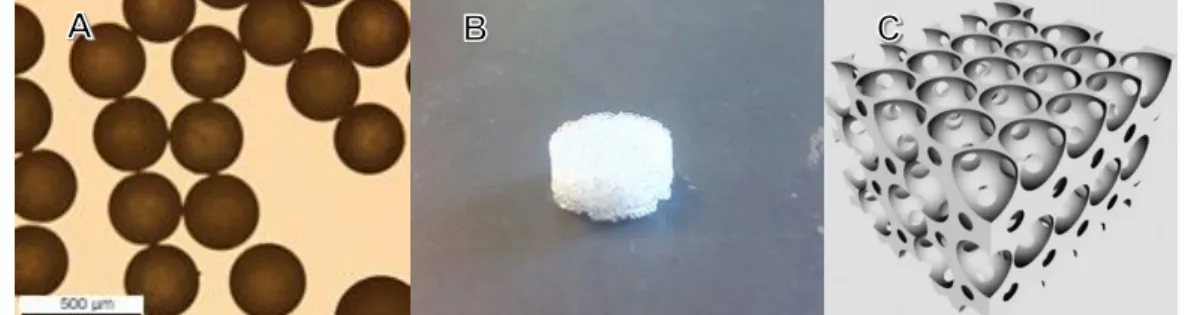
Figure 2.1 – The three main steps to produce an inverse colloidal crystal. A – Polystyrene
microspheres. B – Colloidal crystal. C – Representation of the wanted ICC [4]. ... 4
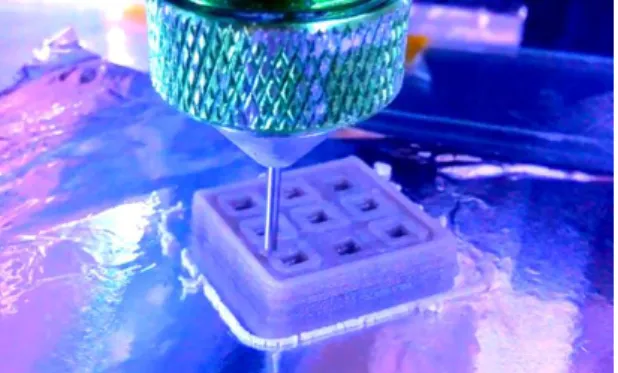
Figure 2.2 – Picture of a structure being printed in the current work. ... 5
Figure 3.1 – Schematic representation of the microspheres production method and an illustration of the CC template. Adapted from Choi et al. [25]. ... 9
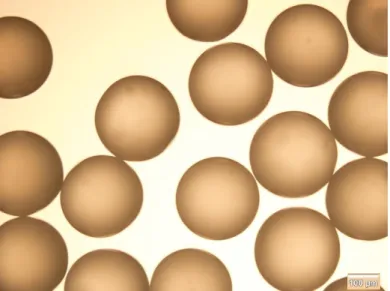
Figure 4.1 – Optical microscope image of polystyrene microspheres obtained with the selected production parameters. ... 13
Figure 4.2 – Optical microscopy images of one CC structure and some defects. ... 14
Figure 4.3 – Graph of the density studies on 45S5 Bioglass pellets sintered at 900, 1000 and 1100 ℃. ... 15
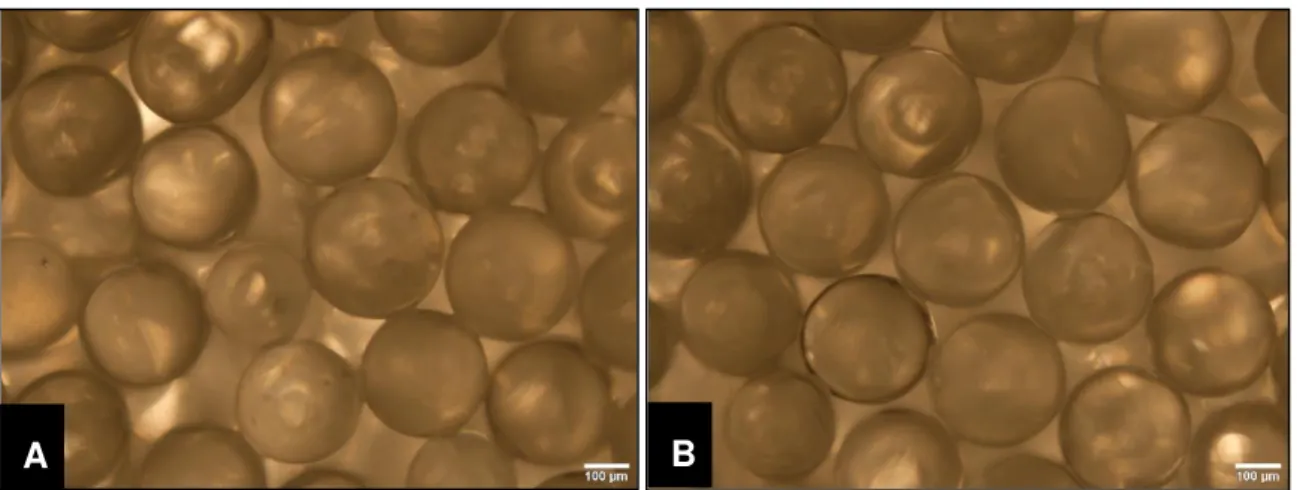
Figure 4.4 – Impregnated CCs through centrifugation of Bioglass sol-gel before (A) and after (B) sintering at 1000 ºC. ... 16
Figure 4.5 – Before (C) and after (D) sintering of the freeze dried samples. ... 17
Figure 4.6 – Simulation of a 3D printer extruder to study the behaviour of the different slurries (E). Resulting structures from the simulation tests (F). ... 18
Figure 4.7 – Optical microscope image of the wall of a sintered 3D printed structure. ... 20
Figure 4.8 – SEM image of the side view (G) of sintered structures. ... 20
Figure 4.9 – SEM images of the top surface of structures sintered at 1100 ℃. ... 21
Figure 4.10 – DSC-TG graphic analysis of the mesoporous 80S5P15C bioglass powder after 600 ℃ treatment for 2 hours. ... 21
Figure 4.11 – DSC-TG graphic analysis of the mesoporous 80S5P15C bioglass cement after 24h drying process at 60 ºC. ... 22
Figure 4.12 – Diffractogram of the final cement composition 1100 ℃. ... 22
Figure 4.13 – FTIR spectrum of the mesoporous 80S5P15C bioglass (600 ℃). ... 23
Figure 4.14 – FTIR spectrum of the bioglass cement treated at 1100 ℃. ... 23
Figure 4.15 – Compression curve of a bioglass cement sample after 1100 ºC sintering process. ... 24
Figure 4.16 – Top view of an example structure used in the porosity evaluation with measures and calculations of the real volume. ... 25
Figure 4.17 – Studies on the porosity and compressive strength of bioactive glass scaffolds. Adapted from [18]. ... 26
xiv
Figure 4.19 – Extract with pH indicator (Phenol red) after neutralization attempt. Yellow colour indicating an acid solution. ... 27
xv
List of Tables
Table 2.1 – Principal advantages and disadvantages of some 3D porous structures production methods.. ... 6
Table 2.2 – Brief description of some studies made in the area of 3D porous structures based on bioglass, contemplating in vitro and in vivo resultsl. ... 7
Table 4.1 – Results on the study of microspheres diameters. ... 13
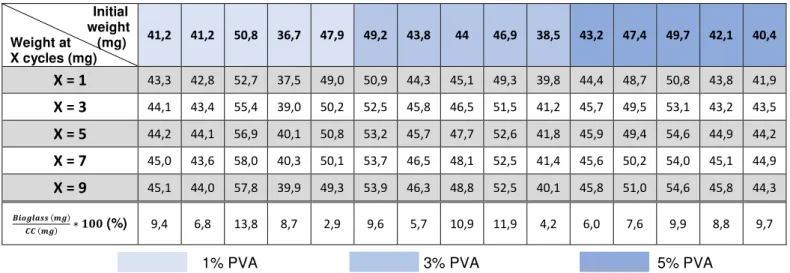
Table 4.2 –Measurements on the impregnated bioglass into CCs by applying centrifugation force. ... 15
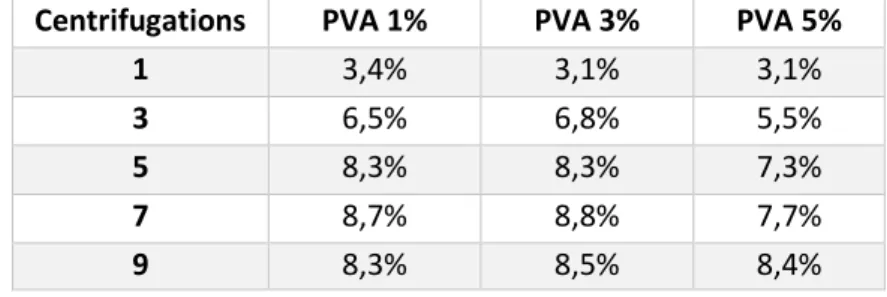
Table 4.3 – Average % of mass increment in centrifugations with Bioglass containing 1, 3 and 5% PVA. ... 16
Table 4.4 – Useful printing time study on the slurries combinations. ... 19
xvii
List of Symbols and Abbreviations
Abbreviation Designation
CC Colloidal crystal
ICC Inverted Colloidal crystal
Hcp Hexagonal closed pack
ISISA Ice-segregation-induced self-assembly
SLS Selective laser sintering
BG Bioglass
PVA Polyvinyl Alcohol
SEM Scanning Electron Microscopy
FTIR Fourier Transform Infrared Spectroscopy
XDR X-ray diffraction
DSC Differential Scanning Calorimetry
TG Thermogravimetry
1
1 Objective
3
2 Introduction
2.1 Bioglass
Bone tissue engineering has gathered a lot of attention amongst the scientific community in the past several decades. In the late 1960s, a breakthrough discovery led to very relevant results respecting to bone tissue regeneration in vivo. It was in that time that Larry L. Hench “gave
birth” to the 45S5 Bioglass, and published his first paper on the subject in 1971.
45S5 Bioglass is a bioactive material which has in its composition a 45% of SiO2, 24.5% CaO, 24.5% Na2O and a 6% P2O5, making a 5:1 ratio of Ca/P, all in wt%. SiO2 provides a slow degradation rate of the present ions and gives the glass the amorphous structure, and thus, stability. The Ca/P ratio pretends to establish a balance between the material and the ratio present in Hydroxyapatite found in bones. Na+ ions are easily dissolved, and help with the interactions between the material/medium interface, by equalizing the sodium content and pH conditions [1]. This composition allows a great osteoconductivity and osteoinductivity, making this material a class A, in terms of bioactivity. After production and further treatment, when in contact with physiological medium, the release of Ca2+, PO43- and Na+ ions forms an apatite layer which will then promote the bonding with living tissue [2], [3].
For a bone substitution intervention to be successful, the substitute material has to follow some minimum requirements, especially regarding it’s similarity with the bone’s physical structure, cortical or cancellous, and chemical composition, to allow connection between tissue and material. Aiming to the physical structure of a substitute material, the rule to follow is “the stronger the better”, as these substitutes may need to support temporarily all the stress that a normal bone would have to experience. But, like bone itself, the structure must also be very porous to allow osteoblasts to migrate, proliferate and replicate, which might compromise the mechanical properties required. The size of the connections between porous must be greater than 50 μm since osteoblasts have an average diameter of 20 – 30 μm. As to chemical composition, biocompatibility and biodegradability are a must, and to achieve this goal the material should be made out of similar phases that are found in bone. Biocompatibility/bioactivity prevents the fibrotic reaction and further rejection of the substitute and promotes the bone reconstitution process, as for the biodegradability, it allows the natural removal of the structure while being replaced with bone tissue [4].
4
2.2 Fabrication of 3D scaffolds
To produce a scaffold that meets all the required characteristics to become a substituent material for bone tissue engineering, a variety of methods can be found in literature. A great number of studies made in this field of expertise involve techniques such as porogen leaching, phase separation, gas foaming, emulsion freeze drying, electrospinning, 3D printing, extrusion, selective laser sintering, solid free-form fabrication, and rapid prototyping, all with their strengths and weaknesses [4]. In this work the following three approaches were used: inverted colloidal crystal scaffolds, freeze drying and 3D printing.
2.2.1
Inverse colloidal crystals
These structures can have a minimum porosity of 74% and a 100% pore interconnectivity. They are produced by replication of a 3D construct made by packing of monodisperse spheres as template, the colloidal crystal (CC). The connection of the spheres can be made by thermal treatment or by using a “glue material” usually a polymer. Once the CC is made, the material of interest can be inserted between spheres and left to dry, after drying the spheres are removed by a degrading agent, or by spheres leaching with thermal treatment, leaving as a remain a porous structure, known as Inverted Colloidal Crystal (ICC). The fabrication of a reliable ICC lies on a good size monodispersivity of the microspheres used and in the good settling and hexagonal-closed-pack (hcp) organization of the same spheres to provide the ideal 100% interconnectivity between pores. Any defects in spheres or organization can lead to a decrease in interconnectivity and mechanical resistance as these flaws will propagate through the structure leading to disordered parcels.
The characteristics of ICCs such as pore size and pore connection width can be tuned. Pore size is mainly affected by spheres size. The width of interconnections between pores can be modified by changing the temperature or time of thermal treatment. In the case where a “glue material” is used changing the concentration of that solution will affect the width, since the viscosity plays an important role [4], [7], [8], [9].
5
2.2.2
Freeze Drying of BGs
Complex structures that have sophisticated patterns are many times based on processes that occur in nature. In most of these processes water is the only solvent readily available. Given this, nature itself has perfect and optimized the processing of functional materials using water. The design and use of aqueous processes capable of maintaining an already existent structure and introducing further levels of spatial organization to the same would be a great step towards the preparation of highly complex and hierarchically organized structures [10].
The formation of crystalline ice (hexagonal ice) is the source of the self-assembly and organization of structures made by this technique. The orientation of the aqueous solution makes every existent solute to be forced out of the ice crystals becoming trapped in between them [10]. Then, with the assist of high-vacuum sublimation of ice, all that’s left behind are the solutes organized in a macro porous network. In the last decade, the ice-segregation-induced self-assembly (ISISA) process has gathered considerable attention due to its development in macropore orientation in scaffolding. The combination of this process with unidirectional freezing using liquid nitrogen, makes it possible to control the growth direction of ice crystals, as well as the template [11].
2.2.3
3D printing
The 3D printing technique provides great advantage in terms of shape control. The base material used is a filament or a paste and, as a form of rapid prototyping, it provides an easy and quick way to obtain 3D structures in a layer-by-layer deposition using a computer-aided design. A well-defined structure can be easily achieved after the optimization processes of the extruded material and printing parameters.
The quality of 3D printing will always depend on the equipment used, but it has been proven that prints of anatomical structures with great detail could be produced, when compared to the original specimens [12]. The 3D printing has proportioned many new paths for the rapid production of objects in a great variety of fields. Particularly in the anatomical field, it has allowed for a more detailed production of structures and according to Y. AbouHashem et al. “It appears
to be particularly easy to implement in producing bone models” [13]. It’s very likely that in the next coming years the number of applications of this technique will rise as the equipment cost starts to drop [14].
6
Table 2.1 – Principal advantages and disadvantages of some 3D porous structures production methods. D - [8], E - [15], F - Current work, G - [16], H - [17].
Method Advantages Disadvantages Examples
Inverted Colloidal Crystals (ICCs)
Excellent organization;
Interconnectivity;
Uniformity;
Cheap.
Mechanical strength;
Hard to impregnate with wanted material;
Very difficult to process at large scale.
Freeze drying (ISISA assisted)
Sub micrometric porosity;
Good organization.
Specific equipment required;
Slow process;
Mechanical strength.
Solid freeform fabrication (3D printing)
Quick, easy and cheap;
Design freedom;
Easy to scale.
Pore size limitations;
Requires extensive optimization;
Gas foaming
Solvent-free.
Random pores;
Interconnectivity;
May need further processing.
Selective Laser Sintering (SLS)
Precision;
Offers support to make hang structures in a sample (bridges).
Only works in some powders;
Specific equipment required.
2.3 Studies on Bioglass scaffolds
Bioglass scaffolds have been studied for decades, and some compositions of bioglass have been available in the market for more than 20 years. Comprehensive study regarding the production and mechanical properties of porous bioactive glass scaffolds can be found in the review of Q. Fu et al. [18]
Examples of in vitro and in vivo studies involving scaffolds of various bioglass based
7
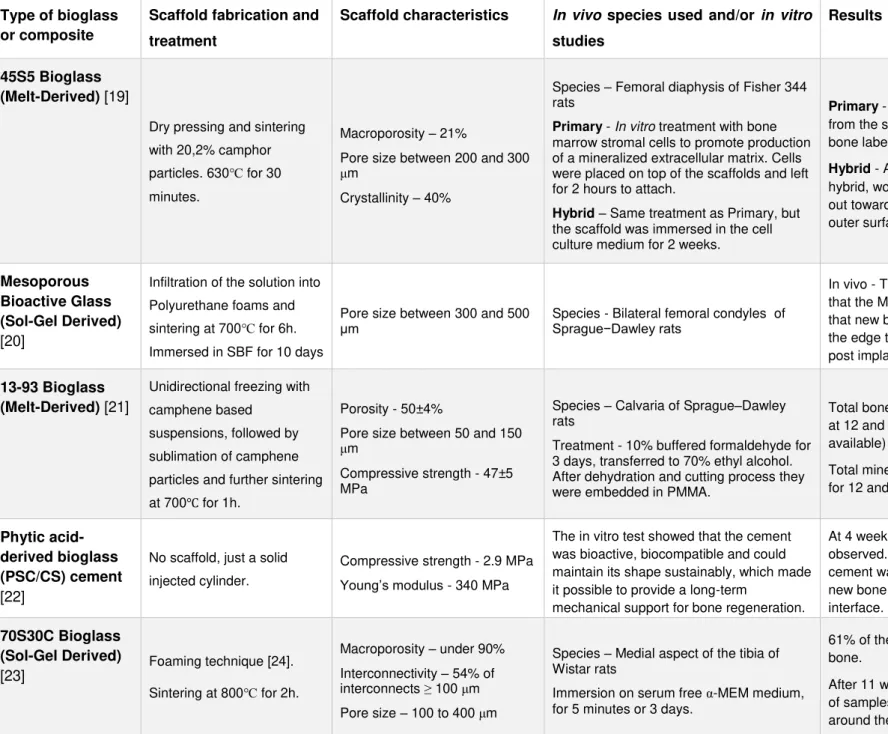
Table 2.2 – Brief description of some studies made in the area of 3D porous structures based on bioglass, contemplating in vitro and in vivo results.
Type of bioglass or composite
Scaffold fabrication and
treatment
Scaffold characteristics In vivo species used and/or in vitro
studies
Results
45S5 Bioglass (Melt-Derived) [19]
Dry pressing and sintering with 20,2% camphor particles. 630℃ for 30 minutes.
Macroporosity – 21%
Pore size between 200 and 300 μm
Crystallinity – 40%
Species – Femoral diaphysis of Fisher 344 rats
Primary - In vitro treatment with bone marrow stromal cells to promote production of a mineralized extracellular matrix. Cells were placed on top of the scaffolds and left for 2 hours to attach.
Hybrid – Same treatment as Primary, but
the scaffold was immersed in the cell culture medium for 2 weeks.
Primary - direct evidence of bone formation
from the scaffold could not be detected by bone labelling.
Hybrid - At 2 weeks implantation, for the hybrid, woven bone grew from the scaffold out towards the cortical edge and within the outer surface macropores and microcracks.
Mesoporous Bioactive Glass (Sol-Gel Derived) [20]
Infiltration of the solution into Polyurethane foams and sintering at 700℃ for 6h. Immersed in SBF for 10 days
Pore size between 300 and 500
μm Species - Bilateral femoral condyles of Sprague−Dawley rats
In vivo - The histological analysis showed that the MBG scaffolds were adsorbed and that new bone invaded the scaffolds, from the edge to the centre, from weeks 4 to 12 post implantation.
13-93 Bioglass (Melt-Derived) [21]
Unidirectional freezing with camphene based
suspensions, followed by sublimation of camphene particles and further sintering at 700℃ for 1h.
Porosity - 50±4%
Pore size between 50 and 150 μm
Compressive strength - 47±5 MPa
Species – Calvaria of Sprague–Dawley rats
Treatment - 10% buffered formaldehyde for 3 days, transferred to 70% ethyl alcohol. After dehydration and cutting process they were embedded in PMMA.
Total bone regeneration - 37±8% and 55±5% at 12 and 24 weeks, respectively. (% of area available)
Total mineralized area – 58±5% and 68±5% for 12 and 24 weeks, respectively.
Phytic acid-derived bioglass (PSC/CS) cement [22]
No scaffold, just a solid injected cylinder.
Compressive strength - 2.9 MPa Young’s modulus - 340 MPa
The in vitro test showed that the cement was bioactive, biocompatible and could maintain its shape sustainably, which made it possible to provide a long-term
mechanical support for bone regeneration.
At 4 weeks no significant change was observed. At the 8th week, resorption of the cement was noticeable. At the 12th week, new bone was formed at the cement-bone interface.
70S30C Bioglass (Sol-Gel Derived)
[23] Foaming technique [24]. Sintering at 800℃ for 2h.
Macroporosity – under 90% Interconnectivity – 54% of interconnects ≥ 100 μm Pore size – 100 to 400 μm
Species – Medial aspect of the tibia of Wistar rats
Immersion on serum free α-MEM medium, for 5 minutes or 3 days.
61% of the material made contact with new bone.
9
3 Materials and Methods
3.1 Sol-gel synthesis of Bioglasses
In this work, 3 main Bioglasses were produced with the following compositions:
45S5 Bioglass: 45% SiO2, 24,5% CaO, 24,5% Na2O, 6% P2O5 (Wt%) 80S20C Bioglass: 80% SiO2, 20% CaO (mol%)
80S5P15C Bioglass: 80% SiO2, 5% P2O5, 15% CaO (mol%)
The precursors used were:
Silicon - Tetraethyl orthosilicate (Si(OC2H5)4); Phosphorous - Triethyl Phosphate ((PO(C2H5)3);
Calcium - Calcium Nitrate tetrahydrate (Ca(NO3)2·4H2O); Sodium - Sodium Nitrate (NaNO3).
For details in the production methods view Appendix I.
3.2 Microspheres and Colloidal Crystals production
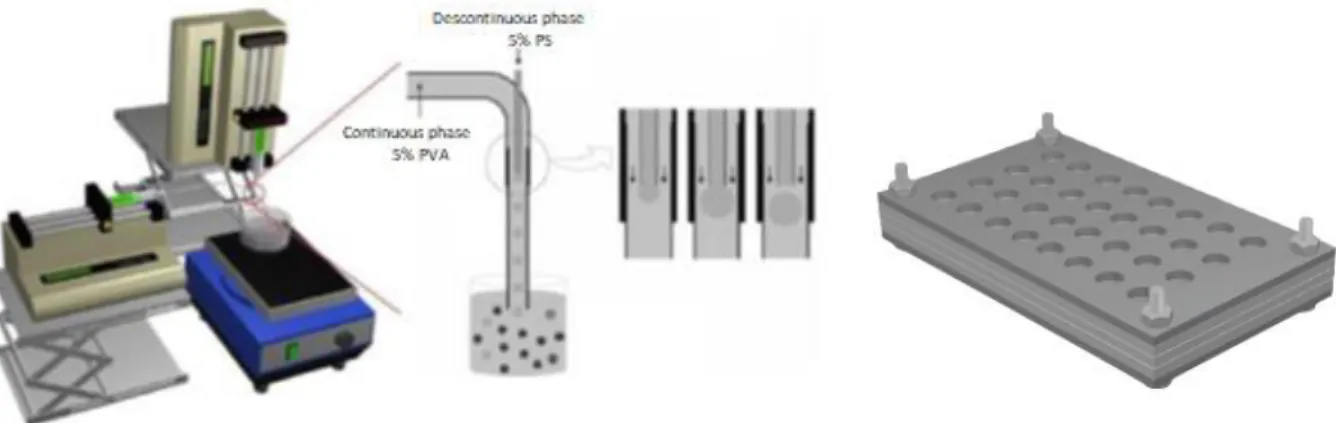
A schematic representation of the production method is presented in the figure 3.1. This method was based on the work of Choi et al. [25], and detailed information of the procedure is
presented in the Appendix II.
Figure 3.1 – Schematic representation of the microspheres production method and an illustration of the CC template. Adapted from Choi et al. [25].
3.3 Colloidal crystals impregnation with Bioglass
10
or dissolve the polystyrene template. The detailed aspects on the procedures are presented in Appendix III.
3.4 Freeze-drying of BG
To obtain porous structures through freeze-drying, several attempts were performed with different types of BGs and different solid content (%) in the sol-gel solution. The tested BGs were: i) 45S5 Bioglass; ii) 45S5 Bioglass but with half Sodium percentage; III) Sodium free 45S5 Bioglass; iv) the 80S20C Bioglass and v) the 80S5P15C Bioglass. All of these were tested for solid content percentages of 10, 12,5 and 15%. After the production of bioglass and further dilutions, they were introduced in a syringe and left to freeze in a – 10 ºC freezer. After several hours the syringes were merged in liquid nitrogen for 10 minutes and posteriorly introduced in the freeze dryer (VaCo 2, Zirbus) for 2 to 3 days. Some samples were then sintered to evaluate densification.
3.5 3D printing of Bioglass cement
This method was performed using only the 80S5P15C Bioglass, made with and without Pluronic F-127. A study and optimization of the slurry composition was made and several components were tested: Glycerine, Tween 20, Oleic Acid, PVA and a buffer solution made with Alginic Acid Sodium Salt, Ammonium di-Hydrogen Phosphate and Ammonium Phosphate dibasic. The objective here was to create a slurry capable of maintaining stability for at least 30 minutes in order to be printed. Final composition: 35% bioglass powder, 16% Tween 20 and 49% buffer solution with 2.5% Alginate. After mixing, the slurry was introduced in a syringe and smoothly centrifuged to take out all the air bubbles, inserted in the 3D printer support and printed at room temperature and ambient conditions. Information on the reagents and equipment in Appendix IV.
3.6 Characterization
3.6.1
Optical microscopy
Through optical microscopy several samples of microspheres were measured and their shape was evaluated. All measurements were performed with ImageJ software on, at least, 100 samples at a time.
Colloidal crystals were also examined with respect to structure and to assess their viability.
3D printed structures were also examined for porosity and surface roughness.
3.6.2
Scanning Electron Microscopy (SEM)
11
3.6.3
Fourier-transform infrared spectroscopy (FTIR)
FTIR spectrums were obtained with a Spectrum Two FT-IR Spectrometer from PerkinElmer.
3.6.4
Mechanical
Compressive strength characterization was only performed in samples produced by 3D printing in the final format. Uniaxial mechanical force was applied by a Universal Electromechanical Test Frame (Shimadzu) with a 50 kN load cell until fracture occurred, at a speed of 0,5 mm/min. Samples mean area was 260 mm2.
3.6.5
Cytotoxicity and cell viability
As an attempt to determine the material’s cytotoxicity and cell viability the extract and resazurin methods were used. All the steps and details of the method are described in the Appendix V.
3.6.6
DSC-TG
Thermal gravimetry and differential scanning calorimetry analysis were performed in different types of bioglass in order to evaluate the better parameters for the sintering steps. Materials were heated at a 10 ºC/min rate until 1200 ºC.
3.6.7
X-Ray Diffraction
Wide angle X-ray diffraction was performed to identify the crystalline phases of the final samples made of 80S5P15C Biolgass cement after sintering. The measurement equipment, a X‟-pert PRO (PANAlytical) X-ray diffractometer, using CuKα radiation generated at 45 kV and 40 mA, scanned the sample in the range 0º≤2Ɵ≤90º. Peaks were compared and identified through Match! Software.
3.6.8
Densification study
In another characterization of the 80S5P15C Bioglass cement a densification test was made using the same heating parameters as the sintering process to evaluate if, and at what temperature, densification occurs. Porosity was evaluated by the Archimedes method on cylindrical tablets sintered at 900, 1000 and 1100 ℃.
3.7 Flowchart of 3D structures production
12
45S5 Bioglasssol-gel
+ 1% PVA
+ 3% PVA
+ 5% PVA CCs Impregnation
50% Na
Na free
CC impregnation Ageing for 1 day at 70 ºC in
isolated syringes Regular Manual Vacuum Centrifugation Positive pressure During Bioglass production
Sintering (1000 ºC) or immersion in dichloromethane
Sintering (1000 ºC) Freeze-drying for >72h 80S20C Bioglass sol-gel Addition of Pluronic F-127
Sintering (1000 ºC)
Slurry production and 3D printing 10% solid content
12,5% solid content
15% solid content
Positive pressure impregnation of CCs
(>24h) Freeze-dry (>72h)
80S5P15C Bioglass sol-gel
Sintering at 600 ℃ and
milling
13
4 Results and Discussion
4.1 Microspheres and CCs
4.1.1
Microspheres diameter and roundness
Considering previous works that used the same method to produce polystyrene microspheres, information was gathered with respect to flow values of the continuous and discontinuous phases. As the capillary tube used in the most recent production had a higher diameter than the previous one, new test values were considered for both flows and needle diameters. With the objective of obtaining spheres between 250 and 400 μm, the following table shows the results of the different experiments. For these tests, a 0,7 mm diameter needle was used for the continuous phase and a 0,5 mm for the discontinuous phase.
Table 4.1 – Results on the study of microspheres diameters.
Continuous phase flow
(PVA 5%) in mL/h 10 10 10 9 9 20
Discontinuous phase flow
(PS 5%) in mL/h 4 5 6 5 6 3
Mean diameter in μm 296±41 261±34 234±27 300±9 300±18 262±38
The shown results only represent the experiments in which good roundness of the beads was obtained. After analysing the results, all of the production of microspheres was made with 9 mL/h continuous phase and 5 mL/h discontinuous phase.
Microspheres’ morphology was observed and evaluated through optical microscopy to ensure good organization in the CCs production.
14
Sieving of the spheres with 4 different mesh sizes (212, 250, 280 and 300 μm) was performed and once again they were observed and measured to assure the sieving objective was obtained.
As observed in the figure 4.1, good sphericity was achieved. The measurements analysis after the sieving process showed that the several meshes were in good state.
4.1.2
Optical Microscopy of CCs
CCs organization and structure was observed through optical microscopy to evaluate their viability. Figure 4.2 shows some images of good organization and also some defects.
Figure 4.2 – Optical microscopy images of one CC structure and some defects.
After the annealing process, some defects were encountered when analysing the CC’s microphotographs. As spheres have a relatively large gap of sizes even after sieving (>50 μm in the 300 to 355 μm interval) and not every one of them are perfect spheres, defects as lack of interconnections or irregular links were expected, as shown in image A. In B, a good organization was visible in this portion of the CC but still, some defects are evident. All produced CCs presented these types of defects, as the microspheres production process still lacks some improvement, as well as the accomodation of the spheres in a hexagonal close pack to form the CC’s template.
4.2 Density studies of 45S5 Bioglass
A brief study on the densification of the 45S5 bioglass revealed that the peak density of the material is achieved at near 1000 ºC. Moreover, it was observed that at 1050 ℃ the material started to melt.
15
Figure 4.3 – Graph of the density studies on 45S5 Bioglass pellets sintered at 900, 1000 and 1100 ℃.
4.3 Impregnation of CCs with bioglass
A key factor to accomplish a good impregnation is the low viscosity of the sol-gel solution. After the bioglass production, a PVA solution was mixed with bioglass with two purposes: a) lower the viscosity and b) help maintain the bioglass slurry stability during the polystyrene CC dissolution.
During this work it was observed that bioglass produced by sol-gel method suffers a great loss of mass and volume after the impregnation of CCs. Given this, many of the impregnation methods used didn’t make great progress in the production of ICCs.
The best attempt in which the most quantity of bioglass made its way into the CC structure was the centrifugation method. The maximum value was reached at 5 centrifugations with a mean value of 4,5 mg of CC’s weight increment. Further centrifugation cycles showed no significant progress in the mass addition into the CCs. All the CCs used had the same interval of spheres size, 280 to 300 μm, and their weight was measured prior centrifugations.
Table 4.2 –Measurements on the impregnated bioglass into CCs by applying centrifugation force.
Initial weight Weight at (mg) X cycles (mg)
41,2 41,2 50,8 36,7 47,9 49,2 43,8 44 46,9 38,5 43,2 47,4 49,7 42,1 40,4
X = 1
43,3 42,8 52,7 37,5 49,0 50,9 44,3 45,1 49,3 39,8 44,4 48,7 50,8 43,8 41,9X = 3
44,1 43,4 55,4 39,0 50,2 52,5 45,8 46,5 51,5 41,2 45,7 49,5 53,1 43,2 43,5X = 5
44,2 44,1 56,9 40,1 50,8 53,2 45,7 47,7 52,6 41,8 45,9 49,4 54,6 44,9 44,2X = 7
45,0 43,6 58,0 40,3 50,1 53,7 46,5 48,1 52,5 41,4 45,6 50,2 54,0 45,1 44,9X = 9
45,1 44,0 57,8 39,9 49,3 53,9 46,3 48,8 52,5 40,1 45,8 51,0 54,6 45,8 44,3𝑩𝒊𝒐𝒈𝒍𝒂𝒔𝒔 (𝒎𝒈)
𝑪𝑪 (𝒎𝒈) ∗ 𝟏𝟎𝟎 (%) 9,4 6,8 13,8 8,7 2,9 9,6 5,7 10,9 11,9 4,2 6,0 7,6 9,9 8,8 9,7
1% PVA 3% PVA 5% PVA
It is important to refer that some CCs ended up losing some of the constituent spheres during the force application and excess bioglass removal with a smooth brush. This led to a small but considerable error in the measurement of bioglass mass increment. The variation on the PVA
1,50 1,60 1,70 1,80 1,90 2,00 2,10
850 900 950 1000 1050 1100 1150
Re lat iv e De n si ty (g/cm 3)
16
content of the bioglass didn’t seem to affect the impregnation process in terms of quantity of material introduced. But with 5% PVA the increment of mass seemed to be slower to achieve the final quantity.
Table 4.3 – Average % of mass increment in centrifugations with Bioglass containing 1, 3 and 5% PVA.
Centrifugations
PVA 1%
PVA 3%
PVA 5%
1
3,4%
3,1%
3,1%
3
6,5%
6,8%
5,5%
5
8,3%
8,3%
7,3%
7
8,7%
8,8%
7,7%
9
8,3%
8,5%
8,4%
It was noticeable that after 5 centrifugations the mass increment lowered considerably and that further cycles didn’t result in further progress. The maximum bioglass weight that was able to be impregnated by this method was estimated in 9% of the CCs mass. Sintering process was then performed at 1000 ºC and in Figure 4.3 the final result is shown.
Figure 4.4 – Impregnated CCs through centrifugation of Bioglass sol-gel before (A) and after (B) sintering at 1000 ºC.
A
17
It was noticeable that bioglass was present inside the CCs, but as the polystyrene starts to melt (90 ~ 240 ºC) the bioglass particles started to fall apart due to lack of support.
4.4 Freeze-drying of bioglass sol-gel
In the literature, some studies report the use of the freeze-drying method in bioglass sol-gel systems to obtain a crystalline porous structure. The crystallinity results from the fact that the ISISA process is used in these samples to slowly freeze them unidirectionally and so the ice crystals have an organized assembly. In the current work it wasn’t possible for the use of this method, so by only freeze drying the bioglass sol-gel, it was expected that a porous structure would form but with no crystallinity or any particular organization. A combination of freeze drying the bioglass impregnated into CCs was also tested but with very poor results. In the other attempts with many variants of bioglass composition, some structures were produced with relative success. As unidirectional freezing wasn’t applied, these structures were much disorganized and large pores were present making the handling of the samples very difficult without collapse. As these fragile structures didn’t exhibit any mechanical resistance a sintering process was performed to promote densification of the material.
Figure 4.5 – Before (C) and after (D) sintering of the freeze dried samples.
Even though a porous structure was fabricated through freeze-drying, the loss of mass and volume suffered by the bioglass didn’t allow for structure to be maintained. The melting point of
C
18
these bioglasses occured at temperatures above 1050 ºC as observed in previous sintering processes.
Given this, and considering the results shown in Figure 4.5, it was hypothesized that a support structure would be needed to maintain the integrity of the porous bioglass during the sintering and densification process. As the support needed couldn’t be fabricated, freeze dry method was discontinued as well as CC impregnation.
4.5 3D printing of bioglass cement
4.5.1
Optimization process
4.5.1.1 Slurry
In the optimization process of the slurry, several factors had to be taken into account: powder particles size, powder dissolution, viscosity of the paste, diameter of the nozzle, ease of extrusion of each combination, homogeneity, time of solidification and stiffness of the dried structure.
As the 3D equipment wasn’t always available, experiments for optimizing the slurry were carried on with a simulation of the extruder. Inserting the slurry in a syringe and using a Kd scientific injector to act as an extruder, the “useful printing time” (time window in which a slurry can be extruded before it hardens) was obtained with a needle of 0,7 mm diameter.
Figure 4.6 – Simulation of a 3D printer extruder to study the behaviour of the different slurries (E). Resulting structures from the simulation tests (F).
The main mixture incorporated the bioglass powder with the phosphate buffer solution as this combination was the key to the solidification of the cement. Several ratios between only these
19
two components were experimented but the setting time didn’t went above the 10 minutes. Other components (plastificants) were then added to provide a smother extrusion such as Glycerine, Oleic Acid, Tween 20 and PVA 5%. The use of glycerine was discontinued due to the lack of homogenization of the slurries. It was noticed that slurries containing Glycerine wouldn’t stay stable after applying pressure with the piston. The same problem occurred when using Oleic acid, the first injected slurry would easily cross the needle but at a certain point a solid residue would accumulate in the syringe and only solvent would be extruded (phase separation). PVA at 5% was discontinued as slurries containing it were incapable of being extruded by the 0,7 mm needle.
When Sodium alginate was incorporated in the phosphate buffer solution at 2,5%, the slurries exhibited an interesting characteristic that was only noticed later. Slurries containing alginate and Tween 20, if well isolated in a syringe, wouldn’t become stiffer or harder to extrude as time passed. One of the syringes was sealed and kept at room temperature for 3 weeks and then tested, and the extrusion through a 0,7 mm needle was still possible.
By the observation of the Figure 4.6 (F) it is possible to notice that when the following filament/layer comes in contact with the previous ones, their structure was not affected and still adhered to each other.
Table 4.4 presentes some results for the final optimization with the final components.
Table 4.4 – Useful printing time study on the slurries combinations. (
*
- Phosphate buffer solution with a 2,5% Alginic acid w/w)Bioglass powder (g) Glycerine (mL) Tween 20 (mL) Phosphate buffer solution (mL) Useful printing time (min)
0,5 - - 0,75 10
0,5 - 0,2 0,6 17
0,5 0,1 0,2 0,6 12
0,5 0,2 0,2 0,6 15
0,5 - 0,3 0,6 20
0,5 - 0,2 0,7 * >100
0,5 - - 0,8 * 8
0,5 - - 1 * 11
0,5 - 0,25 0,6 * >100
0,5 - 0,25 0,75 * >100
20
inside the syringe to prevent contact with the air. The final composition with quantities used to fill one syringe was: 1,5 g of bioglass powder + 0,75 mL of Tween 20 + 2,25 mL Buffer solution > ~ 3,4 mL of slurry.
In the production of this slurry, first the bioglass powder and the Tween 20 were well mixed with a spatula in a glass flask for 3 to 5 minutes until no liquid remained visible. Then, the Buffer solution was added and after 3 minutes of mixing with a spatula the white homogeneous slurry was ready to be printed.
4.5.1.2 Printing parameters
Several adjustments had to be made respecting to this procedure. In Appendix IV all of the parameters used in the final structure’s prints are shown. As the printer is not prepared to sustain smaller nozzle diameters besides the incorporated in the extruder, discrepancies in the relations between layer height and filament diameter, for example, can be encountered.
4.5.2
Optical microscopy and Scanning Electron Microscopy (SEM)
After the printing and sintering processes, various samples were observed to check if structure and porosity weren’t compromised by the evaporation of the slurry solvents. As Figure 4.7 reveals, rugosity of the samples’ surface is high and some structural flaws were visible due to the evaporation of solvents and to the defective infill of the printing pattern.
Figure 4.7 – Optical microscope image of the wall of a sintered 3D printed structure.
21
Figure 4.9 – SEM images of the top surface of structures sintered at 1100 ℃.
Through the observation of the SEM images it was possible to notice that each layer was connected to the adjacent ones (G). SEM images also revealed that the contact area of each layer was not yet maximized as flaws could be observed. Different pore sizes were present but some of the larger ones (H, blue) were related to printing flaws that still needed to be improved by changing printing speed, extrusion speed or infill percentage. In a more detailed observation (H1) the micro porosity could be evaluated and measurements gave pore sizes between 5 and 100μm.
4.5.3
DSC-TG
Differential scanning calorimetry as well as a thermogravimetric study were made on the mesoporous 80S5P15C bioglass powder and on the final cement composition to evaluate their behaviour under sintering conditions. The bioglass powder used in these studies had already been thermally treated at 600 ℃ to burn all the Pluronic F-127.
Figure 4.10 – DSC-TG graphic analysis of the mesoporous 80S5P15C bioglass powder after 600 ℃ treatment for 2 hours.
22
In Figure 4.10 it was possible to observe that mass loss was not very significant, since the major loss occurred until 200 ℃, indicating that absorbed water was probably present. No obvious glass transition or densification could be inferred from DSC-TG results.
Figure 4.11 – DSC-TG graphic analysis of the mesoporous 80S5P15C bioglass cement after 24h drying process at 60 ºC.
In Figure 4.11, the first 2 peaks represent mass losses at 119 ℃ and 194 ℃ corresponding to water and Tween 20 evaporation, respectively. The third and larger mass loss, could possibly represent the melting of Sodium Alginate used in the buffer solution. [27]
4.5.4
X-Ray Diffraction
With the help of the Match! Software crystalline phases were identified in the cement diffractogram.
Figure 4.12 – Diffractogram of the final cement composition after thermal treatment at 1100 ℃.
Limiting the search parameters in the software to phases that only contain the elements H, C, N, O, Na, Si, P, Cl and Ca, cristobalite (SiO2) was the most probable match found with a93%
0 2000 4000 6000 8000 10000 12000 14000 16000
23
match. Any other possible phases indicated by the matching software were not taken into account since it is recommended to only consider phases with more than 80% match.
4.5.5
FTIR
Two FTIR analysis were made on the mesoporous 80S5P15C bioglass after the thermal treatment at 600 ℃, and to the cement after 1100 ℃.
Figure 4.13 – FTIR spectrum of the mesoporous 80S5P15C bioglass (600 ℃).
In the spectrum represented in Figure 4.13, a small band at 600 cm-1 is related to amorphous P-O, and its presence could indicate the existence of amorphous calcium phosphates [28]. Silicate absorption bands were present near to 500, 800 and 1080 cm-1 [29]. Hidden by the Si-O-Si bands, smaller PO4 bands were probably present [30]. Between 3700 and 2750 cm-1 a large band was observed and probably corresponds to water adsorption as explained by I. Notingher et al. [28]. Mesoporosity of the bioglass particles can be responsible for water absorption.
Figure 4.14 – FTIR spectrum of the bioglass cement treated at 1100 ℃. 40 50 60 70 80 90 100 110 0 500 1000 1500 2000 2500 3000 3500 4000 Ab so rb an ce
Wavelenght (cm-1)
80S5P15C Bioglass 600
℃
40 50 60 70 80 90 100 110 0 500 1000 1500 2000 2500 3000 3500 4000 Ab so rb an ce
Wavelenght (cm-1)
24
In the FTIR spectrum of the final material sintered at 1100 ℃, the main noticeable change was the absence of the adsorbed water band detected in the bioglass FTIR. As it was observed, peaks relative to Figure 4.13 are still present in the cement FTIR spectrum.
4.5.6
Mechanical characterization
4.5.6.1 Compressive strength and elastic modulus
For mechanical properties evaluation, only 5 samples were tested due to some unexpected problems regarding the shape of the samples after thermal treatment. Even though the number was not very significant to make a statistical analysis, the results were very consistent without considerable variation between the maximum force registered before fracture (1,56 to 1,75 kN).
The average maximum force sustained before fracture was 1,7 kN, which corresponded to a stress of 6,5 MPa. As compressive strength of trabecular bone lies in the 2 to 12 MPa interval, the value for the tested material is considered good as it offers a similar behaviour. Figure 4.15 shows the typical compression curve obtained for the printed structures. In this curve, three regions can be observed: elastic, collapse and densification.
Figure 4.15 – Compression curve of a bioglass cement sample after 1100 ºC sintering process.
From the slope of the elastic region, the Young modulus was obtained with a value of 79,7 ± 14,8 MPa, which is within the trabecular bone values (50 to 500 MPa), but very near the inferior limit [31].
4.5.6.2 Porosity study (Archimedes method)
Several measurements were made to evaluate the behaviour of the cement material after thermal treatment. Using the Archimedes method to calculate the density and porosity of cylindrical pellets and printed structures, the following table resumes the obtained results.
0 1 2 3 4 5 6 7
0,2 0,25 0,3 0,35 0,4 0,45 0,5 0,55 0,6
Co
m
p
ressi
v
e
stre
n
g
th,
𝝈
(M
P
a)
Enlongation, (
𝞮
)
Elastic region
Densification
25
Table 4.5 – Study on the densification and porosity of the material.
m
dry (mg)m
immerse (mg)m
humid (mg) Open volume(mm3)
Total
volume
(mm3)
Density
(g/cm3) Microporosity
900 ºC 293 146 341 48 195 1,5 24,6%
1000 ºC 300 141 343 43 198 1,52 21,7%
1100 ºC 313 169 362 49 193 1,62 25,4%
Structure
1100 ºC 867 441 1048 181 607 1,43 29,8%
Even though a relation between the apparent porosity results with the sintering temperature couldn’t be established, the relative density showed a slight increment with the increase of temperature. It is important to state that this open porosity measuring method lacked some accuracy due to the difficulty to saturate the pore network with the fluid, in this case distilled water. In another point of view, the porosity measured in the printed structure only took into account the pores in the solid parts (walls) of the sample, despising the hollow areas (voids in Figure 4.16). Besides the fact that these voids result in an increase in the superficial area, an estimation of the real porosity was made.
Figure 4.16 – Top view of an example structure used in the porosity evaluation with measures and calculations of the real volume.
Upon analysis, and knowing the compressive strength of the produced structures, a comparison was made with a review article by Fu, Qiang et al. [18]. In the following figure a collection of studies on the compressive strength and porosity of several bioactive glass scaffolds are presented.
Total Volume = Vreal– Vvoids = 607 mm3 Vreal – 83,88 = 607 mm3
Vreal⁓ 691 mm3
Total porosity = (Vvoids / Vreal) * 100% + AP (29,8%) Total porosity ⁓ 42%
(AP - Apparent porosity)
17
,2
m
m
17,2 mm
h = 2,33 mm
26
Figure 4.17 – Studies on the porosity and compressive strength of bioactive glass scaffolds. Adapted from [18].
The produced structures in the current work are marked in yellow. As it was possible to observe, the characteristics of the resulting material are consistent with the values for trabecular bone but significantly far from the porosity of 3D structures produced in other works. The comparison between the structures made in this work with the structures represented in the Figure 4.17 is not easy, as none of them are relative to a rapid prototyping production method like 3D printing of bioglass cement. Yet, comparing with the two of the closest studies within the trabecular bone area ( for Shih-Ching Wu et al. [32] and for Qiang Fu et al. [33]) a 7⁓8% porosity difference is noticeable. Both of these articles used melt-derived bioglasses, 45S5 and 13-93 bioglasses respectively, which normally provides better mechanical properties to the final scaffolds, and use a form of replication technique and a particle leaching technique to produce the scaffolds. These techniques easily allow for a much better porosity control as the inserted sacrificial particles will leave voids in the material, and in the replication case the porosity depends on the sacrificial template. In the current work pores are a result of solvents evaporation plus the structural printed voids which count as free space also.
4.5.7
Cytotoxicity
The first cytotoxicity tests encountered some setbacks relative to samples degradation in the culture medium. Beforehand, the samples degradation behaviour was only tested in water and the final result gave a positive feedback, as no physical alterations were visible after 2 weeks. After obtaining the knowledge that culture medium would disaggregate the samples, a second degradation test was made with salty water, which after a few hours revealed some physical damage to the structure and small particle disassociation. If shaken, the solution would become
Current work
27
a suspension of the disassociated particles, even though the structure was maintained. However, after a few minutes particles would sediment. Although this fact could compromise the final results, a second cytotoxicity test was performed with care to not extract any particles.
Figure 4.18 – Degradation tests in Water (I) and a NaCl solution (J) after 2 weeks.
In the second test, another problem was detected. The material revealed to be very acid when tested with an indicator (Phenol red). The extract turned yellow indicating that the pH was much lower than 7, with an estimated value between 1 and 2 . A neutralization process of the extract was performed by the addition of Sodium Hydroxide (NaOH), but without any success, since after neutralization the extract turned acid again. The acidity could be linked to the use of HCl in the production of the mesoporous bioglass and the use of Alginic acid in the cement slurry. An attempt to overcome this problem consists in the dialysis treatment of the powder after the thermal step at 600 ºC. Another alternative would be the use of a lower molarity acid in the bioglass synthesis. This would imply a longer reaction time for the bioglass sol-gel to form as the acid is a catalyst of the reaction.
Figure 4.19 – Extract with pH indicator (Phenol red) after neutralization attempt. Yellow colour indicating an acid solution.
29
5 Conclusion and Future perspectives
In this work three distinct production methods to produce bioglass porous structures were studied.
After several attempts to produce ICCs through impregnation of bioglass sol-gel into Polystyrene CCs, none was capable of producing such a structure. Besides the lack of connection between bioglass particles after the sintering processes, Bioglass sol-gel with sodium in its composition revealed to be very brittle, even when sintered in the form of cylindrical tablets, made by applying 2 tons of compressive force. Bioglass production without sodium content revealed to be much stiffer compared to the regular 45S5 Bioglass and the half sodium content bioglass. Densification of the 45S5 Bioglass was assessed and its peak value was found between 1000 and 1050 ºC. Above 1050 ºC melting of the material was noticeable.
In the freeze-drying production method some structures were produced with partial success. As there was no unidirectional freezing equipment, the porous structures became disorganized and with pores of different sizes. Therefore, these structures didn’t offer enough mechanical resistance and had to be handled with extra caution. A sintering process was made to make an attempt to densify the material but without success.
The 3D printing technique allowed for more robust structures to be produced. After the optimization of the slurry’s composition and after some corrections to the extruding parameters, different designs were printed to evaluate the precision of the printer. It was possible to print pieces with an accuracy of 0,5 mm (the nozzle diameter) but the success ratio was too low and required further optimization, given this, the nozzle diameter used to print the characterized pieces was 0,7 mm.
Through optical microscopy it was observed that the pieces surface was very rough due to the mesoporosity of the bioglass particles and the evaporation of both Tween 20 and alginate during sintering. The SEM images showed that pores with sizes between 10 and 100 μm were achieved with this method.
30
Cytotoxicity tests were attempted with the extract and resazurin method in two equal samples. These two tests revealed two different problems: a) the degradation rate of the material in culture medium and b) the acidity of the same material. The acidity of the material could be explained by the use of HCl in the bioglass production, which then affects the pH of the culture medium. To overcome this problem a neutralization was attempted but after some time the extract turned acid once again. The degradation rate problem could also be an implication of the high acidity of the material. When in contact with higher pH solutions salts are probably produced to stabilize and neutralize the solution.
There is still a lot of room to improve and optimize these processes with emphasis in the 3D printing method. In the current work the equipment used was not ideal and several adjustments had to be made. This implies that a change in any of the resources used could result in another optimization process completely different from the applied in this work.
As future perspectives, several additional studies could be made for a better understanding of the bioglass cement mix:
- Slurry optimization for more detailed printing with smaller nozzle diameter. This optimization could lead to the possibility of producing more precise pores and to better control the open porosity of the material without only relying on the solvents evaporation;
- Evaluate the variation of the porosity of the structures with the solid : liquid ratio of the slurry;
- DRX studies of samples immersed in SBF during different periods of time to evaluate the formation of crystalline phases indicative of bioactivity;
- Evaluate particle size and study its relation with compressive strength of printed structures;
- Degradation tests in SBF during different periods of time to evaluate the durability of the material and to predict its behaviour in vivo;
- Study of the optimal thermal treatment conditions to combine the better mechanical resistance with the better biological results. Further investigation for temperatures above 1100 ℃;
31
6 Bibliography
[1] L. L. Hench, R. J. Splinter, W. C. Allen, and T. K. Greenlee, “Bonding mechanisms at the interface of ceramic prosthetic materials” J. Biomed. Mater. Res., vol. 5, no. 6, pp. 117–
141, 1971.
[2] J. Faure et al., “A new sol-gel synthesis of 45S5 bioactive glass using an organic acid as
catalyst” Mater. Sci. Eng. C, vol. 47, pp. 407–412, 2015.
[3] L. L. Hench, “The story of Bioglass®” J. Mater. Sci. Mater. Med., vol. 17, no. 11, pp. 967–
978, 2006.
[4] C. F. C. João, J. M. Vasconcelos, J. C. Silva, and J. P. Borges, “An Overview of Inverted Colloidal Crystal Systems for Tissue Engineering” Tissue Eng. Part B Rev., vol. 20, no. 5,
pp. 437–454, 2014.
[5] J. R. Jones, “Reprint of: Review of bioactive glass: From Hench to hybrids” Acta Biomater.,
vol. 23, no. S, pp. S53–S82, 2015.
[6] M. N. Rahaman et al., “Bioactive glass in tissue engineering” Acta Biomater., vol. 7, no. 6,
pp. 2355–2373, 2011.
[7] H. Shirahama et al., “Fabrication of Inverted Colloidal Crystal Poly(ethylene glycol)
Scaffold: A Three-dimensional Cell Culture Platform for Liver Tissue Engineering” J Vis
Exp, no. 114, pp. 1–12, 2016.
[8] D. Hutmacher, T. Woodfield, P. Dalton, and J. Lewis, “Chapter 14 - Scaffold design and fabrication A2 - Blitterswijk, Clemens van” pp. 403–454, 2008.
[9] J. H. Gilmore, “NIH Public Access” North, vol. 29, no. 10, pp. 1883–1889, 2008.
[10] M. C. Gutiérrez, M. L. Ferrer, and F. Del Monte, “Ice-templated materials: Sophisticated structures exhibiting enhanced functionalities obtained after unidirectional freezing and ice-segregation- induced self-assembly” Chem. Mater., vol. 20, no. 3, pp. 634–648, 2008.
[11] X. Zhang, C. Li, and Y. Luo, “Aligned/unaligned conducting polymer cryogels with three-dimensional macroporous architectures from ice-segregation-induced self-assembly of PEDOT-PSS” Langmuir, vol. 27, no. 5, pp. 1915–1923, 2011.
[12] J. Li, L. Nie, Z. Li, L. Lin, L. Tang, and J. Ouyang, “Maximizing modern distribution of complex anatomical spatial information: 3D reconstruction and rapid prototype production of anatomical corrosion casts of human specimens” Anat. Sci. Educ., vol. 5, no. 6, pp.
330–339, 2012.
[13] Y. AbouHashem, M. Dayal, S. Savanah, and G. ??trkalj, “The application of 3D printing in anatomy education” Med. Educ. Online, vol. 20, no. 1, pp. 1–4, 2015.
32
Neuroanat., vol. 10, no. June, pp. 1–7, 2016.
[15] Y. Minaberry and M. Jobbágy, “Macroporous bioglass scaffolds prepared by coupling sol-gel with freeze drying” Chem. Mater., vol. 23, no. 9, pp. 2327–2332, 2011.
[16] R. Surace, L. A. C. De Filippis, E. Niini, A. D. Ludovico, and J. Orkas, “Morphological investigation of foamed aluminum parts produced by melt gas injection” Adv. Mater. Sci.
Eng., vol. 2009, no. March, 2009.
[17] J. M. Williams et al., “Bone tissue engineering using polycaprolactone scaffolds fabricated
via selective laser sintering” Biomaterials, vol. 26, no. 23, pp. 4817–4827, 2005.
[18] Q. Fu, E. Saiz, M. N. Rahaman, and A. P. Tomsia, “Bioactive glass scaffolds for bone tissue engineering : state of the art and future perspectives” vol. 31, pp. 1245–1256, 2011.
[19] T. Livingston, P. Ducheyne, and J. Garino, “In vivo evaluation of a bioactive scaffold for bone” pp. 1–13, 2001.
[20] B. Sui, G. Zhong, and J. Sun, “Evolution of a Mesoporous Bioactive Glass Sca ff old Implanted in Rat Femur Evaluated by 45 Ca Labeling, Tracing, and Histological Analysis” 2014.
[21] X. Liu, M. N. Rahaman, and Q. Fu, “Acta Biomaterialia Bone regeneration in strong porous bioactive glass ( 13-93 ) scaffolds with an oriented microstructure implanted in rat calvarial defects” Acta Biomater., vol. 9, no. 1, pp. 4889–4898, 2013.
[22] T. Zhu et al., “Novel bioactive glass based injectable bone cement with improved
osteoinductivity and its in vivo evaluation” Sci. Rep., vol. 7, no. 1, pp. 1–10, 2017.
[23] S. Midha, T. Bo, W. Van Den Bergh, P. D. Lee, J. R. Jones, and C. A. Mitchell, “Acta Biomaterialia Preconditioned 70S30C bioactive glass foams promote osteogenesis in vivo” Acta Biomater., vol. 9, no. 11, pp. 9169–9182, 2013.
[24] J. R. Jones, L. M. Ehrenfried, and L. L. Hench, “Optimising bioactive glass scaffolds for bone tissue engineering” vol. 27, pp. 964–973, 2006.
[25] S. W. Choi, I. W. Cheong, J. H. Kim, and Y. Xia, “Preparation of uniform microspheres using a simple fluidic device and their crystallization into close-packed lattices” Small, vol.
5, no. 4, pp. 454–459, 2009.
[26] Y. Luo, C. Wu, A. Lode, and M. Gelinsky, “Hierarchical mesoporous bioactive glass/alginate composite scaffolds fabricated by three-dimensional plotting for bone tissue engineering” Biofabrication, vol. 5, no. 1, 2013.
[27] J. P. Soares, J. E. Santos, G. O. Chierice, and E. T. G. Cavalheiro, “Thermal behavior of alginic acid and its sodium salt” Ecl Quim, vol. 29, no. 2, p. 53, 2004.
[28] I. Notingher et al., “Application of FTIR and Raman Spectroscopy to Characterisation of
Bioactive Materials and Living Cells” Spectrosc. Int. J., vol. 17, no. 2–3, pp. 275–288,