P
R
O
O
F
O
N
L
Y
12
Evaporation from Porous Building Materials and Its
31
Cooling Potential
2
4
Teresa Diaz Gonçalves, Ph.D.
1; Vânia Brito
2; Filipa Vidigal
3; Luís Matias, Ph.D.
4; and Paulina Faria, Ph.D.
553 Abstract:Evaporativecooling is a traditional strategy to improve summer comfort, which has gained renewed relevance in the context of the 6 transition to a greener economy. Here, the potential for evaporative cooling of two common porous building materials, natural stone and 7 ceramic brick, was evaluated. The work has relevance also to the protection of built heritage becauseevaporation underlies the problems of 8 dampness and salt crystallization, which are so harmful and frequent in this heritage. It was observed that the drying rate of the materials is, in 9 some cases, higher than the evaporation rate of a free water surface. Surface area measurements by a three-dimensional optical technique 10 suggested, as probable cause of this behavior, that surface irregularity gives rise to a large effective surface of evaporation in the material. 11 Surface temperature measurements by infrared were performed afterward during evaporation experiments outside during a hot summer day in 12 Lisbon. Their results indicate that ordinary building materials can be very efficient evaporative media and, thus, may help in achieving higher 13 energy efficiency while maintaining a simultaneous constructive or architectural function.DOI:10.1061/(ASCE)MT.1943-5533.0001174. 14 © 2014 American Society of Civil Engineers.
15 Author keywords:Porous media; Surface roughness; Fractals; Evaporation; Cooling.
16 Introduction
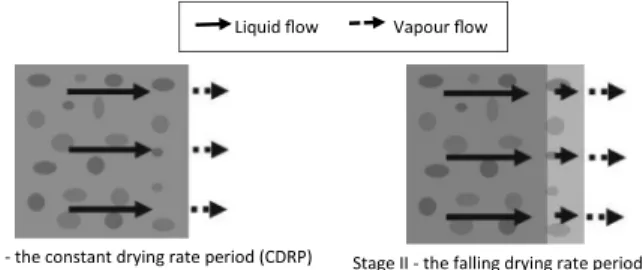
17 Water is a constant presence in the intricate pore network of tradi-18 tional building materials, such as mortar, stone, or ceramics. It may 19 have very harmful effects because it functions as a catalyst for 20 deterioration mechanisms, such as sulphate attack, biodeteriora-21 tion, or salt decay. But it can also have positive effects, for example, 22 when it enables the evaporative cooling of environments. 23 The evaporative drying of porous materials involves liquid 24 transport toward an evaporation front and vapor transport from that 25 front outward (Sherwood 1929;Scherer 1990). Two main regimes 26 are in general considered, which for a material drying from satu-27 ration, correspond to the following main stages (Fig.1): in Stage I, 28 also called the constant drying rate period (CDRP), there is liquid 29 continuity across the material, and the wet front is located at their 30 surface; the drying rate is constant because drying proceeds under 31 steady-state conditions. Stage II, also called the falling drying rate 32 period (FDRP), starts when the moisture content in the material, 33 and therefore the liquid flow, decreases to a point where it is no 34 longer able to compensate the evaporative demand, and the wet 35 front begins receding toward the interior of the material.
36 During the CDRP, the drying rate is at its highest value. This
37 value is often assumed to be equal to that of a free water surface,
38 which would be explained by the presence of a liquid film covering
39 the whole surface of the material. However, this idea has been
con-40 tradicted by researchers, such as Hammecker (1993), Jeannette
41 (1997), Tournier et al. (2000), Rousset-Tournier (2001), and Diaz
42 Gonçalves et al. (2012). These researchers observed that the
evapo-43 ration rate from porous stones and other building materials during
44 the CDRP was not necessarily equal to the evaporation from a free
45 water surface and, in fact, could even be higher than that. A similar
46 phenomenon was observed by Tang and Etzion (2004) who noticed
47 that, with a low wind velocity, the rate of evaporation from a pond
48 was greater when it was covered with wet tissue.
49 The possible enhancement of the CDRP drying rate of a porous
50 material in comparison to a flat water surface has a wide range of
51 implications. Indeed, evaporation is often used as a boundary
con-52 dition in numerical models for moisture transport in porous media,
53 and the most current reference for the CDRP is the evaporation rate
54 of a flat water surface. The study of evaporative processes is also
55 extremely important from more practical perspectives, such as the
56 protection of the architectural heritage. The evaporation rate
deter-57 mines, for example, the height of capillary rise (I’Anson and
58 Hoff 1984), a chronic problem in historical buildings (Massari
59 and Massari 1993). Also, salt decay, one very harmful degradation
60 mechanism that affects this type of building (Charola 2000),
hap-61 pens precisely during evaporative processes by which the solutions
62 increase their concentration until they saturate and eventually
crys-63 tallize. The study of evaporative drying is therefore fundamental to
64 understand and ultimately develop solutions for these degradation
65 processes. Finally, such study is also relevant from the point of
66 view of sustainability because it is the base of evaporative cooling,
67 one of the oldest strategies for improving summer comfort in hot,
68 dry environments. The wetting of ceramic floors, traditional in
69 Mediterranean countries, such as Portugal, can be mentioned as
70 an example. Evaporative cooling methods rely on the fact that
71 the passage of water from liquid to vapor state involves energy
con-72 sumption (Matias et al. 2007). These cooling methods have recently
73 gained a new importance and are more and more often incorporated
1
National Laboratory for Civil Engineering (LNEC), Materials Dept., Av. do Brasil 101, 1700-066 Lisbon, Portugal (corresponding author). E-mail: [email protected]
2
National Laboratory for Civil Engineering (LNEC), Materials Dept., Av. do Brasil 101, 1700-066 Lisbon, Portugal. E-mail: [email protected]
3
Dept. of Civil Engineering, LNEC and Nova Univ. of Lisbon, Caparica Campus, 2829-516 Caparica, Portugal. E-mail: [email protected]
4
National Laboratory for Civil Engineering (LNEC), Buildings Dept., Av. do Brasil 101, 1700-066 Lisbon, Portugal. E-mail: [email protected]
5
Nova Univ. of Lisbon, Dept. of Civil Engineering, Caparica Campus, 2829-516 Caparica, Portugal. E-mail: [email protected]
P
R
O
O
F
O
N
L
Y
74 in modern architectural solutions because they can help meet 75 energy-efficiency needs.
76 In this study, the drying rate of porous building materials during 77 the CDRP is experimentally analyzed. The objective was to inves-78 tigate the possible enhancement of the CDRP drying rate in com-79 parison to a flat water surface. To support the interpretation of 80 the results, surface area measurements by a three-dimensional 81 (3D) optical technique were carried out. Afterward, the evaporative 82 cooling potential of some of the materials was assessed through the 83 measurement of surface temperature with an infrared thermometer
84 Materials and Methods
85 Materials
86 The materials used for determination of the CDRP drying rate are 87 rigid building materials that encompass six natural stones, a red
88 ceramic brick, an air lime/sand mortar, and three calcium silicate
89 materials (Table1). They were chosen on an exploratory basis for
90 being representative of those used in civil engineering and found in
91 the built heritage and also because they cover a wide range of
capil-92 lary porosity. This porosity, which corresponds to the natural
capac-93 ity of the material to absorb water at atmospheric pressure, is also
94 given in Table1. The pore-size distribution of 10 of the materials is
95 presented in Fig.2. An Autoscan60 porosimeter from
Quantach-96 rome was used, with a pressure range between 0 and 320 MPa.
97 The measurements were performed according to ASTM D4404-10
98 standard (ASTM 2010) and were always replicated. The pore-size
99 distribution of the remaining material, Maastricht limestone, can be
100 found elsewhere (De Clercq et al. 2007). Incoherent materials like
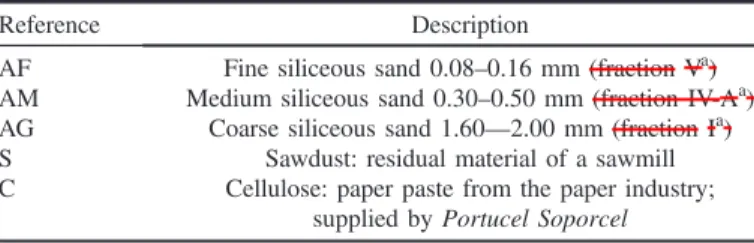
101 sand, sawdust, and cellulose, were used as reference in the
evapo-102 rative cooling tests (Table2).
103 Measurement of CDRP Drying Rate
104 The CDRP drying rate was measured by means of drying tests
105 (RILEM 1980). These tests followed a method similar to that
de-106 scribed in Diaz Gonçalves et al. (2012) except that, here, the
experi-107 ments lasted just long enough to measure the CDRP drying rate.
108 They were carried out in a conditioned room at 20°C and 50%
rel-109 ative humidity (RH). To eliminate the influence of air velocity, the
110 tests were carried out inside a box. This box is made of acrylic
111 glass, has internal dimensions of500mm×500mm×500mm and
112 possesses a 70-mm-diameter circular opening at the top to allow for
113 removing the specimens with minimal perturbation of the internal
114 conditions. The RH inside the box was controlled by means of salts
115 solutions, a desiccant, or simply by leaving it open (Table3).
F1:1 Fig. 1.A schematic representation of the two main drying stages of a F1:2 porous material
Table 1.Rigid
4 Materials Used for Determination of CDRP Drying Rate
T1:1 Reference Description
Capillary porositya(%V)
T1:2 Average Standard deviation
T1:3 CS.LS Calcium silicate boardPROMATECT—LS(Promat) 81.9 0.5
T1:4 CS.L500 Calcium silicate boardPROMATECT—L500 (Promat) 81.3 0.7
T1:5 M Maastricht limestone 42.7 1.2
T1:6 MB Malta’s Globigerina limestone—Badjda type 26.6 0.3
T1:7 CS.B Calcium silicate brick VB15 (Silka) 25.6 0.4
T1:8 L Lecce calcarenite 24.4 0.1
T1:9 CA Ançª limestone 22.8 0.7
T1:10 A Lime mortar (1:3 by volume of air lime and sand) 20.8 0.4
T1:11 T Solid red ceramic brick (Cerâmica Vale de Gândara, Portugal) 19.6 0.2
T1:12 CB Current Portuguese limestone of intermediate porosity 13.5 0.9
T1:13 CC Current Portuguese limestone of low porosity 9.1 0.1
a
The capillary porosity was measured after complete immersion in water for 48 h, following RILEM procedure II.1 (RILEM 1980). Three specimens of each kind were used.
0 500 1000 1500 2000 2500 3000 3500
0.001 0.01 0.1 1 10
x 10
-3
(cm
3/g)
Pore radius (µm)
0 50 100 150 200 250 300 350
0.001 0.01 0.1 1 10
x 10
-3
(cm
3/g)
Pore radius (µm)
(a) (b)
P
R
O
O
F
O
N
L
Y
116 The specimens were small cubes with a 24-mm edge. The mor-117 tar cubes were made using metallic molds. The other specimens 118 were sawed from larger stone blocks, ceramic bricks, calcium 119 silicate brick, or insulation boards. All the cubes were brushed 120 to remove as much stone or brick powder as possible from their 121 surfaces. Then, they were cleaned in an ultrasonic cleaner (model 122 B1200 E-1, Branson Ultrasonics Corporation, United States). 123 Finally, they were laterally sealed with epoxy.
124 For every condition, the materials and free water surfaces were 125 tested simultaneously. The specimens were first saturated by partial 126 immersion in pure water during three days. Afterward, their bottom 127 surface was sealed with polyethylene film (PE). They were then left 128 to dry and were periodically weighted during 8 h.
129 Three test specimens of each kind of material were used at every 130 condition, except for four of the previously tested materials (B, 1315 MB, CA, and T). In these cases, it was considered reasonable to
132 use only two specimens, as the preceding results were very
homo-133 geneous (Diaz Gonçalves et al. 2012). For the free water surfaces,
134 three full petri dishes were always used.
135 The environmental conditions inside the drying box were
con-136 tinuously monitored by means of a Mikromec Multisens sensor
137 positioned in its center (Table3). The measurements started before
138 the specimens and petri dishes were placed inside the box and
pro-139 ceeded until after they were removed from it. As seen in Fig.3, both
140 the initial RH and the final RH are similar to the nominal RH. This
141 shows that when the wet materials and petri dishes are not inside the
142 box, the actual RH (eventually) assumed the values expected in
143 each case. The localized perturbations of the RH inside the box
144 were due to the periodic opening of the box and removal of the
145 specimens to weight them. The actual RH considered for this work
146 was the average of the RH measured during the CDRP in each test:
147 25%, 44%, 66%, and 79%, respectively (Table3).
148 The result of a drying test is a graph depicting the mass of the
149 specimens as function of time (Fig.4). The drying rate of the
speci-150 men, in g=h, is the slope of the mass–time function. This value is
151 then divided by the area of the top surface of the specimen to obtain
152 the amount of water evaporated per unit area, in g=ðm2
· hÞ.
153 Measurement of Surface Area by Optical Method
154 The surface texture of 10 materials (those in Table1, except the
155 Maastricht limestone) was studied using the 3D optical measuring
156 instrument Talysurf CLI 1000, by Taylor Hobson. The instrument
157 was equipped with a (noncontact) white light CLA gauge with a
158 vertical range of 3 mm, vertical resolution of 100 nm, lateral
res-159 olution of 5μm and measuring slope of 13° (Taylor Hobson 2009).
160 The measurements were carried out in 3D with the highest
161 possible resolution, which corresponds to a spacing of 5μm in both
162 the X and Y directions. A velocity of2mm=s was chosen because
163 it is the highest possible at the selected resolution.
164 Arealparameter Sdr (ISO 2012) was calculated after the mea- 6
165 surements using the Talymap Goldsoftware. Sdr is the developed 7
166 interfacial area ratio and expresses the percentage of additional
167 surface area contributed by the texture, as compared to the
pro-168 jected area. Using the resampling operator of the Talymap software,
169 Sdr could be calculated for different measurement scales: 5 μm
170 (the original measurement step), 10μm, 20μm, 50μm, 100μm,
171 and 200μm. From the Sdr value, the relative area (RA) could be
Table 2.Incoherent Materials Used as Reference in Evaporative Cooling
Tests
T2:1 Reference Description
T2:2 AF Fine siliceous sand 0.08–0.16 mm (fraction Va) T2:3 AM Medium siliceous sand 0.30–0.50 mm (fraction IV-Aa) T2:4 AG Coarse siliceous sand 1.60—2.00 mm (fraction Ia) T2:5 S Sawdust: residual material of a sawmill T2:6 C Cellulose: paper paste from the paper industry;
supplied byPortucel Soporcel
aAccording to EN 196-1 (CEN 2005).
Table 3.Environmental Conditions during Drying Experiments
T3:1 RH control
RH (%) at 20°C
T3:2 Nominal RH Actual RHava
T3:3 CaCl2 (powder) 0.0
b
25.23.1 T3:4 LiCl (saturated solution) 12.4c 44.45.3 T3:5 No salt (box left open) 50.0 (as in the lab room) 66.32.0 T3:6 NaCl (saturated solution) 75.5c 79.23.5
aAverage value of the actual RH in the box during the CDRP. bData from CEN (2001).
cData from ASTM (2007).
P
R
O
O
F
O
N
L
Y
172 determined. RA is a dimensionless quantity that expresses the ratio 173 between the projected surface area A of a material and its developed 174 surface area [Eq. (1)]
RA¼Adeveloped
Aprojected
¼Sdr
100þ1 ð1Þ
175
176 Evaporative Cooling Experiments in Real Outdoor 177 Conditions
178 The evaporation experiments were undertaken in real outdoor 179 conditions during a hot summer day in Lisbon. One test was carried 180 out under direct sunlight and another in the shade. There were no 181 nearby buildings or heat sources in the location chosen for the test 1828 (at LNEC campus). Surface temperature was measured with an 183 infrared thermometer Raytek (model MX4PG).
184 The tests were carried out on five rigid materials, namely 185 calcium silicate CS.L500, Maastricht M and CB limestones, lime 186 mortar A, and red ceramic brick T (Table 1). Distilled water and 187 several incoherent materials (three grades of siliceous sand, saw-188 dust, and cellulose) were also tested to serve as reference (Table2). 189 Cubic specimens of the rigid materials were used with 50-mm 190 edge. For the calcium silicate it was necessary to use samples with a 191 lower height, 35 mm, owing to the dimensions of the original 192 board. The four lateral sides of these specimens were sealed with 193 epoxy. The incoherent materials and water were placed in acrylic 194 boxes with internal dimensions of 50mm×50mm×50 mm.
195 The base of these boxes was perforated to allow capillary absorption,
196 and a filter paper was put on the inside base to avoid material loss.
197 The materials were wetted by capillary absorption through the
198 base by means of partial immersion in water for 48 h in a
condi-199 tioned room (20°C and 50% RH). After this period, the samples
200 were removed from immersion and its lower face immediately
201 sealed with polyethylene film to ensure that drying would be
uni-202 directional, taking place only through the upper surface.
203 The cubes and containers were fit in openings cut in a XPS
204 board with dimensions of800mm×800mm×50mm, as shown
205 in Fig.5. Two specimens of each material were used, one wet and
206 one dry, as well as two containers (AD1 and AD2) filled with
dis-207 tilled water. The dry materials, which served as a reference for
sub-208 sequent interpretation of results, were previously dried in an oven
209 during 24 h at 60°C, followed by 24 h in the conditioned room at
210 20°C and 50% RH. After fitting all the materials and containers for
211 water in the XPS board, the assembly was wrapped in PE film to
212 prevent evaporation [Fig.5(a)]. The water was placed in a closed
213 container. The experimental device and the container with water
214 were then transported and left in the selected place (in the sun)
215 at 12 p.m. They remained in these conditions for 1 h to stabilize
216 their temperature, after which the film was cut and the two acrylic
217 containers filled with water.
218 The surface temperature measurements [Fig.5(b)] began
imme-219 diately and were repeated every 15 min for 1.5 h. The temperature
220 was measured in the center of the top surface of the specimens, with
221 the equipment positioned perpendicularly and at a distance of
222 350 mm from this surface. The environmental conditions
(temper-223 ature and RH) were evaluated with a digital thermohygrometer.
224 Assessment of the Emissivity
225 The infrared (IR) thermometer measures the amount of energy
226 (radiance E, in W=m2) emitted by an object. Then, based on an
227 emissivity value entered by the operator, it calculates the surface
228 temperature of that object through Eq. (2) which is based on
229 Stephan Boltzmann law (Matias 2012)
E¼εσT4 ð2Þ
230 231 In this equation, ε (dimensionless) = the emissivity of the
232 material, which represents the relation between the radiance of the
233 body under examination and that of a black body (body that
234 absorbs all radiation);σ= the Stefan-Boltzmann constant, which
235 takes an absolute value of5.67×10−8W=ðm2K4Þ; and T = the
236 temperature (K).
F4:1 Fig. 4.Mass-time drying curves of two specimens of the MB stone, F4:2 and environmental conditions (temperature and RH) during the test
P
R
O
O
F
O
N
L
Y
237 For most of the tested materials and also for the water, emissiv-238 ity values can be found in the literature. These are, however, quite 239 variable from author to author and sometimes given as a range 240 rather than as individual values. Further, they always concern 241 materials in the dry state (Table4).
242 Therefore, it was decided to measure experimentally the emis-243 sivity of the present materials and distilled water. This was carried 244 out following the method recommended by the manufacturer of the 245 IR thermometer. The specimens were first left in a conditioned 246 room at 20°C and 50% RH for several days, so that they were 247 in thermal equilibrium. Then, successive measurements of their 248 surface temperature were performed with the IR thermometer, 249 changing the emissivity until a surface temperature identical to 250 that expected under thermal equilibrium conditions, i.e., 20°C 251 (293.15 K) was achieved.
252 The wet materials and the water-filled container were involved 253 in polyethylene film, as shown in Fig.5(b), to prevent evaporation 254 because this would lower their surface temperature.
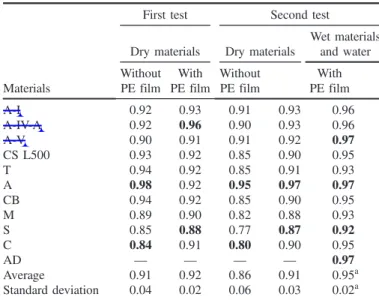
255 Two sets of measurements were carried out; the results are 256 shown in Table5 and Fig.6. As seen, average emissivity values 257 between 0.86 and 0.95 were obtained, with a tendency for having 258 higher values associated with the use of the PE film [Fig.6(a)], 259 and even higher values with the presence of water in the material 260 [Fig.6(b)]. The dispersion of results within each test was not very 261 expressive, as seen by the standard deviation values presented 262 in Table 5, which represent a maximum of 7% in relation to the 263 average values.
264 However, the repeatability of this method for determining 265 the emissivity was not good, as shown by Fig. 6(c). For this 266 reason, it was decided to adopt a single emissivity value for all 267 the materials (which in fact is the usual procedure). A value of 268 0.92 was chosen because it is close to the obtained experimental
269 values and also to those found in the literature for this type of
270 materials.
271 Results and Discussion
272 CDRP Drying Rate and Surface Area
273 Fig.7 depicts the variation of the CDRP drying rate (DR) of the
274 materials and water surfaces as a function of the RHav, which is an
Table 4.
9 Some Emissivity Values Found in Literature
T4:1 Materials
CONTEMP (2013) OMEGA (2013) FLIR (2009) RAYTEK (2004) Janssens (2003)
T4:2 ε(−) T(°C) ε(−) T(°C) ε(−) T(°C) ε(−) T(°C) ε(−) T(°C)
T4:3 Calcium silicate — — — — — — 0.88 40–700 — —
T4:4 Limestone 0.30–0.40 — — — 0.98 25 — — 0.30–0.40 —
T4:5 Ceramic brick 0.93 20 0.81–0.86 17 0.90 25 — — 0.93 20
T4:6 Mortar 0.87 17 0.87 17 — — — — 0.87 17
T4:7 Sand 0.90 20 0.90 20 0.90 25 — — 0.90 20
T4:8 Wood 0.96 19 0.80–0.90a 20 0.94 25 — — 0.96 19
T4:9 White paper 0.93b 20 0.70-0.90 20 0.95 25 — — 0.93b 20
T4:10 Distilled water 0.96 20 0.96 20 0.93c 25 — — 0.96 20
aWooden plates. bAgglutinated. cWater.
F6:1 Fig. 6.Comparison of the measured emissivity values: (a) between materials with or without PE film; (b) between dry and wet materials; (c) among F6:2 two identical tests on the same materials
Table 5.ExperimentalMeasurement of Emissivity 1011
T5:1 Materials
First test Second test
T5:2 Dry materials Dry materials
Wet materials and water
T5:3 Without
PE film With PE film
Without PE film
With PE film
T5:4
A-I 0.92 0.93 0.91 0.93 0.96
T5:5
A-IV-A 0.92 0.96 0.90 0.93 0.96
T5:6
A-V 0.90 0.91 0.91 0.92 0.97
T5:7
CS L500 0.93 0.92 0.85 0.90 0.95
T5:8
T 0.94 0.92 0.85 0.91 0.93
T5:9
A 0.98 0.92 0.95 0.97 0.97
T5:10
CB 0.94 0.92 0.85 0.90 0.95
T5:11
M 0.89 0.90 0.82 0.88 0.93
T5:12
S 0.85 0.88 0.77 0.87 0.92
T5:13
C 0.84 0.91 0.80 0.90 0.95
T5:14
AD — — — — 0.97
T5:15
Average 0.91 0.92 0.86 0.91 0.95a
T5:16 Standard deviation 0.04 0.02 0.06 0.03 0.02a
a
P
R
O
O
F
O
N
L
Y
275 average of the actual RH values measured during the CDRP. As 276 seen, the dispersion of the experimental values is generally very 277 low. The tendency to have slightly negative values of DR for RH¼ 278 100%in some cases suggests that the RHavis a slight underestimate
279 of the equivalent RH.
280 Despite these variation factors, there is an approximately linear 281 relationship between the two quantities. This linearity means 282 that Fick’s law [Eq. (3)] is obeyed, which corresponds to an essen-283 tially diffusive process (Fig.8). It also means that the thickness of 284 the stagnant air layer δ adjacent to the material does not vary 285 with the RH, which happens because the drying tests were per-286 formed within a closed box and, thus, air velocity was always close 287 to zero
J¼−Π
dp dx¼−
p0
100Π
dRH
dx ð3Þ
288 whereJ(ML−2T−1) = the mass flow of water vapor, i.e., the drying
289 rate of the porous material;π(T) = the vapor permeability of the
290 layer that water vapor has to cross;dp=dx(MT−2L−2) = the
uni-291 directional vapor pressure gradient across that layer; andp0= the
292 saturated vapor pressure.
293 Another relevant observation from Fig.7is that the CDRP
dry-294 ing rate of the materials is not necessarily equal to the evaporation
295 rate from the free water surface tested under the same
environmen-296 tal conditions. It can be significantly lower, as it happens for
ex-297 ample with the CC limestone in the majority of the conditions, but it y = -0.0017x + 0.1586
R² = 0.9317
0.00 0.05 0.10 0.15 0.20
0 25 50 75 100
DR (k g/ m 2.h ) RHav (%) (a)
y = -0.0016x + 0.1551 R² = 0.9743
0.00 0.05 0.10 0.15 0.20
0 25 50 75 100
DR (k g/ m 2.h ) RHav (%) (b)
y = -0.0018x + 0.171 R² = 0.9691
0.00 0.05 0.10 0.15 0.20
0 25 50 75 100
DR (k g/ m 2.h ) RHav (%) (c)
y = -0.0009x + 0.0988 R² = 0.8902
0.00 0.05 0.10 0.15 0.20
0 25 50 75 100
DR (k g/ m 2.h ) RHav (%) (d)
y = -0.002x + 0.1986 R² = 0.9828
0.00 0.05 0.10 0.15 0.20
0 25 50 75 100
DR (k g/ m 2.h ) RHav (%) (e)
y = -0.0018x + 0.1782 R² = 0.9954
0.00 0.05 0.10 0.15 0.20
0 25 50 75 100
DR (k g/ m 2.h ) RHav (%) (f)
y = -0.0019x + 0.1874 R² = 0.9929
0.00 0.05 0.10 0.15 0.20
0 25 50 75 100
DR (k g/ m 2.h ) RHav (%) (g)
y = -0.0017x + 0.1616 R² = 0.9625
0.00 0.05 0.10 0.15 0.20
0 25 50 75 100
DR (k g/ m 2.h ) RHav (%) (h)
y = -0.0007x + 0.0814 R² = 0.8137
0.00 0.05 0.10 0.15 0.20
0 25 50 75 100
DR (k g/ m 2.h ) RHav (%) (i)
y = -0.0011x + 0.1268 R² = 0.9928
0.00 0.05 0.10 0.15 0.20
0 25 50 75 100
DR (k g/ m 2.h ) RHav (%) (j)
y = -0.0017x + 0.1568 R² = 0.9975
0.00 0.05 0.10 0.15 0.20
0 25 50 75 100
DR (k g/ m 2.h ) RHav (%) (k) 0.00 0.05 0.10 0.15 0.20
0 25 50 75 100
DR (k g/ m 2.h ) RHav (%) Linear (water) (l)
F7:112 Fig. 7.Dryingrate (DR) from materials during the CDRP and from free water surfaces as a function of the actual relative humidity (RHav); the error
P
R
O
O
F
O
N
L
Y
298 can also be higher, as seen in Fig.7(i). A CDPR drying rate higher 299 than the evaporation rate from a free water surface had already been 300 observed for different types of materials by several authors 301 (Hammecker 1993;Jeannette 1997;Tournier et al. 2000; Rousset-302 Tournier 2001;Tang and Etzion 2004;Diaz Gonçalves et al. 2012). 303 The fact that in some cases the CDRP drying rate is lower than 304 for a free water surface confirms that there is not a liquid film cover-305 ing the total surface of the materials during the CDRP. If such a film 306 existed, assuming that the liquid possesses the same thermody-307 namic properties in the pores and in a free surface, the drying rate 308 of the material could perhaps be higher than for the free surface, 309 due to surface irregularity, but it could never be lower.
310 Tournier et al. (2000) attributed the high CDRP drying rate of 311 porous materials to their surface roughness. This broadly encom-312 passes the fact that in the pores curved menisci are formed (rather 313 than flat water surfaces), as well as the geometrical irregularity of 314 the material surface. However, the concept of (geometrical) surface 315 roughness is quite slippery when applied to porous materials: 316 straightforward extrapolation of what happens with other simpler 317 types of surfaces, such as metals or plastics, is not possible. 318 Table6depicts the values of the relative area obtained with the 319 optical instrument at different scales, i.e., for different measuring 320 steps. As seen, the RA values vary with the measurement scale. 321 This variation of RA with the measurement scale is graphically de-322 picted in Fig.9for the two materials (CS.B and CC) with the larger 323 and smaller RA, respectively. These curves show that RA increases 324 exponentially with scale. They also show that there is a vertical 325 asymptote at point zero of the X-axis.
326 These features indicate that the measured surfaces have fractal
327 properties (Mandelbrot 1967,1998). A fractal surface is an
irregu-328 lar surface with noninteger dimension between 2 (the Euclidian
329 dimension of a plane) and 3 (the Euclidian dimension of a volume).
330 Several authors have recognized and studied the fractal character of
331 the pore space of natural and artificial porous building materials,
332 such as natural stone (Katz and Thompson 1985;Bernal and Belo
333 2001), mortars (Arandigoyen et al. 2005;Arandigoyen and Alvarez
334 2006), or ceramic brick (Benavente et al. 2006). However, this
con-335 cept has not been fully assimilated by civil engineering.
336 Due to the topological complexity of the pore space, a higher
337 effective surface of evaporation is therefore a likely explanation for
338 the high CDRP drying rate depicted by some of the tested materials.
339 In Fig.10, the CDRP drying rate is shown as a function of
capil-340 lary porosity. Point (0,0) is attributed to a theoretical material with
341 0% porosity. Since it is admitted that surface irregularity derives
342 from the presence of pores, this theoretical material would be
to-343 tally flat. As can be seen in the figure, when the two calcium silicate
344 materials with higher porosity are considered, the relationship
be-345 tween the CDRP drying rate and capillary porosity cannot be
de-346 scribed by a linear function. Instead, a parabolic function may, for
347 example, be used as a first-order approximation. This means that
348 the CDRP drying rate will increase with increasing porosity but
349 only up to a certain value. Any further rise in the porosity will
re-350 sult, rather, in a decrease of the drying rate. At a certain point, the
351 situation of a free water surface is reached, which corresponds to
352 the maximum possible porosity (P¼1). This behavior is probably
353 due to the mentioned variation of the complexity of the physical
354 surface (which is null for the two extremes (P¼0 and P¼1)
355 and higher for the intermediate situations (P0,1½). However, it
356 is important to mention that a clear correlation between the CDRP
357 evaporation rate and the RA values measured with the profilometer
358 was not found. The reason could be the fact that RA varies with the
359 measurement scale and the scale of interest is not necessarily the
360 same for the different materials. Another reason could be that
me-361 nisci curvature is also relevant in terms of effective surface of
362 evaporation. These subjects clearly require further investigation.
363 Surface Temperature during Drying
364 Figs.11and12present the surface temperatures measured during
365 the evaporation experiments performed in the shadow and under
366 the sun, respectively. The first obvious observation is that the wet
367 materials depict surface temperatures well below those of the dry
368 materials due to the evaporative cooling effect.
CDRP
Jv pair
pfront
δ
x
vapour flow liquid flow Legend
F8:1 Fig. 8.Representation of CDRP as a diffusive process
F9:1 Fig. 9.Relative area (RA) of the surface of two CS.B and CC
speci-F9:2 mens as a function of the measurement scale
Table 6. Relative Area of Tested Material Surfaces at Different
Measurement Scales (Average Values)
T6:1 Material
Measurement scale (μm)
T6:2 5 10 20 50 100 200
T6:3 CS.LS 2.48 1.58 1.34 1.14 1.06 1.02
T6:4 CS.L500 1.81 1.33 1.19 1.08 1.03 1.01
T6:5 MB 1.69 1.28 1.19 1.12 1.06 1.02
T6:6 CS.B 2.88 1.77 1.51 1.31 1.19 1.10
T6:7 L 1.68 1.27 1.19 1.12 1.07 1.03
T6:8 CA 1.22 1.08 1.06 1.03 1.02 1.01
T6:9 A 2.33 1.59 1.37 1.26 1.23 1.17
T6:10 T 1.29 1.12 1.07 1.03 1.02 1.01
T6:11 CB 1.25 1.10 1.07 1.04 1.02 1.01
P
R
O
O
F
O
N
L
Y
369 In the shade (Fig.11), the wet building materials achieve lower 370 surface temperatures than the free water surface (AD) and depict no 371 significant difference in relation to, for example, cellulose (C), 372 which is a product typically used in evaporative cooling devices. 373 Under the sun (Fig.12), the situation is different. The brick (T), 374 the coarse sand (AG), the mortar (A), and the sawdust (S) provide, 375 in this case, surface temperatures of 1.2°C to 6.3°C higher than the 376 free water surface (AD). However, one of the limestones (M), the 377 calcium silicate (CS), and two sands (AM and AF), achieve surface 378 temperatures of 1.7°C to 2.8°C lower than the free water surface, 379 although about 2.0°C to 3.1°C higher than cellulose (C). 380 These results indicate, therefore, that ordinary building materi-381 als have interesting evaporative cooling potential. In the future, it 382 would be useful to investigate how much the heat capacity of the 383 materials and their coefficient of solar absorption contribute to the 384 differences among them. It would also be important in the future to
385 obtain more accurate emissivity data for the range of temperatures
386 of interest, as emissivity may also depend on temperature. Such
387 knowledge would allow developing a numerical model to support
388 the development of evaporative cooling systems.
389 Conclusions and Perspectives
390 It was experimentally observed that the drying rate during the
391 CDRP from porous building materials, such as natural stone or
392 ceramic brick, can be very high. In some cases it may even
over-393 come the evaporation rate from a free water surface subjected to
394 similar environmental conditions. This high drying rate is probably
395 due to the fractal character of the evaporating surface and to
396 menisci curvature. Both features enhance the effective surface of
397 evaporation in the material.
F10:1 Fig. 10.Variation of the CDRP evaporation rate with the capillary porosity. The free water surface is considered a material with 100% porosity; point F10:2 (0,0) is attributed to a theoretical material with 0% porosity and, thus, perfectly flat
Surface temperature (ºC)
Time (min)
Shadow
Mean surface temperature (ºC)
Shadow
P
R
O
O
F
O
N
L
Y
398 Due to their high CDRP drying rate, porous building materials 399 reveal a high potential for evaporative cooling, which is in accor-400 dance with traditional uses in hot, dry climates, such as the wet-401 ting of ceramic tiles during summer in Mediterranean countries. 402 This was confirmed experimentally, by means of evaporative 403 cooling experiments performed in the exterior, during a hot 404 summer day in Lisbon. The dry materials achieved high surface 405 temperature, especially in the sun where some materials reached 406 more than 50°C. However, during drying, their surface tempera-407 ture dropped on average as much as 10°C to 15°C. The surface 408 temperature of the wet materials achieved values similar (in the 409 sun) or even lower (in the shadow) than that of a free water 410 surface.
411 This article is expected to contribute to a better assimilation by 412 civil engineering disciplines of the idea that the surface morphol-413 ogy of ordinary porous building materials, such as brick or natural 414 stone, has a fractal multiscale character that affects the way they 415 interact with the environment. Moreover, the obtained experimental 416 results confirm that these materials may be used in efficient evapo-417 rative cooling systems for low energy-consuming buildings. They 418 may, thus, help to meet the current needs for energy efficiency 419 while maintaining a simultaneous constructive or architectural 420 function.
421 Acknowledgments
422 This work was funded by the Portuguese Foundation for Science 423 and Technology (FCT) under the research project DRYMASS 424 (ref. PTDC/ECM/100553/2008). Vânia Brito was supported by a 425 research grant provided under this project. The authors are thankful 426 to Leo Pel (TU/e) and José Delgado Rodrigues (LNEC) for their 427 useful advice on different aspects of the study, and to LNEC tech-428 nicians Luís Nunes and José Costa who helped on the experimental 429 work. Thanks also to Jo Ann Cassar (University of Malta) for the 430 Malta’s Globigerina limestone samples, to Cerâmica do Vale de 431 Gândara for the red ceramic brick, to Cristovão Soares (Tria) 432 for calcium silicate boards, to James Diamond (Ytong) for calcium 433 silicate bricks, to José Cruz (Lusical) for the hydrated air lime 434 powder used on the lime mortar, to Patricia Castellano Rodrigues 435 (Portucel Soporcel) for the supply of the paper paste, and to Pedro 43613 Teixeira for putingthe contacts.
437 References
438 Arandigoyen, M., and Alvarez, J. I. (2006).“Blended pastes of cement and
439 lime: Pore structure and capillary porosity.”Appl. Surf. Sci., 252(20),
440
7562–7571. 14
441 Arandigoyen, M., Pérez Bernal, J. L., Bello L´opez, M. A., and Alvarez, J. I.
442 (2005).“Lime-pastes with different kneading water: Pore structure and
443 capillary porosity.”Appl. Surf. Sci., 252(5), 1449–1459. 15
444 ASTM. (2007).“Standard practice for maintaining constant relative
humid-445 ity by means of aqueous solutions.”E104–02, West Conshohocken, PA.
446 ASTM. (2010).“Test method for determination of pore volume and pore
447 volume distribution of soil and rock by Mercury Intrusion Porosimetry.”
448 D4404-10, West Conshohocken, PA.
449 Benavente, D., Linares-Fernández, L., Cultrone, G., and Sebastián, E.
450 (2006).“Influence of microstructure on the resistance to salt
crystalli-451 sation damage in brick.”Mater. Struct., 39(1), 105–113. 1617
452 Bernal, J. L. P., and Bello, M. A. (2001).“Fractal geometry and mercury
453 porosimetry comparison and application of proposed models on
build-454 ing stones.”Appl. Surf. Sci., 185(1–2), 99–107. 18
455 CEN. (2001). “Hygrothermal performance of building materials and
456 products—Determination of water vapour transmission properties.”
457 EN ISO 12572:2001, Brussels, Belgium.
458 CEN. (2005). “Methods of testing cement—Part 1: Determination of
459 strength.”CSN EN 196-1, Brussels, Belgium.
460 Charola, A. E. (2000).“Salts in the deterioration of porous materials: An
461 overview.”J. Am. Inst. Conserv., 39(3), 327–343. 19
462 CONTEMP. (2013). “Adendo: Tabelas de Emissividade.” 〈http://www
463 .contemp.com.br/downloads/pdf/Tabela_de_Emissividades.pdf〉 (Sep.
464
16, 2013). 20
465 De Clercq, H., De Zanche, S., and Biscontin, G. (2007).“TEOS and time:
466 The influence of application schedules on the effectiveness of ethyl
467 silicate based consolidants.”Restor. Build. Monuments, 13(5), 305–318. 21
468 Diaz Gonçalves, T., Brito, V., and Pel, L. (2012).“Water vapor emission
469 from rigid mesoporous materials during the constant drying rate
470 period.”Dry. Technol., 30(5), 462–474. 22
471 FLIR Systems. (2009).“FLIR reporter professional. Manual del Usuario.”
472
〈http://support.flir.com/DocDownload/Assets/46/Spanish/1558568
473 $a401.pdf〉(Sep. 16, 2013).
474 Hammecker, C. (1993).“Importance des transferts d’eau dans la
dégrada-475 tion des pierres enœuvre.”Thèse de doctorat, Université Louis Pasteur,
476
Strasbourg, France. 23
477 I’Anson, S. J., and Hoff, W. D. (1984).“Water movement in porous
build-478 ing materials—VIII. Effects of evaporative drying on height of capillary
479 rise equilibrium in walls.”Build. Environ., 21(3–4), 195–200. 24
480 ISO. (2012).“Geometrical product specifications (GPS). Surface texture:
481 Areal—Part 2: Terms, definitions and surface texture parameters.”ISO
482
25178–2. 25
Surface temperature (ºC)
Time (min) Sun
Mean surface temperature (ºC)
Sun
P
R
O
O
F
O
N
L
Y
483 Jeannette, D. (1997). “Structures de porosité, mécanismes de transfert484 des solutions et principales altérations des roches des monuments.” 485 La Pietra dei Monumenti in Ambiente Fisico e Culturale, R. A. Lefèvre, 48626 ed., European Univ. Centre for Cultural Heritage, Ravello, 49–77. 27
487 Katz, A. J., and Thompson, A. H. (1985).“Fractal sandstone pores: Impli-488 cations for conductivity and pore formation.”Phys. Rev. Lett., 54(12), 48928 1325–1328.
490 Mandelbrot, B. (1967).“How long is the coast of Britain? Statistical self-49129 similarity and fractional dimension.”Science, 156(3775), 636–638. 49230 Mandelbrot, B. (1998).Objectos fractais, Gradiva, Lisboa.
493 Massari, G., and Massari, I. (1993). Damp buildings: Old and new, 494 ICCROM, Rome.
495 Matias, L. (2012). “Thermography.” Testing techniques for structures 496 inspection, Duratinet Course, LNEC, Lisbon, Portugal.
497 Matias, L., Vilhena, A., Cristian, A., Santos, C., and Veiga, M. (2007). 498 “Laboratory thermographic analysis of masonry specimens. Capillarity 499 and drying.”Proc., 7th Int. Symp. Conservation of Monuments in the 50031 Mediterranean Basin, Orléans.
501 OMEGA. (2013). “Table of total emissivity.” 〈http://www.omega.com/ 502 temperature/Z/pdf/z088-089.pdf〉(Sep. 16, 2013).
503 RAYTEK. (2004).“High performance infrared thermometer.”〈http://www
504 .instrumart.com/assets/MX4_manual.pdf〉(Sep. 16, 2013).
505 RILEM TC 25-PEM. (1980).“Recommended tests to measure the
deterio-506 ration of stone and to assess the effectiveness of treatment methods.”
507
Mater. Struct., 13, 175–253. 32 33
508 Rousset-Tournier, B. (2001). “Transferts par capillarité et évaporation
509 dans des roches. Rôle des structures de porosité.”Thèse de doctorat,
510 Université Louis Pasteur, Strasbourg, France. 34
511 Scherer, G. W. (1990). “Theory of drying.”J. Am. Ceram. Soc., 73(1),
512
3–14. 35
513 Sherwood, T. K. (1929).“The drying of solids II.”Ind. Eng. Chem., 21(10),
514
976–980. 36
515 Tang, R., and Etzion, Y. (2004).“Comparative studies on the water
evapo-516 ration rate from a wetted surface and that from a free water surface.”
517
Build. Environ., 39(1), 77–86. 37
518 Taylor Hobson. (2009). “Talysurf CLI: 3D surface profiling systems.”
519
〈http://www.f-di.hu/cli_systems.pdf〉(Nov. 13, 2013).
520 Tournier, B., Jeannette, D., and Destrigneville, C. (2000).“Stone drying:
521 An approach of the effective evaporating surface area.”Proc., 9th Int.
P
R
O
O
F
O
N
L
Y
Queries
1. Please provide the ASCE Membership Grades for the authors who are members.
2. NEW! ASCE Open Access: Authors may choose to publish their papers through ASCE Open Access, making the paper freely available to all readers via the ASCE Library website. ASCE Open Access papers will be published under the Creative Commons-Attribution Only (CC-BY) License. The fee for this service is $1750, and must be paid prior to publication. If you indicate Yes, you will receive a follow-up message with payment instructions. If you indicate No, your paper will be published in the typical subscribed-access section of the Journal.
3. Please check and confirm the heading levels are ok in this article.
4. Please check and confirm edits made in Tables. 1–6 are ok.
5. Please define the abbreviations B, MB, CA, and T on first reference.
6. Is the word“Areal”correct?
7. Please add the Talymap Gold software to the references list.
8. Please spell out LNEC on first reference.
9. The citation (Janssens (2003) mentioned in this sentence is not present in the References list. Please provide the full details for (Janssens (2003), and we will insert it in the References list and link it to this citation.
10. We have changed the underlined values to bold. Please provide significance for bold values in Table 5.
11. Please check and confirm the layout of Table 5 is ok
12. Please provide part label captions for Fig. 7.
13. Is the word “puting”correct in the acknowledgments?
14. Issue number ’20’ has been inserted in this reference. Please check and confirm the edit made here.
15. Issue number ’5’has been inserted in this reference. Please check and confirm the edit made here.
16. A check of online databases year found in this reference. Please Add year ’2007’.
17. Issue number ’1’has been inserted in this reference. Please check and confirm the edit made here.
18. Issue number ’1-2’has been inserted in this reference. Please check and confirm the edit made here.
19. Issue number ’3’has been inserted in this reference. Please check and confirm the edit made here.
20. Please provide english translation for ref. CONTEMP.
21. This query was generated by an automatic reference checking system. This reference (De Clercq et al. 2007) could not be located in the databases used by the system. While the reference may be correct, we ask that you check it so we can provide as many links to the referenced articles as possible.
22. Issue number ’5’has been inserted in this reference. Please check and confirm the edit made here.
23. Please provide english translation for ref. Hammecker (1993).
24. This query was generated by an automatic reference checking system. This reference (I’Anson and Hoff 1984) could not be located in the databases used by the system. While the reference may be correct, we ask that you check it so we can provide as many links to the referenced articles as possible.
P
R
O
O
F
O
N
L
Y
26. Please provide country name for the Jeannette (1997) reference.27. Please provide english translation for ref. Jeannette (1997).
28. Issue number ’12’ has been inserted in this reference. Please check and confirm the edit made here.
29. Issue number ’3775’ has been inserted in this reference. Please check and confirm the edit made here.
30. Please provide english translation for ref. Mandelbrot (1998).
31. Please provide the publisher or sponsor name and location (not the conference location) for the reference Matias et al. (2007).
32. This query was generated by an automatic reference checking system. This reference (RILEM 1980) could not be located in the databases used by the system. While the reference may be correct, we ask that you check it so we can provide as many links to the referenced articles as possible.
33. Please provide issue number for the RILEM (1980) reference.
34. Please provide english translation for ref. Rousset-Tournier 2001.
35. Issue number ’1’has been inserted in this reference. Please check and confirm the edit made here.
36. Issue number ’10’ has been inserted in this reference. Please check and confirm the edit made here.
37. Issue number ’1’has been inserted in this reference. Please check and confirm the edit made here.