UNIVERSIDADE DE LISBOA
FACULDADE DE CIÊNCIAS
DEPARTAMENTO DE BIOLOGIA VEGETAL
Investigation of the effects of
weight loss on Ovis aries muscle
– A proteomic study on three
breeds with different levels of
ad-aptation to nutritional stress
Rui Miguel Guerreiro Palhinhas
Master in Biologia Celular e Biotecnologia
UNIVERSIDADE DE LISBOA
FACULDADE DE CIÊNCIAS
DEPARTAMENTO DE BIOLOGIA VEGETAL
Investigation of the effects of
weight loss on Ovis aries muscle
– A proteomic study on three
breeds with different levels of
ad-aptation to nutritional stress
Thesis oriented by Professor Pedro Fevereiro and André Almeida PhD
Rui Miguel Guerreiro Palhinhas
Master in Biologia Celular e Biotecnologia
iii
Resumo
Nos trópicos, a produção animal em regime extensivo enfrenta grandes obstáculos, talvez o maior dos quais é a perda de peso sazonal, devida à época seca existente nos países cais com uma pluviosidade muito baixa ou até mesmo inexistente. Em muitos países tropi-cais, a produção animal foca-se sobretudo na ovelha e, principalmente nos sistemas tradici-onais, recorre ao uso de espécies nativas pois estas, duma forma geral, apresentam maior resistência às condições ambientais comparativamente com as espécies seleccionadas. Factores importantes para a escolha das espécies nativas sobre as seleccionadas são a tolerância a longos períodos sem alimento nem água, às altas temperaturas e a insectos causadores de doenças, como por exemplo a miíase – designação geral para doença para-sitária causada pela larva de moscas ou outros dípteros. A escassez de alimento leva a que o animal perca peso, podendo atingir uma diminuição de peso na ordem de 40% em ove-lhas.
É evidente a necessidade para desenvolvimentos nas áreas da produção animal para evitar as quebras na produção e rendimento. Na Austrália, uma medida para reduzir essa diminui-ção de produdiminui-ção passa pelo progressivo abandono das raças e sistemas de produdiminui-ção tradi-cionais e pela adopção de raças ‘alternativas’. Um típico exemplo é a passagem de sistemas de produção de lã para sistemas de produção de carne. Os sistemas de produção de lã, normalmente com apenas a raça Merino, estão numa tendência de abandono, devido princi-palmente aos custos elevados de manutenção e mão-de-obra bem como à diminuição do valor da lã nos mercados internacionais. Sistemas de produção de lã baseados em Merino passam a ser sistemas de produção de carne com raças de pêlo, como por exemplo as ra-ças Dorper e Damara, as rara-ças ‘alternativas’ mais importantes na Austrália.
Estas três raças apresentam diferenças ao nível da tolerância à escassez de alimento: a Merino, sendo uma raça oriunda de selecção, apresenta o nível mais baixo de tolerância; a Dorper apresenta o nível de tolerância intermédio; a Damara é a raça mais tolerante, das três, à escassez de alimento.
Dado que a escassez de alimento conduzirá eventualmente à perda de peso, a perda de peso deve-se essencialmente pela utilização das reservas energéticas do corpo do animal: primeiro há consumo do tecido adiposo com reduzido consumo proteico, seguindo-se um aumento da degradação das proteínas, é de esperar que haja diferenças na expressão das proteínas entre um animal bem alimentado e outro em perda de peso (subalimentado). As-sim, este trabalho pretende identificar essas proteínas cuja expressão varia entre condições de favoráveis e desfavoráveis ao ganho de peso. Para tal recorreu-se à técnica de
Electrofo-iv
rese Bidimensional usando 6 grupos experimentais, grupo de controlo e grupo com subnutri-ção para cada uma das três raças, com quatro réplicas biológicas, amostras de quatro ani-mais diferentes por grupo experimental. Obtiveram-se assim 24 géis, com um total de 1228
spots, dos quais apenas 22 eram estatisticamente significativos ( ) e tinham um po-der de pelo menos 0,8. Todos os 22 spots foram seleccionados para identificação, em que 16 foram identificados com sucesso. Estas 16 proteínas distribuem-se, de acordo com a sua função, por proteínas do metabolismo (23%), proteínas estruturais (18%) e proteínas do aparelho contráctil (32%).
Palavras-chave: músculo gastrocnemius, perda de peso sazonal, Ovis aries, proteómica, MALDI-TOF/TOF
v
Abstract
In tropical countries, extensive ruminant production faces several constraints, of which the most important is seasonal weight loss, which is caused by a dry season with very low rain levels or no rain at all. In the majority of these countries, the animal most used for production is sheep, namely indigenous breeds, as these breeds can, generally speaking, endure harsher environment conditions than selected breeds. Being able to better tolerate lack of food and water is a very important feature an animal should have regarding extensive pro-duction systems.
In Australia, currently, the sheep industry is mainly focused on the Merino breed. This breed, introduced in Australia by the Europeans and a derivative from the European breed, i.e. a selected breed, is wool breed and as such is mainly used for wool production, with very few animals being used for meat. This, however, creates a problem for these industries: with the decrease in price of wool and the increase of labour costs, it is becoming less and less eco-nomically viable to produce Merino for wool. Because of this, increasing number of producers are looking for alternative breeds that can better withstand the lack of food and tolerate some diseases that affect greatly Merino sheep. Two breeds are standing out due to their ability to withstand prolonged undernutrition: the Damara and the Dorper. These two breeds have high and intermediate tolerance to undernutrition, respectively, while the Merino have very low tolerance to undernutrition.
If the undernutrition, and the associated weight loss, is long enough, there will be protein break down in response to the need for energy to maintain the animal’s metabolism. In re-gard to the interested in selecting traits like weight loss resistance for increased animal pro-duction rates, this work aims at providing information about protein markers which may be used to access tolerance to undernutrition and be used as a tool to better select the desired traits in the animals.
A proteomic approach of Two-Dimensional Gel Electrophoresis was used to compare
gas-trocnemius muscle protein expression patterns between six experimental groups: three
sheep breeds (Damara, Dorper and Australian Merino) grouped in a control (not feed re-stricted) and a feed restricted group; samples from four animals for each group were used. A total of 24 gels was obtained. After staining and analysis, 22 spots were detected as signifi-cantly ( ) different and with a power of at least 0.8. All spots were selected for identifi-cation, 16 were successfully identified, with the identified proteins ranging from structural, metabolic and contractile apparatus roles.
vi
Keywords: gastrocnemius muscle, seasonal weight loss, Ovis aries, proteomics, MALDI-TOF/TOFvii
Acknowledgements
First of all, I would like to thank Professor Ana Varela Coelho for giving me the opportunity to work in the Mass Spectrometry lab and in this particular subject of research. I also thank An-dré Almeida for the support and guidance during the time I was working in this project.
Secondly, I would like to acknowledge funding from FCT – Fundação para a Ciência e a Tecnologia (Lisboa, Portugal), in the form of project POCI/CVT/57820/2004 – Studies on genetic and physiological characterization of sheep adaptation to food restriction and funding from the Department of Agriculture and Food (Perth, WA, Australia) in the form of the project: A comparison of Damara, Dorper and Merino sheep breeds to nutritional stress as well as acknowledge the most valuable contribution by DAFWA staff: T. Kilminster, T. Scanlon, A. Harrod, L. Young, N. Stanwyck, E. Kidson and R. Butler (DVM), from the Merredin Research station, M. Young (Geraldton office), C. Oldham and J. Greeff (Perth) and, finally, J. Milton from the University of Western Australia for contribution on field and abattoir work; the dona-tion of animals used in the experimental trial by the Western Australian farming community, and all facilities kindly provided by Tammin abattoir and Spearwood Meat processing plant are also appreciated. Without the funding and the hard work of all these people, I would not have any samples to work with nor a project to work in.
A big thank to Miguel Ventosa, my predecessor, for allowing me to follow his every step on those first days and for all the explanations about the 2D-E techniques; to Renata Soares and Elizabete Pires for all the explanations about, well, pretty much everything in the lab and for the very large amount of patient they spared on me.
To the girls of the MS lab, Sofia Rodrigues, Romana Santos, Renata Soares, Elizabete Pires, Kamila Koci and Catarina Franco, and to Miguel Ventosa for making the work in the lab and the lunch time more enjoyable.
I thank my parents for all the support they have given me in all these years of studying. A special thanks to Vânia Neves, Rita Velez Grilo and Patrícia Dias for all the support, the company on those long nights and weekends at the lab, and for making me smile and laugh even on those days where everything seemed to go wrong, despite being so very far away in Coimbra, Azores or Braga.
I dedicate this thesis to Joana Henriques, who left us too soon: may your star always shine upon us making us feel you are still with us every day.
viii
Index
Resumo ... iii Abstract ... v Acknowledgements ... vii Introduction ...1Seasonal Weight loss and Animal Production in the Tropics ...1
Southern Africa Hair sheep ...1
The Dorper ...1
The Damara ...2
The Australian sheep industry and the introduction of Southern Africa hair sheep ...3
Muscle and Weight Loss: Metabolism and Biochemistry ...4
Two-Dimensional Gel Electrophoresis ...6
Mass Spectrometry: MALDI-TOF/TOF ...8
Matrix-Assisted Laser Desorption/Ionization ...8
Time-Of-Flight ...9
Time-Of-Flight/Time-Of-Flight ...9
Previous work on sheep, weight loss and proteomics ...10
Objective ...10
Material and Methods ...10
Animals and Experimental design ...10
Protein extraction and quantitation ...12
Optimization of First-Dimension Electrophoresis ...12
Equilibration and second dimension electrophoresis ...14
Gel scan and analysis ...14
Protein Identification ...14
Results ...17
Optimization of First-Dimension Electrophoresis ...17
Differential Expression Analysis ...20
ix
Discussion and Conclusion...23
Protocol Optimization: Two-Dimensional Gel Electrophoresis ...23
Differential Expression Analysis ...26
1
Introduction
Seasonal Weight loss and Animal Production in the Tropics
Animal production, and particularly small ruminants, play a significant economic role in many countries, namely in the tropics, as it is a key source of revenue for governments and sub-sistence farming systems and also a major source of food in rural areas (Jahnke, 1983; Almeida, 2011).
In the tropics, extensive ruminant production faces several constraints, being the most im-portant, seasonal weight loss (SWL) caused by the existence of a dry season with varied extent and during which pastures are particularly scarce (Boza et al., 1999). SWL may be as high as 40% in sheep (Almeida et al., 2002, 2006, 2007; Almeida, 2004). There is, therefore, a need for developments and improvements in animal production in order to minimize the losses in ruminant production, especially in the context of rapidly growing human population (Jahnke, 1983) that will tend to move livestock production to marginal areas.
In most tropical countries, sheep are produced in a subsistence system. In this production system, breeds used are indigenous ones, which are, generally, able to withstand harsher conditions – lack of food and water, high parasite loads and tropical diseases – than the se-lected breeds of European origin (Almeida, 2011). Interestingly, such native breeds are most-ly hair breeds, and some are also fat-tailed – i.e. they have a fat depot at their hind quarter –, which, to the English market in the 1930’s, were considered to be undesirable. Yet, due to their better suitability to their native environment, an interest in crossing these indigenous breeds with selected breeds, with more interesting carcass qualities, began to increase (Milne, 2000; Almeida, 2011). Nowadays, there is still room for breed improvement in order to increase productivities, which may be accomplished if the genetic resources of indigenous breeds are used (Almeida and Cardoso, 2008aundefinedb).
In this context, two Southern African breeds are raising particular interest: the Dorper and Damara. A small history of the origin of these two breeds shall be discussed subsequently.
Southern Africa Hair sheep
The Dorper
The Dorper breed, today considered to be an important meat producing breed (Almeida, 2011), was developed in order to have specific characteristics – an acceptable meat carcass, be resistant to low temperatures in winter and extreme temperatures in summer, be a sheep with little need for care. The cross breeding started with the Black Head Persian – an
indige-2
nous breed of Southern Africa, native to the areas in border of the Kalahari desert able to thrive in semi-desert conditions – and the Dorset Horn from England, a breed with interesting carcass traits. The objective was to merge the adaptability of the Persian Black Head and the carcass traits of
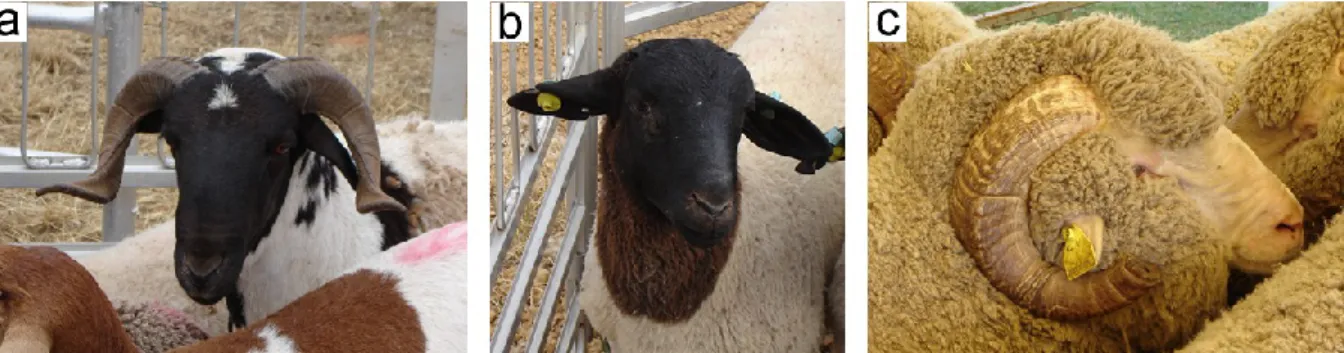
Figure 1 – Three sheep breeds used today in sheep industry. Sheep breeds: a – Damara; b – Dorper; c – Australian Merino.
the Dorset Horn. The name ‘Dorper’ first appeared in 1947, by a farmer called Edmeades. The breed has since been further developed and its meat is now considered of top quality and because of that, it is exported to several countries, particularly, to Australia (Milne, 2000). Nowadays, sheep of the Dorper breed (Figure 1.b) are considered to be tolerant to seasonal weight loss, to diseases caused by ticks, to strong radiation, to some plant poisons and are also able to eliminate the excess salt from the water they drink (Almeida, 2011).
The Damara
The Damara breed (Figure 1.a) is a fat-tailed sheep, the best known breed of this kind. Its ascendants were indigenous fat-tailed sheep that roamed Southern Africa, from Southern Angola to the Northern Cape Province in South Africa and coinciding with present-day Na-mibia. The breed fully developed based on a few animals that were apprehended and trans-ported to a research facility in South Africa during the Administration of Namibia by South Africa (from the First World War to the 1990’s). Once there, an improvement scheme was followed which led to the full development of the Damara breed as such. These animals have a high adaptation to semi-desert areas so they tolerate high temperatures, seasonal weight loss, common diseases and parasites. Being long-legged animals, they are able to wonder large areas in search for feed or water. What makes Damara particularly interesting for ex-tensive animal production is that this breed requires little care and yet can accomplish a high level of productivity. Damara sheep were eventually exported to Australia where a significant population was established (Almeida, 2011).
3
The Australian sheep industry and the introduction of Southern Africa
hair sheep
Since the arrival of Europeans to Australia, several species of domestic animals have been introduced. Near the end of the 18th century, the first Merino sheep was introduced. A
Meri-no-like breed – Australian Merino (Figure 1.c) nowadays – has been the main basis for the industry in Australia since that first introduction (Jayasuriya, 2007; Almeida, 2011).Merino is a wool-breed, mainly used for wool production. Being able to shear about 7 kg of wool per year, this breed is the most used for wool in Australia (Jayasuriya, 2007; Almeida, 2008). The Australian sheep industry is mainly an extensive production system, which main product is wool for exportation. For the last 40 years, the Australian sheep industry has been changing and adapting to pressures from the markets: there is lower demand for wool at the interna-tional markets, which in turn decreased the wool prices, and there has been a marked in-crease in the labour costs, particularly regarding shearing. Due to these constraints and also due to the growing drought periods, there has been a search for alternatives in order to re-duce expenses and/or increase income (Almeida, 2008, 2011). Another problem that the Australian wool industry faces is that of the Merino’s susceptibility to Myiasis caused by flies of the Calliphoridae family (Almeida, 2008). Myiasis is a kind of infection, or infestation, in which a domestic animal, human or any other mammal, is host to fly larvae (Francescone and Lupi, 2006). These larvae feed on the animal’s tissue, either dead or living tissue, and these causes loss of animal fitness which in turn causes great economic losses, in part be-cause the recovery is very difficult and expensive (Francescone and Lupi, 2006; Almeida, 2008; Australian Wool Innovation Limited, 2011). In the specific case of Merino sheep, myia-sis appears in the skin wrinkles around the tail – the flies lay their eggs in the wool of that area of the animal’s body (Almeida, 2008; Australian Wool Innovation Limited, 2011). Com-mon practice to avoid the deposition of eggs is to surgically remove the skin wrinkles (Almeida, 2008; Australian Wool Innovation Limited, 2011); however, there is increasing con-cern for animal welfare and the termination of such practices (Australian Wool Innovation Limited, 2011) that cause bigger stress than the infestation itself, according to a recent re-view by (Lee and Fisher, 2007)
One alternative being used is the introduction of ‘alternative’ sheep breeds which should be able to tolerate seasonal weight loss and lack of feed (pasture) and be easy to care, should not have wool, thus needless of shearing, and should also withstand the flies responsible for myiasis – infection that causes great economic losses on Merino-based systems, due to this breed susceptibility (Almeida, 2011).
4
The ‘alternative’ breeds used to overcome such constraints are mainly the Dorper and the Damara. In fact, in the first five years since the beginning of the imports, the number of pure Damara animals in the country was estimated in over 10,000 animals.
Muscle and Weight Loss: Metabolism and Biochemistry
The main subject of this thesis is skeletal muscle proteomic. It is important to understand muscle structure, its metabolism and biochemistry of weight loss. As such, a brief description of this subject shall be laid out up front.
Skeletal muscle is comprised of multiple muscle fibres. These fibres are, in turn, composed by myofibrils, which can go from end to end of the entire muscle fibre (Zubay, 1998; Voet et
al., 1999; Seeley et al., 2008). Myofibrils are organized in a repetitive layout – they present a
repeating structure, the sarcomere (Zubay, 1998). It is the composition of the sarcomere that causes the striated aspect of the skeletal muscle; it is due to the varying density of the fila-ments comprising the sarcomere. These filafila-ments form bands called A band for the thick filaments and I band for the thin filaments (Zubay, 1998). In the centre of the I band, there is a thick line, Z line (or disk), to which the actin (thin) filaments are connected. In the centre of the A band is the H zone, where there is only myosin and no actin and myosin filaments overlap, contrary to the remaining of the A band, and in the centre of the H zone is the M line (or disk), to which the myosin chains are attached (Zubay, 1998; Voet et al., 1999; Seeley et
al., 2008). The sarcomere is defined as the region between two adjacent Z lines (Zubay,
1998).
The thick filaments are made of myosin – myosin filaments – and the thin filaments are com-posed of three proteins, actin, tropomyosin and troponin. Myosin is formed by two long heavy-chains, forming a coiled coil, and two light chains located at the head of each heavy chain (Zubay, 1998; Voet et al., 1999; Seeley et al., 2008). The myosin head has ATPase activity and it connects to one actin molecule of the thin filament. The thin filaments, on the other hand, being composed of three proteins, are the result of an aggregate of actin mole-cules, in the form of a double helix, associated with tropomyosin which is bond to a troponin molecule (Voet et al., 1999; Seeley et al., 2008). Tropomyosin is a two-chain coiled coil and each tropomyosin binds, in a head-to-tale fashion, another trpomyosins and, also, to seven actin molecules; troponin is a heterotrimeric molecule, composed of troponin-C, troponin-T and troponin-A, that regulates the access of the thick filaments heads to the actin (Zubay, 1998; Voet et al., 1999).
Because the myosin heads is an ATPase, there is a requirement for ATP in order to take place muscle contraction. However, muscles are a consumption-only tissue as they cannot
5
synthesize glucose from other precursors because they lack the necessary enzymes (Zubay, 1998). Due to this, the energy for must come from tissues capable of producing energy. According to a great review by Wang et al., (2006), the energy required for all aspects of life of all animals is obtained from the food they eat; when there is no food or between meals, the animal must resort to body reserves. The amount of tolerance an animal can have to lack of food depends on its ability to store energy resources and to control the use of these same resources during periods of food scarcity. When food deprivation starts, animals must allo-cate the existing internal energy supplies to basal metabolism, physical activity, growth and reproduction. The bigger the energy stored internally at the time of the deprivation of food, the longer can the animal endure without eating. Also, if the animal is able to reduce its me-tabolism, the longer the internal energy supply will last (Wang et al., 2006). Generally, in the event of undernutrition, there is a decrease in protein synthesis while tissue break down in-creases (Almeida et al., 2002). With prolonged lack of food, the metabolic responses of the animal will proceed in stages and ultimately, in case of extreme starvation, will end with the death of the animal (Wang et al., 2006).
In mammals, three phases are considered as the metabolic responses to food deprivation. The first phase immediately starts at the end of the last meal and is defined as the use of glycogenolysis as energy supply. This allows sugar levels in the blood to remain constant (Wang et al., 2006). As the body’s supply of carbohydrate and the concentration of glucose in the blood decreases, insulin concentration also decreases, which in turn inhibits glucose uptake by muscles, which must then use fatty acids, at this point already being released from fat depots into the blood stream, as energy source, sparing glucose for other uses by the metabolism (Voet et al., 1999; Wang et al., 2006).
The second phase starts when glycogenolysis has depleted all liver glycogen. When this happens, gluconeogenesis comes to effect, in order to supply with glucose those organs that require this nutrient. Gluconeogenesis, at least in humans, starts by using as fuel amino ac-ids from the degradation of muscle protein, but this degradation in this phase is rather slow, as the major energy supply for gluconeogenesis comes from glycerol liberated from adipose tissues. As oxidation of the fatty acids continues to increase, it leads to a high production of ketone bodies, which may also be used as energy source for muscles and many other tis-sues. This phase can last for several weeks and in this phase the weight loss is minimal due to the high energy content of lipid (Voet et al., 1999; Wang et al., 2006).
When the adipose stores reach depletion, the source of glycogen for gluconeogenesis ends and as such the metabolism starts degrading protein from muscle to use the resultant amino acids as source for gluconeogenesis. This is the third phase and in this phase there is an
6
increase in the weight loss as muscle mass is rapidly lost. With the continuity of loss of mus-cle protein, the animal will not hold for long and shall perish soon (Wang et al., 2006).
Bearing this in mind, it is expected to encounter differences between a well-fed animal and one suffering from undernutrition. This work, being, as said earlier, a muscle proteome anal-ysis, seeks to find these differences, and for that goal it will use Two-Dimensional Electro-phoresis to compare protein expression between the experimental groups. In order to better understand this technique, a detailed explanation is given.
Two-Dimensional Gel Electrophoresis
Electrophoresis is based in the principle that charged molecules and particles in solution can be moved using an electrical field which is applied to the mixture (Amersham Biosciences, 2001; Westermeier, 2001). Electrophoresis is mostly used for molecular separations as the molecules under the influence of an electrical field move at a speed rate which depends on the charge, shape and size of the molecules, consequently these molecules will be fraction-ated according to their properties and will be detected as bands, or spots, at different posi-tions (Amersham Biosciences, 2001; Westermeier, 2001). The main use for electrophoresis is for macromolecules – proteins and nucleic acids – but it is also used for separation of smaller charged molecules – sugars, amino acids, nucleotides (Amersham Biosciences, 2001; Westermeier, 2001).
Electrophoresis takes place in a matrix-stabilized solution – due to the heat generated by the electric current, the bands diffuse and mix convectively if no stabilizing medium is used. The matrix can be made of several different materials – paper, starch, agarose or polyacrylamide. In the latter two, the matrix acts as a sieve, enhancing the size separation. Following the electrophoretic run, the separated molecules are usually detected by staining or autoradiog-raphy (Amersham Biosciences, 2001).
For analysis of complex mixtures of proteins – for instance, mixtures resultant from whole cell extracts – one of the most important tools, if not the most important, is Two-Dimensional Pol-yacrylamide Gel Electrophoresis (Garfin and Heerdt,). As the name suggests, proteins are separated on a two-step process. First the proteins are subjected to Isoelectric Focusing (IEF), which separates proteins according to their pI (Westermeier, 2001; Garfin and Heerdt,). The proteins being amphoteric molecule species – meaning their net charge can be positive, neutral or negative depending on the pH of the surrounding medium – have a spe-cific pH value at which they have neutral net charge – their isoelectric point, pI. IEF is, nowa-days, carried out on Immobilized pH Gradients (IPG) strips – special polyacrylamide gel strips co-polymerized with Immobilines, acrylamide derivatives in which the Nitrogen atom is
7
linked with either a carboxylic or amino group – and it’s working principle is that a protein applied anywhere on the strip will migrate, under an electrical field, towards the electrode bearing the opposite charge of the protein until the protein reaches the point in the strip where the pH equals the protein’s pI – a protein with a negative net charge will move towards the anode, another protein with a positive net charge will move towards the cathode (Westermeier, 2001; Garfin and Heerdt,). Once the protein reaches its pI, the electrical field ceases its influence on the protein, but, due to the long run times necessary for IEF, a protein can start to diffuse. If this happens, the protein will immediately gain a net charge, thus being focused back into its pI (Westermeier, 2001; Garfin and Heerdt,).
Once the First-dimension is complete, the proteins in the strip must be prepared for the se-cond dimension. This is done by reducing disulfide bonds and alkylating the resultant sulfhy-dryl groups of the cysteine residues and also by coating the proteins with Sodium Dodecyl Sulphate (SDS) (Garfin and Heerdt,) – in a proportion of about 1.4 g of SDS per gram of pro-tein (Westermeier, 2001) – as to mask the intrinsic net charge of the propro-tein with a negative net charge from SDS – this is necessary to allow the ensuing separation of the proteins based only on their mass (Garfin and Heerdt,).
The Second-dimension occurs by a SDS-Polyacrylamide Gel Electrophoresis (PAGE). In this gel, proteins are separated based on their mass and usually there is a logarithmic relation-ship between the length of movement of a protein and its mass (Garfin and Heerdt,).
It is common to present 2-D gels as in a Cartesian coordinate system – acidic, low pI, pro-teins on the left side and lighter, low molecular mass, propro-teins at the bottom (Westermeier, 2001). This is the convention used in this thesis.
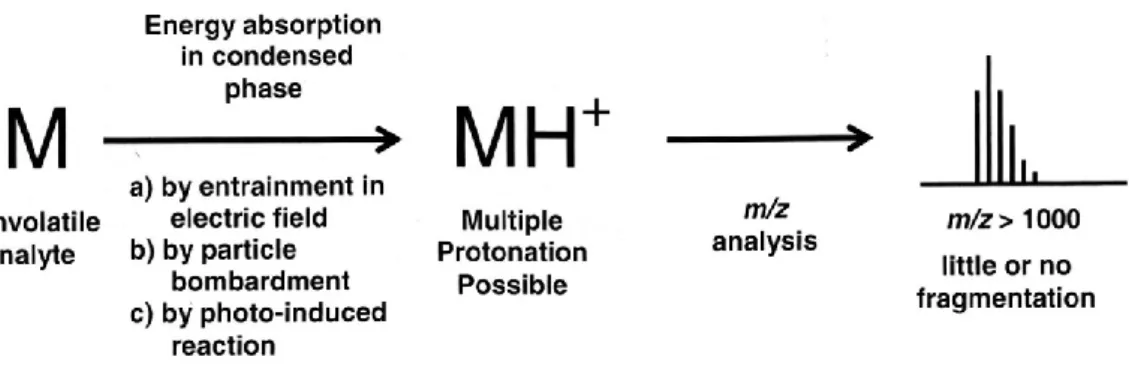
Figure 2 – Simplified schematic of a generic desorption/ionization analysis by mass spectrometry. From Watson & Sparkman (2007), used with permission.
2-D electrophoresis is usually followed by computer analysis of the gels and identification of proteins of interest, mostly by mass spectrometry methods (Westermeier, 2001; Yergey et
al., 2002). An introduction to mass spectrometry, with focus on MALDI ionization type and
8
Mass Spectrometry: MALDI-TOF/TOF
Watson and Sparkman (2007) have a great book on Mass Spectrometry. According to them, mass spectrometry is used to detect and quantify the amount of a given analyte and to de-termine the composition, at the elements level, and a few aspects of the structure, at the mo-lecular level, of the analyte. This is done by measuring the mass of gas-phase ions resulting from ionization of the analyte’s molecules, thus, mass spectrometry can be used to detect any element that can be ionized, not only organic molecules (Watson and Sparkman, 2007). Because ions are particles with a charge, they can be individually moved and grouped, by their mass and number of charges which are unique properties of the particle, using electrical and magnetic fields. However, this can only be done with individual ions free of any other matter, which can only be achieved under vacuum conditions, as vacuum removes every particle other than ionic ones, and with the ions in the phase. The ions being in the gas-phase, at low pressures, allows for their separation and detection according to their mass-to-charge ratio (m/z) – this ratio is obtained by dividing the mass at the atomic scale of the ion by its number of charges. 1 mass unit on atomic scale (u) equals to ⅟12 of the mass of 12C.
The result from the separation and detection of the ions of individual m/z values is a mass spectrum – the number of ions of a certain m/z value plot as a function of the m/z value (Watson and Sparkman, 2007).
Non-volatile analytes, such as proteins, are ionized by entrainment of a solution into an elec-trical field – Electrospray, usually used with Liquid Chromatography (LC) /MS – or by interac-tion with a matrix compound energized by a photon – Matrix-Assisted Laser Desorp-tion/Ionization (MALDI). This ionization occurs by formation of an adduct involving a proton (Figure 2, Watson & Sparkman, 2007). As in this thesis, MALDI is the source of ionization, a more detailed explanation will be subsequently provided.
After having the ions in the gas-phase, they must be separated and analysed according to their m/z; nowadays, there are several types of m/z analysers – magnetic sectors, transmis-sion quadrupoles, quadrupole ion traps, time-of-flight (TOF), ion cyclotron resonance mass spectrometers and orbitraps (Watson and Sparkman, 2007). The TOF analyser is the only one going to be discussed in this thesis as is the one which will be used in this work.
Matrix-Assisted Laser Desorption/Ionization
MALDI is used for thermally labile compounds which cannot be ionized by any other form. The principle inherent to MALDI is that an organic matrix compound is mixed with the sample in a sample plate; a laser pulse is focused on the sample plate; a phase transition from solid to gas occurs; the matrix, by absorption of energy, expands explosively and disperses some
9
ions, both from the matrix and the analyte. The matrix plays an important role during the ioni-zation process by precluding molecular/ionic interactions between two molecules of analyte. MALDI is considered as a soft ionization technique as the amount of fragmentation of the protonated molecule resultant of the MALDI process is very low (Watson and Sparkman, 2007).
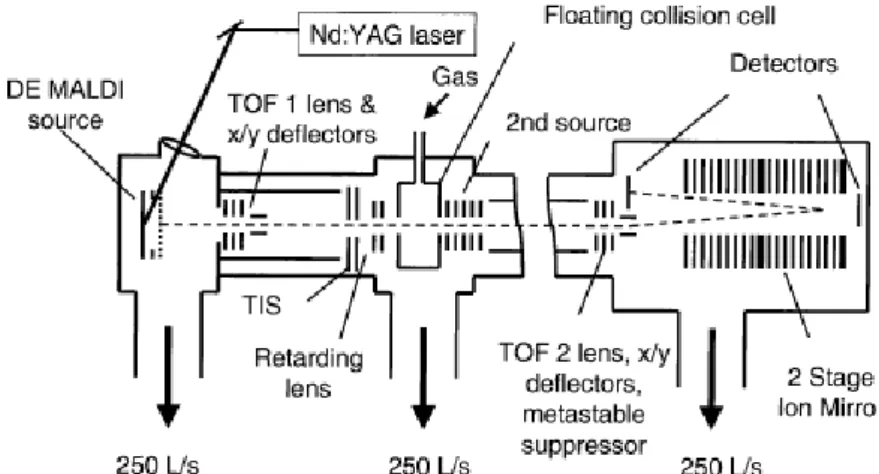
Figure 3 – Schematic of a MALDI-TOF/TOF. From Yergey et al. (2002).
Time-Of-Flight
The working principle of a TOF m/z analyser is the measuring of the time it takes an ion to travel from the ion source to the detector. Although all ions have the same initial acceleration, because of their different m/z values, they will have different velocities and, as they pass through the region between the ion source and the detector – called ‘field-free’ – they will be separated into groups determined by their velocity. The advantage to TOF is that this method of ion separation has no theoretical upper limit of m/z detection. Due to the longer path the ions have to travel in the TOF analyser, a high vacuum is highly needed in order to achieve a distance without any particle collision of about 1 meter – this is usually the length the ions must travel between the source and the detector (Watson and Sparkman, 2007).
Time-Of-Flight/Time-Of-Flight
Mass spectrometry/mass spectrometry is the best way to obtain real structural information from ions representative of the intact molecule produced by soft ionization techniques. MS/MS works by further fragmenting ions from the primary mass spectrum. For this, it is chiefly used a collisional cell situated between the first and second m/z analysers. In the TOF/TOF rationale, the ions travel through a smaller field-free region, allowing for the sepa-ration of a group – resolution of about 1 to 3 m/z – which will be selected for passage to the collision cell. The approaching group of ions goes through a deceleration field, reducing its kinetic energy as the group enters the collision cell. Progressing through the collision cell, some ions will have been fragmented, the ions will reaccelerated and exit the collision cell,
10
entering in a longer field-free region for optimum separation of the ions according to their respective m/z values, producing a MS/MS spectrum (Watson and Sparkman, 2007).
Figure 3 depicts a schematic representation of a MALDI-TOF/TOF instrument from Applied Biosystems.
Previous work on sheep, weight loss and proteomics
Several studies on muscle proteomics; sheep weight loss; muscle mass and muscle diseas-es exist. Some are focused on conditions that can affect muscle health or activity (Ivy et al., 1991; Bouley et al., 2005; Piec et al., 2005; Hamelin et al., 2006). Other studies concern the meat science: use of proteomics in order to discover markers for meat quality (Hollung et al., 2008; Liu et al., 2009; Zapata et al., 2009; Kim et al., 2009; Xu et al., 2009).
Studies on the physiology of weight loss are not abundant. Burton et al. (1974) studied the effect of weight loss and regrowth in body composition in sheep. Maxwell et al. (1992) stud-ied the effects of food restriction on rats.
Greenwood et al. (1998, 2000) studied the effect of birth weight and postnatal nutrition on body composition and muscle development. Hamelin et al. (2007) studied the differences between four types of muscle fibre and concluded that the differentiation is based on the ex-pression of proteins involved in oxidative metabolism.
In a proteomic mapping, Hollung et al (2009) suggests that proteomics is a useful tool to un-cover the molecular basis for physiological differences in muscles between pig breeds and age groups.
Objective
The aim of this work is to study the metabolic changes in the Gastrocnemius muscle caused by undernutrition at the level of the muscle proteome in sheep (Ovis aries). The ultimate goal is to identify possible markers of tolerance to weight loss in breeds of different origin and abilities to withstand seasonal weight loss. Such marker definition will be of relevance in the definition of selection strategies for animal production in the tropics.
Material and Methods
Animals and Experimental design
All the work described in this thesis was done using samples obtained during a nutrional trial which took place in Merredin, WA, Australia in October-November 2007. Briefly, 72 six-month old male lambs from 3 sheep breeds – Damara, Dorper and Australian Merino – were
11
randomly assigned to one of two diets – growth and restricted. This resulted in 6 experi-mental groups – Damara Growth, Damara Restricted, Dorper Growth, Dorper Restricted, Merino Growth and Merino Restricted – with 12 lambs each. The trial lasted 42 days (plus 16 days for animal adaptation) and both Australian (State – Perth, WA, Australia – and Com-monwealth) and European Union guidelines on care, use and handling of experimental ani-mal were followed.
Figure 4 – Previous experimental work: trial in Merredin, WA, Australia. a – Individual feeding pens during lambs feeding time. b – An aspect of animal weighting.
All 72 animals were kept together in a paddock, previously chemically sprayed with herbi-cide. The paddock was located near individual feeding pens, which were specially built for the trial (Figure 4.a).The only time at which the animals were not at the paddock was during the feeding sessions.
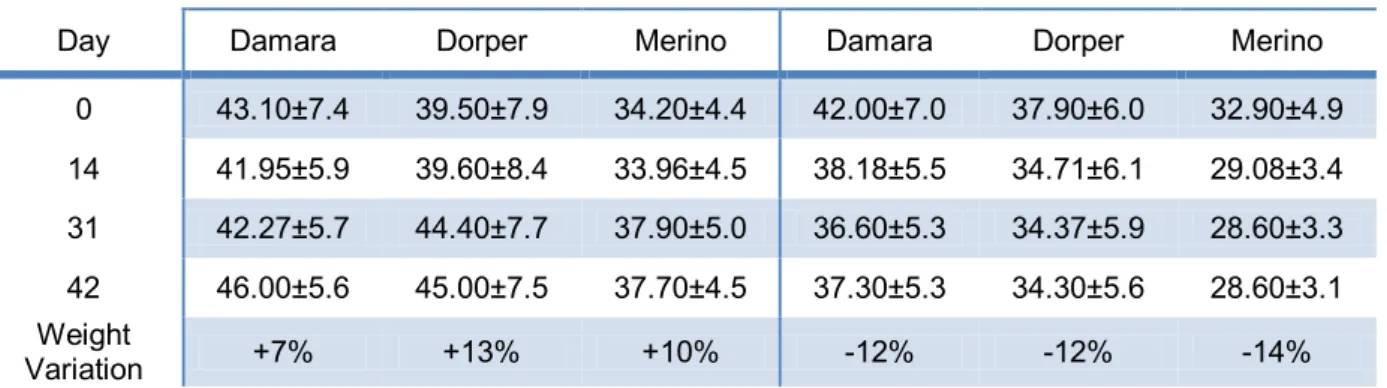
Table 1 – Evolution of live weigth (kg) during the trial, values are shown as mean ± standard error mean.
Growth Diet Restricted Diet
Day Damara Dorper Merino Damara Dorper Merino 0 43.10±7.4 39.50±7.9 34.20±4.4 42.00±7.0 37.90±6.0 32.90±4.9 14 41.95±5.9 39.60±8.4 33.96±4.5 38.18±5.5 34.71±6.1 29.08±3.4 31 42.27±5.7 44.40±7.7 37.90±5.0 36.60±5.3 34.37±5.9 28.60±3.3 42 46.00±5.6 45.00±7.5 37.70±4.5 37.30±5.3 34.30±5.6 28.60±3.1 Weight Variation +7% +13% +10% -12% -12% -14%
Animals were exclusively fed on commercial feed pellet (Macco 101, Macco Feeds, Austral-ia, Appendix II) and had free access to drinking water at all times. During the adaptation pe-riod (6 days) to the individual feeding pens, lambs were allowed one hour in the individual pens to eat a maintenance ration calculated by using the Freer equation Freer et al., 2007; for further details, kindly refer to Appendix I). After the adaptation period, animals were
allo-12
cated into each experimental group and individual ration was calculated for each animal based on its live weight in order to gain or lose weight at approximately 100 grams per day. Animals were weighted (Figure 4.b) twice a week in order to record growth performance. The first weighting of the week (every Tuesday) was used to adjustment the individual rations and the second (Friday) to determine the changes in bodyweight. Animals were weighed at least twice to obtain an adequate average weight.
At the end of the trial (day 42) animals were euthanized in a commercial abattoir following standard commercial practises and both WA state and Australian Commonwealth legisla-tions. Gastrocnemius muscle was sampled with a scalpel and snap-frozen in liquid nitrogen. Samples were later transported to Lisbon, where samples were stored at until subse-quent analysis.
For the following work, the Growth group was considered the Control group while the Re-stricted fed group continues as such. The nomenclature herein used is the following: Damara Control (DaC), Damara Restricted (DaR), Dorper Control (DoC), Dorper Restricted (DoR), Merino Control (MeC) and Merino Restricted (MeR).
Protein extraction and quantitation
From the 72 samples, 24 (4 per group) were randomly chosen. Protein was extracted from the muscle samples based on the procedure described by Bouley et al. (2004). Briefly, 1-2 g of frozen muscle sample was removed with a scalpel blade and homogenized in 1ml of ex-traction buffer (8.3 M Urea, 2 M Thiurea, 1% (w/v) DTT, 2% (w/v) CHAPS) with an Ultraturrax T8 homogenizer (IKA Werke, Staufe, Germany), followed by 30 minutes vortex in a cold-room at 4oC and a centrifuge at for 30 minutes. After the centrifugation,
superna-tant was collected to a new tube and immediately snap-frozen in liquid Nitrogen and stored at -80oC until further use. Protein quantitation was performed using the 2D Quant Kit (GE
Healthcare, Uppsala, Sweden), following manufacturer’s instructions.
Optimization of First-Dimension Electrophoresis
For the first-dimension, quantified protein extracts (600 µg) were incubated with urea rehy-dration solution (8 M urea, 2% (w/v) CHAPS, 0.28% (w/v) DTT), 2% IPG buffer 3-10 (GE Healthcare) and a trace quantity of bromophenol blue (total volume of 450 µl) for 1 hour at room temperature and were then centrifuged at 12 000 rpm for five minutes. This solution was used for active rehydration of 24 cm Immobiline™ DryStrip pH 3-10 strips (GE Healthcare, Sweden) covered with Immobiline™ DryStrip Cover Fluid (GE Healthcare) during 12 hours at 30 V. The active rehydration and the remaining of the IEF setup were run in an Ettan™ IPGphor™ 3. The remaining of the IEF setup was as follows, 1 hour at 200 V, 1 hour
13
at 500 V, 1 hour at 1 000 V, a gradient of 30 minutes set to 8 000 V and a final step of 50 000 Vhr at 8 000 V. This IEF setup had already been previously used in samples of rabbit’s gas-trocnemius muscle (Almeida et al., 2010).
As the results obtained with this IEF setup weren’t satisfactory (see Figure 1.a in the results section) neither the final voltage was achieved, a need for an optimization of the IEF setup for the sheep muscle samples was evident. The first optimization (IEF1) was tried by incre-menting the time of the gradient step – from 30 minutes to 1 hour – and increasing the length of the last step – from 50 000 to 80 000 Vhr. The results of this IEF1 (see Figure 1.b in the results section) were also not considered satisfactory, so another IEF setup was tested (IEF2) – gradient step increased even further to 1 hour and 30 minutes and the last step voltage-hours was also increased to 100 000 Vhr. Despite having better results with this op-timization (see Figures 1.c and 1.d in the results section), the final voltage did not reach achieve the 8 000 V. Due to the hypothesis that the samples may have higher concentration of salts than anticipated, there was a change in strategy in order to better allow the removal of such salts during the first low-tension steps of the IEF. In the third optimization (IEF3), samples were actively rehydrated at 30 V for 14 hours followed by another 2 hours of pas-sive rehydration, the entire process being conducted on StripHolders. After rehydration, strips were transferred to the Ettan™ IPGphor™ Manifold (GE Healthcare) and Paper elec-trodes (GE Healthcare) were applied to each end of each strip. The IEF setup was the follow-ing 100 V for 3 hours, 300 V for 1 hour and 30 minutes, 500 V for 1 hour and 30 minutes,
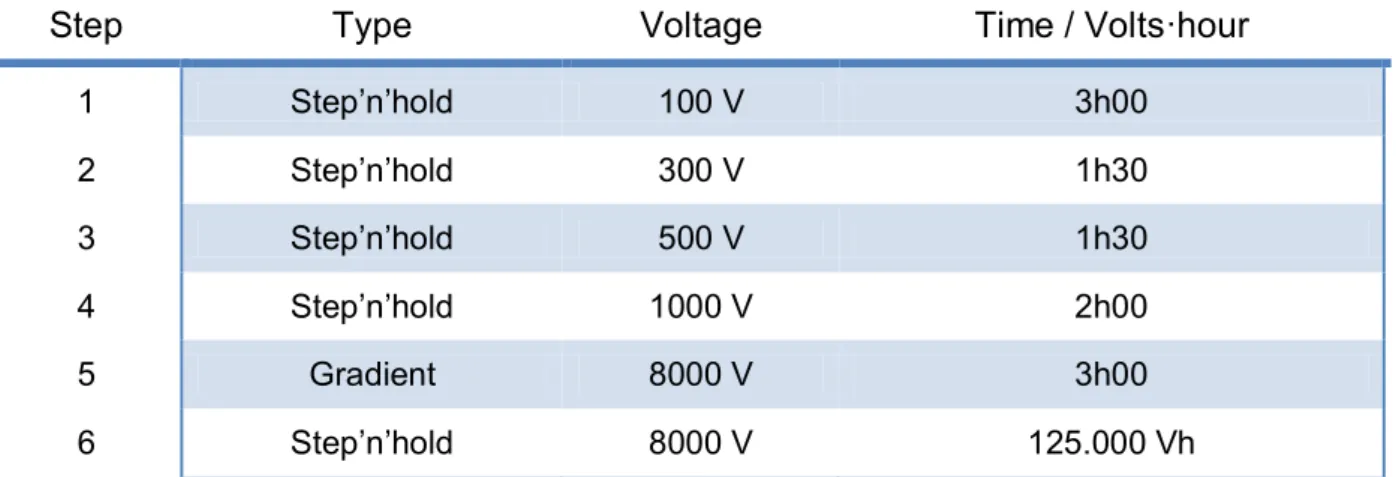
Table 2 – IEF4 setup outline. For a comparison between all the IEF setups, see Appendix III
Step
Type
Voltage
Time / Volts·hour
1 Step’n’hold 100 V 3h00 2 Step’n’hold 300 V 1h30 3 Step’n’hold 500 V 1h30 4 Step’n’hold 1000 V 2h00 5 Gradient 8000 V 3h00 6 Step’n’hold 8000 V 125.000 Vh
1,000 V for 2 hours, a gradient step for 3 hours until 8 000 V were reached and a final step at 8 000 V for 100 000 Vhr with a maximum current of 75 μA. With IEF3 setup there was a clear improvement of the results (see Figure 1.e in the results section). However, at approximately half of the last step, the current reached its limit and the tension applied to the strips started to decrease (see Figure 1.f in the results section). Due to this event, yet other changes to the setup were introduced – paper electrodes were removed at the end of the 500 V step and
14
new ones were applied, and the last step was extended to 125,000 Vhr. As this was the set-up (Table 2) that rendered the best results, it was used for the rest of the work along with an increased total protein load of 800 µg to allow for a better detection of low abundant proteins and increase the number of visible spots in the gels.
Equilibration and second dimension electrophoresis
After IEF, the strips were equilibrated, in order to reduce and alkylate the proteins. Strips were equilibrated in equilibration buffer (6 M urea, 75 mM Tris-HCl pH 8.8, 29.3% (v/v) glyc-erol, 2% (w/v) SDS, 0.002% (w/v) bromophenol blue) with either 64.83 mM DTT or 135.16 mM iodoacetamide during 15 minutes for each stage of the process.
The second dimension was performed, on large slab, 1 mm thick and 12.5% acrylamide gels (Acrylamide 40% 29:1, 1.5 M TrisCl, pH 8.8, 10% (w/v) SDS, 10% (w/v) Ammonium Persul-fate (APS), 10% (v/v) Tetramethylethylenediamine (TEMED)). The second dimension was performed in Ettan™ DALTsix (GE healthcare) with Laemmli electrophoresis buffer (25 mM Tris base, 192 mM glycine, 0.1% (w/v) SDS) and the running conditions were 10 mA/gel, 80 V, 1 W/gel during 1 hour followed by 15 W/gel until the dye front reached the end of the gel. Gels were stained with Coomassie Blue Colloidal (7.84% (w/v) Ammonium sulphate, 1.57% (v/v) Ortho-phosphoric acid, 0.08% (w/v) Coomassie G-250, 2% (v/v) Methanol) (Neuhoff et
al., 1988) for 48h followed by several successive steps of washing with water for 15 minutes.
Gel scan and analysis
The stained gels were scanned with a laser scanner FLA-5100 (FujiFilm) using 635 nm exci-tation laser and LPFR filter using Image Reader FLA 5000 version 1.0 software (FujiFilm) at a resolution of 100 µm. After scanning of all gels, the images were analysed on Progenesis SameSpots™ version 3.3 (build 3420, revision 25059) (NonLinear Dynamics, UK) image analysis program. All gels were aligned to gel number 85541 and then the spots with an area less than or equal to 350 and an average normalized volume of less than or equal to 2000 were removed from the spot analysis. The volume of each spot over the volume of all spots in the gel was used for comparison of all groups by an analysis of variance – ANOVA – test for n observations ( ) was used to assess quantitative differences. All statistically signifi-cant ( ) spots with a power over 0.8 were manually excised, using a disposable scal-pel, for digestion and subsequent identification by Matrix-Assisted Laser Desorption Ioniza-tion-Time Of Flight/Time Of Flight (MALDI-TOF/TOF).
Protein Identification
The excised gel spots were cut into pieces of approximately 1 mm3. The gel pieces were then washed in MiliQ water for 15 minutes followed by several washes in 50% acetonitrile of
15
15 minutes each, until the pieces were completely distained and finally washed in 100% ace-tonitrile for 15 minutes. Disulfide bonds were reduced and alkylated with 10 mM DTT and 50 mM iodoacetamide, respectively. Following reduction and alkylation, gel pieces were com-pletely dehydrated with 100% acetonitrile and dried in a speedvac system (SPD121P, Ther-mo Scientific, USA).
The in-gel digestion was performed by swelling the gel pieces in a 50 mM NH4HCO3
diges-tion buffer containing 6.7 ng/µl sequencing grade modified porcine trypsin (Promega, USA) on ice for 30 minutes, after which, the remaining buffer was removed and discarded and 40 µl of 50 mM NH4HCO3 were added and digestion allowed to proceed at 37oC overnight. After
digestion, the supernatant was acidified by adding formic acid to a final concentration of 5% (v/v).
Prior to identification, tryptic digests were desalted and concentrated on microcolumns. Brief-ly, GELoader tips (Eppendorf, Germany) were packed with Empore C-18 disks (Supelco, Sigma, Portugal), by using a microporator to remove a slice and pushing it through the GE-Loader with a capillary, forming a column of about 1 mm; the column was washed with 20 µl of 50% (v/v) acetonitrile / 5% (v/v) FORMIC ACID and with 20 µl of 5% (v/v) formic acid (Go-bom et al., 1999; Santos et al., 2009). The liquid was forced through the columns by gentle air pressure applied with a syringe. The supernatant resultant from the digestion was loaded onto the column, 5% (v/v) formic acid was used to wash the columns and remove any con-taminants, and the peptides were then eluted with 0.8 μl of α-cyano-4-hydroxycinnamic acid solution (5 mg/ml in 50% (v/v) acetonitrile / 5% (v/v) formic acid; Sigma, Portugal) and direct-ly applied onto the MALDI plate.
Mass Spectra were obtianed using a MALDI-TOF/TOF 4800 plus mass spectrometer (Ap-plied Biosystems, USA). First, MS data was acquired in positive MS reflectron mode using result-independent acquisition mode. Calibration of the instrument was done using PepMix1 calibration mixture (LaserBio Labs, France) prior to the acquisition of any spectra for the samples. Each spectrum is the sum of 800 laser shots with fixed intensity of around 2800-3000 V, with a range of 800 to 4000 m/z. After MS acquisition, the equipment was calibrated in MS/MS mode with Collision Induced Dissociation (CID) assisted by air, with collision ener-gy of 1 kV and with a gas pressure of . Each MS/MS spectrum is the sum of 2000 laser shots with intensity of 4200 V. Raw data was generated by the 4000 Series Explorer Software v3.5.3 (build 1017) (Applied Biosystems) and contaminant m/z peaks resulting from trypsin autodigestion were excluded when generating the peptide mass list used for data-base search.
16
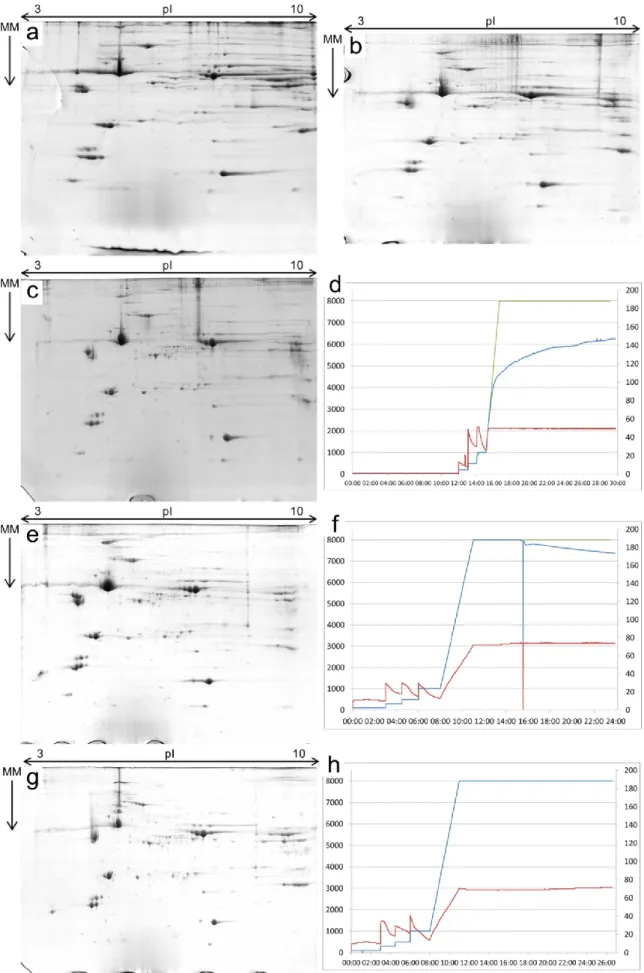
Figure 5 – Protocol optimization for the Two-Dimensional Gel Electrophoresis: comparison of the successive optimization steps. a – gel obtained with the original IEF setup. b – gel resultant from the IEF1 setup. c – gel obtained by using the IEF2 setup. d – plot showing the setpoint voltage and the measured voltage and current values during the IEF2 race. e – gel obtained with the IEF3 setup. f – plot showing the setpoint voltage and the measured voltage and current values during the IEF3 race. g – gel resultant from the IEF4 setup. h - plot showing the setpoint voltage and the measured voltage and current values during the IEF4 race. For image a, the sample used was sample #16, for all others it was sample #49. For images d, f and h, the green line is the set point voltage value, the blue line the measured voltage value and the red line the measured current value. Where the green line is not visible it means the measured voltage equalled the set point val-ue.
17
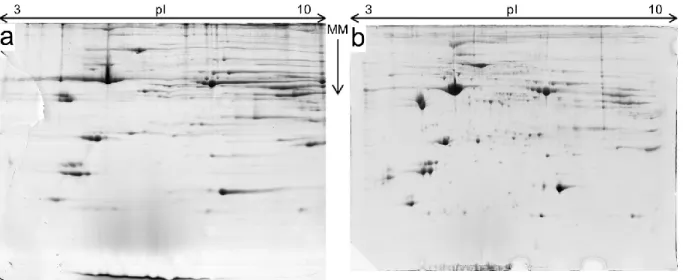
Figure 6 – Comparison of the same sample (#16) subjected to two different IEF setups. a –original IEF setup. b – the fully optimized IEF setup, IEF4. MM – Molecular Mass; the arrow points from the bigger mass towards the smaller mass.
Using the mass list, database queries were performed against one database, SwissProt (version 09/2011 of 21/09/2011), using Mascot search engine (version 2.2.04). The queries were limited by taxonomy to mammals and had defined a peptide tolerance of 50 ppm and a MS/MS tolerance of 0.3 Da. The queries had also defined carbamidomethyl of the cysteines as a fixed modification; oxidation of methionines and deamidation as variable modifications. Another search was performed in the same database but without the deamidation modifica-tion selected. Tryptic peptides with tolerance to one missed cleavage were considered. All protein identification with a score of at least 61 were considered as valid. Mascot search en-gine calculated the significance ( ) for the database used.
Results
Optimization of First-Dimension Electrophoresis
The preliminary results from the two-dimensional gel electrophoresis based on the IEF setup by (Almeida et al., 2010) were deemed unsatisfactory due to the poor focusing of the pro-teins and the large amount of streaking (Figure 5.a), the latter mainly in the alkaline region of the gels. Also, during this first-dimension, the set voltage was never reached (data not shown).
After the first setup optimization – IEF1 – there was a slight improvement on the focusing but there were still areas poorly focused and highly streaked (Figure 5.b). In IEF1, the final volt-age of 8 000 V was still not attained (data not shown). Following IEF2, the final voltvolt-age was still below the expected 8 000 V (Figure 5.d) but there was a noticeable improvement in the focusing of several spots as well as an improvement concerning streaking at the alkaline region (Figure 5.c). With IEF3, making use of the Manifold and paper wicks, there was a pro-
18
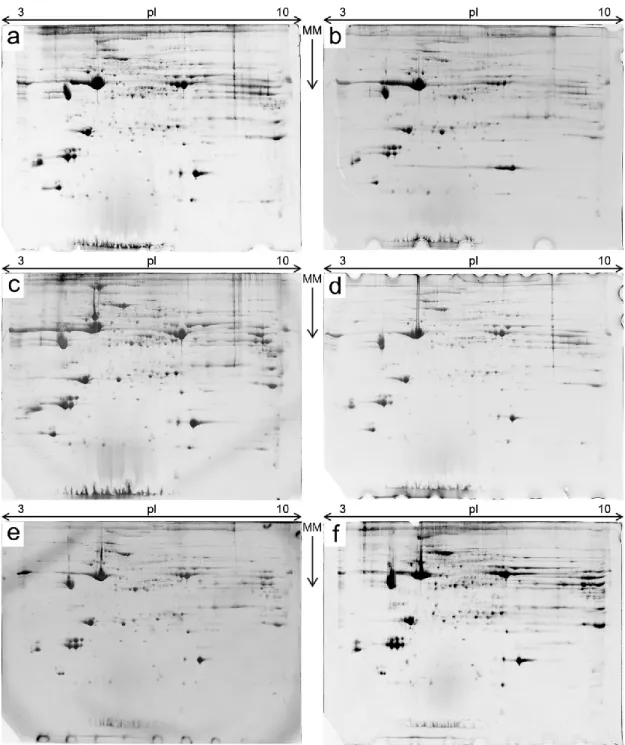
Figure 7 – A total of 24 2-D gels were obtained, four gels per each experimental group. Shown here are representative gels for each experimental group. a –group DaC; b –group DaR; c –group DoC; d: group DoR; e –group MeC; f –group MeR. MM – Molecular Mass; the arrow points from the bigger mass towards the smaller mass.
nounced improvement in the run record, reaching the final voltage of 8 000 V but showing an aberrant run as the current limited the maximum voltage at the middle of the last step (Figure 5.f). This led to yet another change in the IEF setup. The gels from IEF3 show a slight im-provement, mainly a reduction in the streaking at the alkaline region (Figure 5.e), even though the last step did not complete at the 8 000 V. Finally, with IEF4 there is also a reduc-tion in the alkaline region streaking and a small improvement in the focusing of some spots in the centre of the gels (Figure 5.g) . In this setup, paper wicks were replaced with new ones at
19
the end of the 500 V step (step number 3), consequently, there were no abnormalities rec-orded in the IEF4 run (Figure 5.h) and all went accordingly to the protocol.
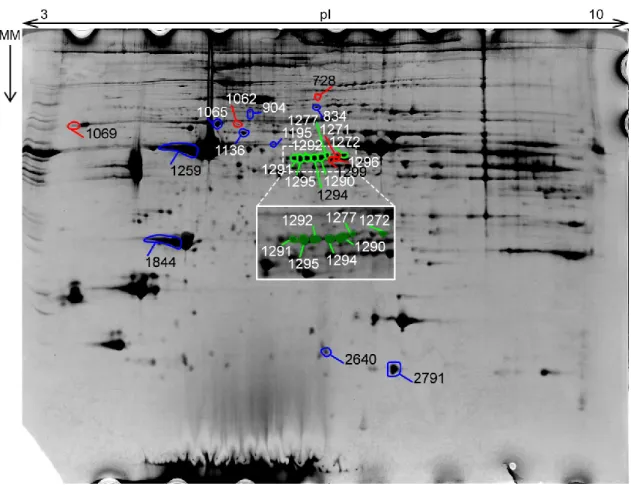
Figure 8 – Gel #85541 was chosen as the reference gel. MM – Molecular Mass; the arrow points from the bigger mass towards the smaller mass. Spots marked in blue were successfully identified (see Table 4); spots marked in red were not identified; spots marked in green were identified as ‘Troponin T’.
To confirm the need for and the success of the optimization of the protocol, a visual compari-son (Figure 6) was made between a gel from the original setup and another gel from the IEF4 setup. As seen, the original IEF setup rendered very streaky gels, with few individual-ized spots (Figure 6.a), while the IEF4 setup rendered far more cleaner gels with a larger
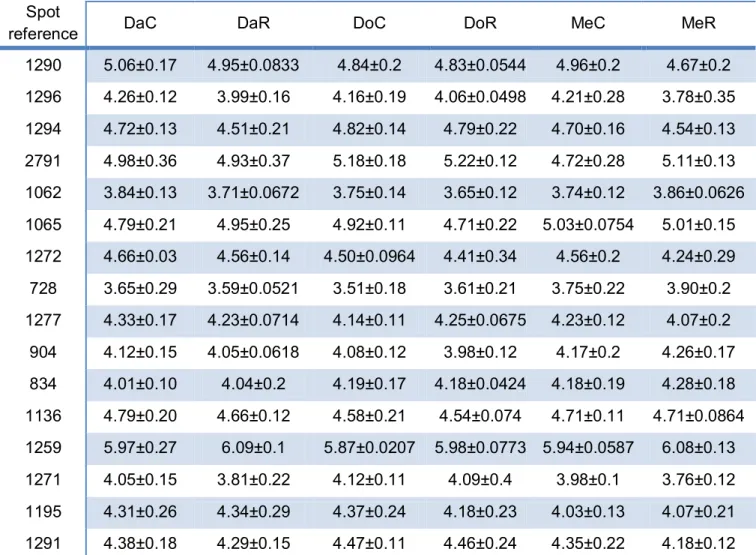
Table 3 – List of normalized volumes of the spots per experimental group. Values presented as the log of the normalized volume ± s.e.m. For each row, the values marked with the same letter are significantly different.
log of Normalized Volume for the six experimental groups Spot
Refence DaC DaR DoC DoR MeC MeR
2640 4.16±0.11 4.08±0.14 4.41±0.17 4.29±0.03 4.32±0.13 4.32±0.09 1299 4.05±0.05 3.70±0.23 4.09±0.23 4.04±0.15 4.07±0.24 3.74±0.16 1844 5.45±0.13 5.68±0.04 5.45±0.12 5.52±0.10 5.53±0.05 5.64±0.13 1292 4.73±0.08 4.64±0.05 4.60±0.10 4.65±0.15 4.56±0.12 4.42±0.18 1295 4.80±0.02 4.67±0.14 4.73±0.05 4.74±0.16 4.70±0.17 4.51±0.05 1069 3.06±0.22 4.00±0.01 4.08±0.78 4.00±0.26 4.83±0.47 4.05±0.23
20
Table 3 – Continued
log of Normalized Volume Spot
reference DaC DaR DoC DoR MeC MeR
1290 5.06±0.17 4.95±0.0833 4.84±0.2 4.83±0.0544 4.96±0.2 4.67±0.2 1296 4.26±0.12 3.99±0.16 4.16±0.19 4.06±0.0498 4.21±0.28 3.78±0.35 1294 4.72±0.13 4.51±0.21 4.82±0.14 4.79±0.22 4.70±0.16 4.54±0.13 2791 4.98±0.36 4.93±0.37 5.18±0.18 5.22±0.12 4.72±0.28 5.11±0.13 1062 3.84±0.13 3.71±0.0672 3.75±0.14 3.65±0.12 3.74±0.12 3.86±0.0626 1065 4.79±0.21 4.95±0.25 4.92±0.11 4.71±0.22 5.03±0.0754 5.01±0.15 1272 4.66±0.03 4.56±0.14 4.50±0.0964 4.41±0.34 4.56±0.2 4.24±0.29 728 3.65±0.29 3.59±0.0521 3.51±0.18 3.61±0.21 3.75±0.22 3.90±0.2 1277 4.33±0.17 4.23±0.0714 4.14±0.11 4.25±0.0675 4.23±0.12 4.07±0.2 904 4.12±0.15 4.05±0.0618 4.08±0.12 3.98±0.12 4.17±0.2 4.26±0.17 834 4.01±0.10 4.04±0.2 4.19±0.17 4.18±0.0424 4.18±0.19 4.28±0.18 1136 4.79±0.20 4.66±0.12 4.58±0.21 4.54±0.074 4.71±0.11 4.71±0.0864 1259 5.97±0.27 6.09±0.1 5.87±0.0207 5.98±0.0773 5.94±0.0587 6.08±0.13 1271 4.05±0.15 3.81±0.22 4.12±0.11 4.09±0.4 3.98±0.1 3.76±0.12 1195 4.31±0.26 4.34±0.29 4.37±0.24 4.18±0.23 4.03±0.13 4.07±0.21 1291 4.38±0.18 4.29±0.15 4.47±0.11 4.46±0.24 4.35±0.22 4.18±0.12
number of individualized spots (Figure 6.b) This is particularly noticeable in the alkaline re-gion of the gels (Figure 6, the right side of each image) and also in the rere-gion of the proteins with low Molecular Mass and acidic pI (Figure 6, the bottom left side of each image). Thus, the rest of the work was based on the IEF4 setup.
Differential Expression Analysis
A total of 24 two-dimension gels were obtained (Figure 7). A reference gel was chosen for the analysis (Figure 8). The software analysis identified a total of 1228 spots in the gels, of which only 78 were statically significant (p < 0.05) and only 40 were actual spots and not artefacts. All the 40 spots were selected for manual spot picking. From these 40 picked spots, 22, which had a statistical power of at least 0.8 (Table 3), were selected for subse-quent analysis.
The software made all the statistical calculations, including the Principal Component Analysis (PCA) which, for this analysis (Figure 9), shows that all samples are quite close together,
21
Figure 9 – Principal Components Analysis of the samples. Dots show the gel data (Purple – DaC; Yellow – DaS; Light blue – DoC; Orange – DoS; Pink – MeC; Blue – MeS), numbers show the spot data. Useful in determining outliers and the real groupings of data, this shows that the gels of the DaC group is quite clustered, while DaR group has one gel outlier, while the other three are also clustered. On the other hand, the gels of the group MeR are loosely distributed and do not form any kind of cluster. MeC group gels have a similar distribution to the respective restricted group. The Dorper groups are quite close to-gether, although the restricted group is more distributed on the plot and the control group is slightly more clustered. On the overall, the DaC, DoC and DaR are more close to each other while the MeR and DaC are more distant from the other groups.
showing a trend towards forming a cluster. None the less, there are visible some outliers in the gels data, particularly in the DoC, DoR and DaR groups.
All the selected 22 spots showed differential expression between at least two experimental groups (Table 3). However, some of these spots denote a trend for a common variation for all groups. For instance (Figure 10), spots #1291, #1290, #1272, #1294 and #2640, all show a decrease from the control group to the restricted group on all breeds while the spot #1259 shows an increase from control to the restricted feed group. On the other hand, some spots have ‘mixed trends’, i.e., they show a decrease or increase from control to restricted feed groups of certain breeds but show an opposite variation for the remaining breed. Examples of this are the spots #1195, #1295 and #1277 (Figure 10). The first has an increase from the control to the restricted feed group in the Merino and Damara breeds and a decrease on the Dorper groups; the latter two spots have an opposite variation: they descrease in the Damara and Merino groups and increase in the Dorper ones.
Protein identification
After trypsin digestion, resulting peptides of 22 spots were loaded onto a MALDI plate and analysed by MALDI-TOF/TOF. The 22 spots selected for identification had a statistical power of at least 0.8.
22
Figure 10 – Plots showing Normalized spot volume in a logarithmic scale. In all these spots there is a difference between the two experimental groups of each breed. Increase/Decrease is always referred to as from the control group to the restricted feed group. a – spot #1295. b – spot #1277. c – spot #2640. d – spot #1272. e – spot #1290. f – spot #1294. g – spot #1195. h – spot #1291. i – spot #1259. a-b – Merino and Damara show a decrease but Dorper has an increase in spot volume. c-f,h – All breeds show a decrease in spot volume. g – Merino and Damara present an increase in spot volume, Dorper decreases. i – All breeds show an increase in spot volume.
#1069, #728, #1062, #1299, #1271 and #1296). All the other plate spots were identified (Table 4). Some proteins were identified more than once, in more than one spot. These pro-teins were two forms of actin, troponin T and phosphoglucomutase-1 (Table 4, rows J2, J5, J8-J10, J12, J14-J18 and J21). Only three identified proteins were of sheep (Ovis aries), the majority were bovine (Bos taurus), having also been identified proteins of pig (Sus scrofa), rabbit (Oryctolagus cuniculus), mouse (Mus musculus) and rat (Rattus norvegicus). Also, the majority of identified proteins belong to a role in the contractile apparatus (32%); the second role with proteins identified it the metabolic role (23%), and, finally, the role with the least
23
number of identified proteins was the structural role (18%) (Figure 11).
The identification of Troponin T was restricted to a few adjacent spots, in the region of inter-mediate-to-higher pI (pH 4 to 6) and high molecular mass of the gels (30 to 35 kDa) (Figure 8, image inlay).
Figure 11 – Distribution of the proteins identified according to general biochemical and physiological roles – structural, metabolism and contractile apparatus.
Discussion and Conclusion
Protocol Optimization: Two-Dimensional Gel Electrophoresis
When starting this work, the behaviour of the sheep muscle samples in 2-D electrophoresis was unknown, but was expected to have a small variation from that of an earlier similar work in rabbits (Almeida et al., 2010). However, the difference these two organisms – rabbit and sheep – must be far too great to allow the use of the same IEF setup. As shown in Figure 5.a, this IEF setup is completely inadequate for the sheep samples. This is even more evi-dent when comparing a gel resulting from the IEF setup by Almeida et al. (2010) with one resulting from the last optimized setup IEF4 (Figure 6).
A conclusion easily taken from observing the runs historic (Figure 5) is that the sheep muscle samples must be heavily contaminated with salts – in the first IEF setups (rabbit, IEF1 and IEF2) the set voltage value was never hit, due to limiting current. On the other hand, IEF3, having already hit the maximum voltage, started to decline in voltage near the half of the plateau step (last step, 8 000 V; Figure 5.f) due to limiting current. A number of reasons can be the cause for this happening: either the salt load of the sample was still too high so that once the paper wicks used quickly saturated with salt, the remaining salts in the solution
18% 23% 32%
24
Table 4 – List of identified proteins by MALDI-TOF/TOF. Proteins with a score greater than 61 were considered identified.
Spot refer-ence
Plate
spot Protein name Species
Accession number Protein MW (kDa) pI Matched pep-tides Sequence coverage (%) Score MS MS/MS
2791 J1 Hemoglobin subunit beta Ovis aries HBB_SHEEP 16.1 6.75 8 4 77 467
2640 J2 Histidine triad
nucleotide-binding protein 1 Bos taurus HINT1_BOVIN 13.9 5.28 1 1 11 87
1844 J3 skeletal muscle isoform Myosin light chain 1/3, Bos taurus MYL1_BOVIN 21.0 4.96 8 5 50 582
1069 J4 - - - - - -
1259 J5 Actin, alpha skeletal muscle Bos taurus ACTS_BOVIN 42.4 5.23 11 8 42 419
1065 J6 Desmin
Sus scrofa DESM_PIG 53.7 5.21
23 10 53
688
Bos taurus DESM_BOVIN 53.6 5.21 687
1136 J7 Cytochrome b-c1 complex
subunit 1, mitochondrial Bos taurus QCR1_BOVIN 53.4 5.94 14 7 34 452
1195 J8 Actin, alpha skeletal muscle Bos taurus ACTS_BOVIN 42.4 5.23 6 1 23 154
1291 J9 Troponin T, fast skeletal
muscle Bos taurus TNNT3_BOVIN 32.1 5.99 7 1 21 183
834 J10 Phosphoglucomutase-1 Bos taurus PGM1_BOVIN 61.8 6.36 16 1 30 286
728 J11 - - - - - -
904 J12 T-complex protein 1 subunit theta Bos taurus TCPQ_BOVIN 60.1 5.4 7 1 14 92
25
Table 4 – Continued. The spots in the MALDI plate that did not render any identification are shown with a ‘-‘. Protein names marked with a * were only identified when the database search was performed without ‘Deamidated’ as a variable modification. Proteins with a score greater than 61 were considered identified.
Spot refer-ence
Plate
spot Protein name Species
Accession number Protein MW (kDa) pI Matched pep-tides Sequence coverage (%) Score MS MS/MS
1295 J14 Troponin T, fast skeletal muscle* Bos taurus TNNT3_BOVIN 32.1 5.99 3 1 11 61
1290 J15
Troponin T, fast skeletal
muscle Bos taurus TNNT3_BOVIN 32.1 5.99
7 3 24 262 1272 J16 2 23 227 1292 J17 8 1 24 173 1294 J18 6 1 21 196 1299 J19 - - - - - - 1271 J20 - - - - - -
1277 J21 Troponin T, fast skeletal muscle Bos taurus TNNT3_BOVIN 32.1 5.99 3 1 14 72
26
started to negatively affect the electrophoretic conditions. Another reason which might ex-plain this is the migration of DTT from the basic end of the strip to the acidic end (Pennington
et al., 2004). This migration can also explain the, still present, streaking in the alkaline region
of the gels (Figures 5, 6, 7 and 8). Further work on proteomic of the gastrocnemius muscle of sheep may involve trying to fully solve, or at least improve slightly, the streaking at the alka-line region.
Differential Expression Analysis
Having found the best setup for running the IEF, it was subsequently used throughout the rest of the work. With this IEF setup, 24 samples were focused and, afterwards, separated in SDS-PAGE gels. After being scanned and inserted into the SameSpots™ software for analy-sis, 1228 spots were detected in the analysis. The statistical calculations were all done by the software, which found that 78 spots were statistically significant with a p-value of less than 0.05. However, of the 78 spots the software detected, only 40 were not artefacts and only 22 had a statistical power of at least 0.8. The power is a measure of how likely is the data to represent a difference if an actual difference exists in the entire population being ana-lysed (“Power Analysis,”), which means that if there is a difference in this 22 spots, it is very likely to be a real difference.
In fact, several spots have observable differences between two or more experimental groups (Figure 10). In these spots, there were variations in the volume of the spot in each gel. For spot #1259, between the control group and restricted feed group of the three breeds, there is always an increase in spot volume from the control to the restricted group (Figure 10.i) (for convenience, from here on, when a decrease or increase between the two groups of one breed is referred to, it is always referring to a variation from the control group to the restricted group), and the difference is always the same for all breeds: about a tenth of unit. It may not seem a lot but seen in logarithmic scale the difference is more striking (Figure 10.i). These spot is a good example of similar variation between the three breeds; there are, however, some spots that do not share the same variation between every breed. A few spots show interesting variations: spots #1295 and #1277 both evidence a decrease in spot volume be-tween control group and restricted feed group of Merino and Damara, but those of Dorper, surprisingly, show an increase in spot volume. It must be said though, that for some of these spots, there could have been a misinterpretation by the analysis software by failing to cor-rectly identify the correct volume of a spot in a gel showing a bigger volume in one gel than in all the other 23. This failure may be derived from a bad gel alignment with the reference. This