INFLUENCE ZONES OF PILE-DRIVE NOISE ON A
RESIDENT POPULATION OF BOTTLENOSE DOLPHINS IN
THE SADO ESTUARY, PORTUGAL
A R Luís IMAR - Institute of Marine Research, Guia Marine Laboratory, Cascais, Portugal
Presente adress: Instituto Superior de Psicologia Aplicada, Unidade de Investigação em Eco-Etologia, Lisboa, Portugal
C Silva IMAR - Institute of Marine Research, Guia Marine Laboratory, Cascais, Portugal
F Andrade Faculty of Sciences, University of Lisbon, Guia Marine Laboratory, Cascais, Portugal
M E dos Santos Instituto Superior de Psicologia Aplicada, Unidade de Investigação em Eco-Etologia, Lisboa, Portugal and Projecto Delfim - Centro Português de Estudo de Mamíferos Marinhos, Lisboa, Portugal
1
INTRODUCTION
The effects of anthropogenic noise on marine mammal populations have been the focus of increasing interest from the scientific community. Noise can affect marine mammals at three levels: causing behavioral reactions, masking acoustic signals and disturbing their echolocation abilities, and also at a physiological level (Würsig[1]).
The potential for effect of a given noise on marine mammal communities can be studied through the estimation of influence zones (Richardson[2]). The estimation of these zones depends on the characteristics of the sounds, on the species involved and on the sound propagation patterns in the study area. To assess and manage the impacts related with anthropogenic noise, a common practice is to use the scale proposed by Richardson[2]: zone of audibility, zone of behavior response, zone of masking and zone of injury.
With a precise propagation model and using accurate criteria to define the zones of influence it is possible to estimate the sound field generated by an anthropogenic activity and assess its effects on cetacean populations.
Pile-drive in aquatic/marine ecosystems is a construction’s activity that generates multiple pulsed broadband sounds (Southall[3].). The sound generated by those activities propagates by air, water and land (Shepherd[4]). Therefore, the characteristics of the event – pile-drive – depend on several factors, such as: length and diameter of the pile, pile material, height of the water column and, also, the specific characteristics of the site (Nedwell[5]; Madsen[6]). Pile-drive in aquatic/marine ecosystem has the potential to cause impact in marine mammal communities, provoking behavior reactions (Nedwell[7]; Tougaard[8]; Tougaard[9]), affecting the individuals’ physiology (Parvin[10]) and causing, in extreme situations, causing death (Nedwell[5]).
The Sado Estuary, is inhabited by a resident population of bottlenose dolphins (Tursiops truncatus), unique in Portugal. The reduced size and the condition of the population, together with the increasing anthropogenic pressure, make for an absolute need to assess and understand the impacts generated by anthropogenic activities, mainly those that correspond to direct intervention in the estuary.
In the present study, a sound propagation model, together with an estimation of acoustic influence zones where used to assess the impact potential of pile-drive activities in the shallow waters of the estuary, and its effects on this bottlenose dolphin’s population.
2
METHODS
The study area, as shown in figure 1, is located in the Sado Estuary, in the West coast of Portugal (38º28’N; 8º50’W). It presents two distinct channels, separated by tidal sand banks that break the surface at low tide. The South channel is larger and deeper (reaching 25m), while the North channel runs along the main industrial area and has depths between 10 and 15m.
The construction site where the pile-driving took place is located on the Tróia Peninsula, in the left bank of Sado Estuary, 6 km upstream from the estuary’s mouth, as shown in figure 1. Its approximate depth is 5m, with a sandy bottom.
Figure 1. Study area, detailed to show the construction site, with piles location (black dots), in two
transects and acoustic stations (orange dots).
2.2
EQUIPMENT AND FIELD PROCEDURES
Recording were conducted during a total of 15 days (from June 27 to 3 July 2007, and from October 4 to October 11 2007). Pilling operations were performed by an impact hammer Menk MHF 5-114 with a force of 140 kNm, using 711-mm steel piles.
Sounds were recorded using a customized system that was calibratred in the laboratory by the hydrophone manufacturer. The hydrophone was a Cetacean Research Technology model C54XRS (sensitivity -165 dB re 1V/μPa, frequency response: 0.008 to 30 kHz (+2/-2dB), 20 to 50 kHz (-5dB), 50 to 203 kHz (-20dB)). The hydrophone was connected by a 15m cable to a data acquisition board IOTECH PersonalDAQ 3005 digital interface (16-bit resolution, up to 1-MHz sampling rate). The digital interface was directly connected to a PC by a USB 2.0 port.
At each site, the hydrophone was lowered to 2m below the surface. For each listening station, five samples were recorded during pile-drive activities, for 10 seconds each. At each site, environmental noise background was sampled with one 20 second recording. All of the recordings were made with a sampling rate of 300 kHz, to allow analysis up to 150 kHz. Given the
hydrophone’s drop of response above this range, no anti-aliasing filtering was considered necessary.
Environmental data (salinity, temperature and depth) were measured at station 12, using a YSI- Environmental Monitoring Systems 600 XLM Multi-Parameter probe. The sound speed profile in the water mass was calculated applying Leroy’s formula (Kinsler[11]), using the environmental data collected.
A set of acoustic signals of bottlenose dolphins (whistles and echolocation click trains) was recorded in station 12, on 12 June 2007, and used as a reference for the vocalizations of these dolphins. The sampling rate was 200 kHz, allowing analysis up to 100 kHz. On this occasion, the maximum distance between vocalizing dolphins (sources) and the hydrophone was estimated at 25 meters. As expected, whistles were mostly narrowband frequency-modulated tones between 3 and 20 kHz, and clicks occurred in trains of short broadband pulses.
2.3
SIGNAL ANALYSIS
The acoustic signals detected by the hydrophone system were transferred, in real time, directly through the A/D board and recorded on the hard drive of the computer as *.wav files, using the acquisition software DaqView 3.0 (fabricante). Analyses were performed using SpectraLAB Pro 4.32 - FFT Spectral Analysis System software (Sound Technology Inc.) with calibration presets adjusted to the hydrophone system, in sound pressure units, with flat frequency response between 146 and 148515 Hz and spectral line resolution of 73.250 Hz. The signals were analyzed using the FFT, with a Hanning smoothing window, an overlap of 50% and a time resolution of 6.83 msec per segment.
In the measurement of the noise levels contained in the pile-driving replicates, a power spectrum was computed for each station, using a logarithmic narrowband scale.
The maximum SPLs were computed (at each station and for the five replicates) using a time wave form integration over a 10 seconds averaging window. Each replicates included 6 impulsive pile-drive strikes and the reverberation produced by each strike.
The maximum SPL value measure within the five replicates was listed for five selected frequencies based on the known hearing system and on the communication abilities of bottlenose dolphins: - 3 kHz, corresponding to results of temporary threshold shift tests (TTS) for the species (Finneran[12]; Carder[13]; Schlundt[14]);
- 10 kHz, the average frequency of bottlenose dolphin whistles (Janik[15]) and the results of TTS for bottlenose dolphins (Carder[13]; Schlundt[14]);
- 20 kHz, the dominant frequency of bottlenose dolphin whistles and the results of TTS tests for bottlenose dolphins (Carder[13]; Schlundt[14]);
- 50 kHz, the maximum hearing sensitivity (Johnson[16]) and the average frequency of bottlenose dolphin low-amplitude clicks (Au[17]; Richardson[2]);
- 75 kHz, the average frequency of bottlenose dolphin high-amplitude clicks and the results of TTS tests for bottlenose dolphins (Carder[13]; Schlundt[14]).
For the global SPL analyze, a power spectrum was computed using only the highest amplitude values, for each frequency bin, in a logarithmic narrowband scale (peak hold option). The averaging time windows used in this analyze had a length of 45 seconds.
The average sound pressure levels at each station were calculated. The average SPL measurements, at each station, were used to calibrate and adjust the sound propagation model.
2.4
SOUND PROPAGATION MODEL
In order to estimate the acoustic field generated by the pile-driving, a sound propagation model was developed based on the Bellhop-Bounce Ray Theory (Porter[18]), and computed using the sound propagation toolbox AcTUP v2.2 (Maggi[19]), in the sotware MatLab 7.5.0 (Mathworks®). For this model the following environmental settings were used:
- bathymetry data for the study area (Instituto Hidrográfico[20]); - sound speed profile in the water mass, previously calculated; - attenuation values for sandy bottoms (Hamilton[21]);
- absorption values, according to frequency (AcTUP v2.2 definitions); - reflection coefficient (AcTUP v2.2 definitions).
For each frequency, the sound pressure levels were calculated as a function of distance using the sonar equation (1):
RL = SL – TL (1)
where RL (received level) here represents the estimated sound pressure levels; SL (source level) here represents the source sound pressure levels, calculated using the received SPL at the closest station (25m) and the corresponding transmission loss; and TL (transmission loss) here represents the transmission loss values given by the sound propagation model.
The estimated sound pressure levels, derived from the model, were compared with the average SPL recorded at each station.
2.5
ZONES OF INFLUENCE
In order to estimate the zones of influence, the received levels predicted by the sound propagation model were used, and the map was plotted using the criteria defined as follows:
An acoustic signal will fall in the zone of audibility depending on the hearing thresholds of the species (Johnson[16]) and the existing environmental noise level, at the selected frequencies. To estimate the zone of behavior response, the criterion proposed by Richardson[2] was used: behavior responses are to be expected whenever the received sound pressure level reaches values 14 dB above the environmental background noise levels.
To estimate the zone of masking, following Erbe[22] an acoustic signal will be considered masked if the noise level introduced by the disturbance is equal or higher than the dolphins’ minimum recognizable signal. The minimum recognizable signals were defined using the recorded vocalizations of the bottlenose dolphins in the Sado Estuary, recorded at c. 25m distance, with environmental background noise.
To predict the zone of hearing damage, the estimated received sound pressure levels were conservatively compared with the lowest values of impulsive sounds that are known to cause temporary threshold shift (TTS) in bottlenose dolphins (Carder[13]; Schlundt[14]).
3
RESULTS
3.1
SIGNAL ANALYSIS
As shown on table 1, maximum sound pressure levels for the selected frequencies were measured at the station closest to the source (station 1). Sound spreading was neither spherical nor cylindrical, not surprisingly given the local depth and substrate.
Sound pressure levels (dB re 1μPa) rms 3 kHz 10 kHz 20 kHz 50 kHz 75 kHz Source (estimated values) 167.77 159.78 155.01 146.40 144.98
Station 1
(25 m from the source) 147 140.36 141.37 127.13 124.83 Station 6
(250 m from the source) 144.06 137.91 133.75 115.14 110.61 Station 11
Table 1 Maximum sound pressure levels at the selected frequencies, as measured at the recording stations.
The results show a logarithmic decrease of SPLs with distance, as the sound pressure levels measured were lowest in the most distant station (station 11- T2), as shown on figure 2. The sound pressure levels also decreased with the increase in frequency.
Pile-drive power spectrum
60 80 100 120 140 160 180 100 1000 10000 100000 1000000 Frequency (Hz) SP L ( d B r e 1u Pa ) r m s 25m 250m 500m
Figure 2. Power spectrum of the sound samples recorded at 25 m (Station 1 -Transect 1 and 2), 250m (Station 6- Transect 1 and 500m (Station 11 – Transect 2) from the pile-drive
activity.
3.2
SOUND PROPAGATION MODEL
According to the sound propagation model, the transmission loss values were similar in the 2 transects analyzed. Furthermore, the transmission loss values did not show relevant variation with depth.
Figure 3. Received sound pressure levels vs distance, for each frequency: curves estimated from the sound propagation model and data values measured at the recording stations.
By comparing the estimated sound pressure levels (derived from the sound propagation model) and the data recorded in situ, it becomes clear that differences are not significant, as shown on figure 3. The model was best fitted for the mid-frequencies (10, 20 and 50 kHz). The differences between the model and the data values where always bellow 10 dB.
3.3
ZONES OF INFLUENCE
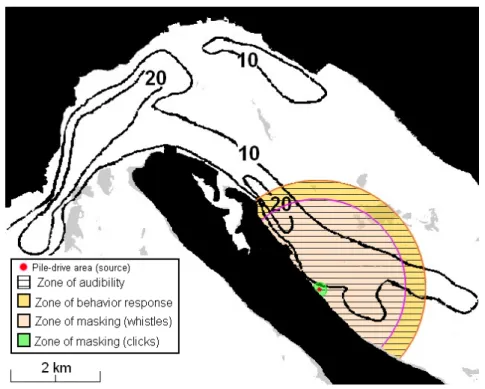
Four zones of influence were estimated from the sound propagation model and are shown on figure 4. Although spreading was not spherical, these zones were plotted in a semi-circular fashion since no significant variation was found between the two perpendicular transects defined for the measurements. Zoning excluded the areas beyond the sand banks, as the relevant attenuation they will surely produce was not measured.
Figure 4. Zones of influence generated by the pile-driving activities studied, in Sado Estuary. According to the model, the zone of audibility corresponds to an area with a radius in excess of 2.5 km, as shown on figure 4. The lower frequencies analyzed (3, 10 and 20 kHz) of the pile-driving noise would be audible within a range of, at least, 5 km around the source. For the higher frequencies, the zone of audibility was smaller, with ranges of 650m for 50 KHz and the 450m for 75 kHz.
The zone of behavior response for the lowest frequency analyzed had an estimated range of at least 2.5 km, shorter for higher frequencies: 1870m for 10 kHz, 1040m for 20 kHz, 235m for 50 kHz and 160m for 75 kHz.
The pile-driving noise would mask the lower components (3 kHz) of whistles for a range of 1970m, and the higher frequencies (10 and 20 kHz) at 260m and 690m, respectively.
The zone of masking for echolocation click trains was very small, as shown on figure 4. The limit of this zone was 185m for 50 kHz, and 135m for 75 kHz.
No zone of hearing damage was detected. The sound pressure levels produced by the pile-drive activities did not reach TTS levels.
4
DISCUSSION
4.1
SIGNAL ANALYSIS
The pile-driving operations in the Sado Estuary produced multiple pulsed broadband signals as described for this type of construction activities (Carlson[23]). Power spectra were similar to those presented by other authors (e.g., Würsig[24]; Nedwell[5]), although the sound pressure levels measured were generally lower. The difference may be due to the relatively narrow piles used and to the characteristics of the bottom sediment (sand), not rock like in some other studies.
4.2
SOUND PROPAGATION MODEL
The use of theoretic models to describe complex physical processes, such as sound propagation from a real-world source, has to be made with caution and the model has to fit real data. In this case, the sound waves were generated along the whole height of the pile, and propagated through underwater, air and ground paths (Shepherd[4]). The sound propagation model estimated the transmission loss levels in a theoretic acoustic field, even though it was based on the characteristics of the study area. Admitedly it was a simplified model, but the results showed a good fit with the acoustic measurements of the pile-driving operations.
In view of the agreement between the model and the collected data, we assume that the model was able to predict the transmission loss in space and that it can be used to estimate the sound pressure levels for higher distances in the study area.
4.3
ZONES OF INFLUENCE
The predicted zone of audibility is relatively extensive, as the lower frequencies should be detected by the animals at a distance of, at least, 2.5 km from the source. Nevertheless, that distance corresponds to a quarter of the distance estimated by David[25]. Zones of audibility depend on the environmental noise levels, as well as on the specific characteristics of the introduced noise. The Sado Estuary has a high environmental noise, due to intense boat traffic and industrial activities (Ferreira[26]). In these conditions, the pile-drive noise would only be audible for shorter distances. However, it must be stressed that a 2.5 km radius corresponds to a large area of the estuary, virtually all the south channel, as shown in figure 4. That area corresponds to a large portion of the dolphins’ habitat, and covers an important feeding area (Harzen[27]) and an important route between the upper estuary and the sea.
The zone of behavior response computed for the lower frequencies (and therefore extensive to the complete sound introduced) covers the same broad range of the estuary – at least 2.5 km. According to several studies (e.g., Malme[28]; Southall[3]), multiple pulsed sounds have the potential to generate intense behavior responses in cetacean groups. For the lower frequencies, the sound propagates further, so those frequency bands may be especially important in behavior disruption (Todd[29]; Ketten[30]). Behavior responses such as changes in the travel speed and avoidance of impact areas have been described for pile-driving activities (Wursig[24]). A visual census carried out during the construction yielded a low number of bottlenose dolphin observations in the study area (IMAR[31]). Man-made noise may create multiple, although temporary, disturbing stimuli that can cause the avoidance of an important travel route and feeding area, and therefore representing a relevant reduction of available habitat. Those impacts can affect vital activities such as feeding, which may have significant biological consequences (Committee on Characterizing Biologically Significant Marine Mammal Behavior & National Research Council[32]).
For the lower frequencies of dolphin whistles, the zone of masking ranged up to a 1970m distance from the source. Due to the specific characteristics of the pile-driving noise (multiple pulsed sounds), these vocalizations tend to be intermittently masked (Madsen[6]; David[25]); nevertheless, the constant disruption could have had negative impacts. Whistles have an important role in the social cohesion and in mother-calf communication processes (Janik[15]). The interruption or/and distraction generated by the pile-drive noise could have caused the separation between mothers and dependent calves, and could also have disrupted social activities. In this case, the zone of masking for whistles was vast, and corresponded to the south channel area, along a distance of
about 4 km. Since 56 of the 106 piles were driven during the breeding season, the pile-driving noise may have influenced the survival rates of the calves, possibly causing a biological significant impact on the population.
As for the masking of clicks, the estimated zone corresponds to an area similar to the one described by David[25]. Masking of echolocation click trains is unlikely, not only because the estimated area was small (185m) but also due to the specific broadband characteristics of the clicks. Echolocation clicks are directional and a man-made noise must come from the same direction of the click to be able to mask the signal (Au[17]; Richardson[2]). Furthermore, bottlenose dolphins have the ability to change the dominant frequency of echolocation clicks in order to avoid masking from other acoustic signals (Au[17]).
No zone of hearing damage was predicted; pile-drive pulses did not reach the necessary sound pressure levels.
5
CONCLUSION
The underwater noise generated by pile-driving operations in the Sado estuary was measured and found comparable, although lower, to that obtained in other studies. This study showed the applicability of a sound propagation model in the estimation of noise influence zones, using noise measurements and the bottlenose dolphin acoustic characteristics.
Special concern arose from the fact that the construction site is within an important feeding and traveling area for a protected dolphin population.
Due to the short duration of the construction period and the specific characteristics of the noise (multiple pulsed signals), any effects would likely have been temporary. Anyway, long-term effects cannot be determined in such short studies, but the very low number of individuals in this population and their high dependence on the study area could aggravate any impacts.
6
ACKNOWLEDGEMENTS
The authors would like to thank Maria Vale, Tanya Silveira an Isabel Silva for their assistance with the field data collection in the field. The Luso-American Foundation provided financial support to one of the authors (ARL), through the Luíz Saldanha/Ken Tenore Scholarship Program, which enabled a study period at the Woods Hole Oceanographic Institute. Also, Peter Tyack and Stacy DeRuiter provided important support and valuable comments during the data analysis and
discussion. The present study was conducted under the Environmental Impact Assessment of the “Marina e Novo Cais dos ferries do Troiaresort” project and was supported through a grant from the Institute of Marine Research (IMAR). Paulo Fonseca made useful comments to a previous version of this manuscript, and we are very grateful to two anonymous reviewers.
7
REFERENCES
1. B. Würsig and P.G.H. Evans, Cetaceans and humans: influences of noise. In: Evans, P.G.H & Raga, Juan Antonio (Eds), Marine Mammals: Biology and Conservation. Kluwer Academic Pub., pp. 565-589. (2001).
2. Richardson, W.J. Marine mammals hearing. In: Richardson, W.J., Greene Jr., C.R., Malme, C.I., Thomson, D.H. (Eds.), Marine Mammals and Noise. Academic Press, San Diego, pp. 205-240. (1995).
3. B.L. Southall, A.E. Bowles, J.J. Finneran, R.L. Gentry, C.R. Greene Jr., D. Kastak, D.R. Ketten, J.H. Miller, P.E. Nachtigall, W.J. Richardson, J.A. Thomas and P. L. Tyack. Marine mammal noise exposure criteria: initial scientific recommendations. Aquatic mammals, 33 (4), 411-509. (2007).
4. B. Shepherd, C. Weir, C. Golightly and T. Holt Undewater noise impact assessment on marine mammals and fish during pile driving of proposed round 2 offshore wind farms in the Thames Estuary. CORE Limited Report EOR0523, pp. 1-146. (2006).
5. J.D. Nedwell, J. Langworthy and D. Howell. Assessment of subsea acoustic noise and vibration from offshore wind turbines and its impact on marine life. Cowrie Rep 544 R0424. (2003)
6. P.T. Madsen, M. Wahlberg, J. Tougaard, K. Lucke and P. Tyack. Wind turbine underwater noise and marine mammals: implications of current knowledge and data needs. Marine
Ecology Progress Series, 309, 279-295. (2006).
7. J. Nedwell and D. Howell. A review of offshore windfarm related underwater noise sources. Cowrie Rep 544 R0308. (2004)
8. J. Tougaard, J. Carstensen, O.D. Henriksen, H. Skov and J. Teilmann. Short-term effects of
the construction of wind turbines on harbour porpoises at Horns Reef. Technical report to
Techwise A/S, HME/362–02662. Hedeselskabet, Roskilde. (2003).
9. J.,Tougaard, J. Carstensen, J. Teilmann and N.I. Bech Effects on the Nysted Offshore wind
farm on harbour porpoises. Technical Report to Energi E2 A/S. NERI, Roskilde. (2005).
10. Parvin S. J. and J R Nedwell. Underwater noise survey during impact pilling to construct the
Burbo Bank offshore windfarm. COWRIE report No. 726R0103. (2006).
11. L. E. Kinsler, A. R. Frey, A. B. Coppens and J. V. Sanders. The fundamentals of acoustics.
Journal of Sound and Vibration, Volume 89 (4), p. 593-593. (1982).
12. J. J. Finneran, D. A. Carder, C. E. Schlund and S. H. Ridway. Temporary threshold shift (TTS) in bottlenose dolphins (Tursiops truncatus) exposed to mid-frequency tones. Journal
of the Acoustical Society of America 118, 2696–2705. (2005).
13. D. A. Carder, J. J. Finneran, S. H. Ridgway and C. E. Schlundt Masked temporary threshold shift for impulsive sounds in dolphins and white whales Journal of the Acoustical Society of
America, 106, (4), 2252. (1999).
14. C. E. Schlundt, J. J. Finneran, D. A. Carder and S. H. Ridgway Temporary shift in masked hearing thresholds of bottlenose dolphins, Tursiops truncatus, and white whales,
Delphinapterus leucas, after exposure to intense tones. Journal of the Acoustical Society of America, 107, 3496–3508. (2000).
15. V. Janik. Source levels and the estimated active space of bottlenose dolphin (Tursiops
truncatus) whistles in the Moray Firth, Scotland. Journal of comparative physiology. A, 186, 673-680. (2000).
16. C. S. Johnson. Sound detection thresholds in marine mammals. In W. N. Tavolga (eds.).
Marine Bioacoustics. Pergamon, Oxford. Pp 247–260. (1967).
17. W. W. L. Au. The Sonar of Dolphins. New York, Springer-Verlag. 297 pp. (1993).
18. M.B. Porter and H.P. Bucker Gaussian beam tracing for computing ocean acoustic fields.
Journal of the Acoustical Society of America, 82, 1349-1359. (1987).
19. A. Maggi and A. Duncan Underwater Acoustic Propagation Modelling Software - AcTUP
V2.2L. Center for Marine Science and Technology, Curtin University of Technology,
Australia. (2005).
20. Instituto Hidrográfico. Carta naútica nº 26308 – Barra e porto de Setúbal. Escala 1:15 000. (February 1995).
21. E.L. Hamilton. Compressional wave attenuation in marine sediments. Geophysics, 37, (4), 620-646. (1972).
22. C. Erbe & D.M. Farmer. A software model to estimate zones of impact on marine mammals around anthropogenic noise. Journal of the Acoustical Society of America, 108 (3), 1327-1331. (2000).
23. J. T. Carlson and M. A. Weiland. Dynamic pile driving and pile driving underwater impulsive
sound. Technical report WA-RD 673.1. Battelle. 138 pp. (2007).
24. B., Würsig, C.R. Greene Jr. and T.A. Jefferson Development of an air bubble curtain to reduce underwater noise of percussive piling. Marine Environmental Research, 49, 79-93. (2000).
25. J.A. David. Likely sensitivity of bottlenose dolphins to pile-driving noise. Water and
Environment Journal, 20, 48-54. (2006).
26. A. J. Ferreira, J. L. Coelho and M. E. dos Santos. Underwater noise in Sado Estuary. Acta
acustica, 82 (1), 255. (1996)
27. S. Harzen. Habitat use by the bottlenose dolphin (Tursiops truncatus) in the Sado Estuary, Portugal. Aquatic Mammals, 24, 117-128. (1998).
28. C. I. Malme, P. R. Miles, P. Tyack, C. W. Clark and J. E. Bird Investigation of the potential effects of underwater noise from petroleum industry activities on feeding humpback whale behavior. BBN Laboratories Inc., Cambridge, MA for U.S. Minerals Management Service, Anchorage, AK,BBN Report 5851, NTIS PB86-218385. (1985).
29. S. Todd, P. Stevick, J. Lien, F. Marques and D. R. Ketten Behavioral Effects of Exposure to Underwater Explosions in Humpback Whales (Megaptera novaeangliae). Canadian Journal of Zoology, 74, 1661-1672. (1996).
30. D. R. Ketten, Marine mammal auditory systems: a summary of audiometric and anatomical
data and implications for underwater acoustic impacts. International Whaling Commission,
Scientific Committee (IWC-SC) Report, Annex K: Standing Working Group on Environmental Concerns Report. (May 2004).
31. IMAR – Instituto do Mar. Relatório do Programa de Monitorização Ambiental do Troiaresort. (December 2007)
32. Committee on Characterizing Biologically Significant Marine Mammal Behavior. Marine
mammal populations and noise: determining when noise causes biologically significant effects. The National Academies Press, Washington, DC. 126 pp. (2005).