University of Porto, School of Economics and Management
Audit Fees, Non-Audit Fees and Corporate
Performance
Cinderela Andrade dos Santos
Dissertation of Master in Finance and Taxation
Supervised by:
António de Melo da Costa Cerqueira
Elísio Fernando Moreira Brandão
ABSTRACT
Our research examines whether audit and non-audit fees are associated with firm performance, so, we study this relationship taking into account the impact of operating and corporate governance characteristics on firm performance. The sample in study is non-financial firms companies in S&P 500 covering the period from 2002 to 2014. We find a significant negative relationship between corporate performance and non-audit fees. This suggests that the increase (decrease) in corporate performance is related to the decrease (increase) in non-audit fees. The results add to the growing body of literature documenting relations between firm performance and remuneration of audit services, as well as to our understanding of the determinants of corporate performance. Furthermore, this study highlights the possible matter of providing non-audit services jointly with audit services, confine the functions of an auditor and consequently compromise the independence, that ultimately decrease the firm performance.
CONTENTS
1. INTRODUCTION ...1
2. LITERATURE REVIEW AND HYPOTHESES DEVELOPMENT...3
2.1 AUDIT FEES... 3
2.2 NON-AUDIT FEES ... 4
2.3 AUDIT FEES AND CORPORATE PERFORMANCE... 4
3. METHODOLOGY...7
3.1 SAMPLE ... 7 3.2 VARIABLES ... 74. ECONOMETRIC MODEL ...10
5. RESULTS ...12
5.1 UNIVARIATE RESULTS ... 12 5.2 MULTIVARIATE RESULTS ... 176. CONCLUSION...20
APPENDIX...22
REFERENCES...25
TABLE INDEX
Table 1 - Definitions of the Variables ...9
Table 2 - Descriptive Statistics for Variables ...14
Table 3 - Correlation Matrix of Equation (1) ...15
Table 4 - Equation (1) estimation results...19
1. INTRODUCTION
Since the Enron and WorldCom cases, corporate governance and corporate performance has become a topic of interest for research in the audit area. The literature that focuses on the analyses of the relationship between corporate governance and audit fees is significant (Wu, 2012; Carcello et al., 2002; Cohen and Wright, 2002); however the nature of the services provided by auditors was not taken into account. The fees charged by audit companies to clients result from audit services, due to the expression of an opinion on the fairness with which they present, in all material respects, financial position, results of operations, and its cash flows in conformity with generally accepted accounting principles (Auditing Standard No. 1), or consulting services, the designated non-audit services.On the matter of audit services, Moutinho et al. (2012) found a negative relationship between the audit fees and the operational performance using a sample from 2000 to 2008. As regards the two matters, Martinez et al. (2014) conducted a study that links the audit and the non-audit fees with the Tobin’s Q, but this is a specific investigation with a sample of listed companies from Brazil.
This study investigates the relationship between the audit and non-audit fees and the corporate performance. Our research aims at answering two main questions: Firstly, whether and how both audit and non-audit fees are related on corporate performance? Secondly, if our results are in line with those previous literature that analyse the impact of financial and corporate governance factors on firm performance?
Our research takes into account the corporate performance determinants studied by other investigators. The previous literature studied the relationship between corporate performance and corporate governance, for example (Bhagat and Bolton, 2008; Yang and Zhao, 2014). This relationship is taken into account in the analysis of the corporate performance determinants, including some corporate governance characteristics in the estimation method, such as the board’s dimension, the share held by the employees and the number of non-executive directors on the board. In this study, two theories are tested. The first hypothesis state that operational performance is related to the audit fees paid by the
companies. The second hypothesis relates negatively the firm performance with the non-audit fees. To test these hypotheses, a model is developed using panel data. The sample used is from the listed companies in the index S&P 500 contained in Thomson Datastream. 416 non-financial firms are considered in the sample covering the period from 2002 to 2014, using the least squares estimator.
We contribute to the growing body of literature in this area in a number of ways. First, the study provides an understanding review on the various determinants of corporate performance that have been mentioned on the literature, for example (Bhagat and Bolton, 2008; Lee, 2009; Yang and Zhao, 2014). Second, our sample of non-financial listed companies includes an extensive period of time, from 2002 to 2014. Additionally, the study used four corporate performance measures, return on assets, return on equity, earning power and Tobin’s Q, to provide a clear evidence of relationship of the firm performance and audit and non-audit fees, for legislators and board of directors understand this relationship for the decision making. Finally, results add to the literature evidence of relationship between corporate performance mechanism and the fees paid to audit firms, supporting further investigations on the independence of auditors.
We find significant negative relation between performance measures and non-audit fees. The results show that the decrease in corporate performance is related to the increase in non-audit fees. In other words, paying high fees to the auditor perform consulting services lead to reduce corporate performance. Furthermore, this study supports the belief that provides non-audit services confine the functions of the auditor and endanger the independence of auditor.
The remainder of this paper is organized as follows. Section two reviews the literature on audit fees, non-audit fees and corporate performance and the hypotheses are developed. Section three describes the data and variables used on the equation. Section four presents the econometric model and section five presents and discusses the descriptive statistics, the correlations and the regression results, such us the findings. Finally, section seven concludes the paper and discusses the implications and limitations of this study.
2. LITERATURE REVIEW AND HYPOTHESES DEVELOPMENT
This section contains a brief literature review about the audit fees determinants, the factors that influence corporate performance, as well as the investigations connecting audit fees to a measure of firm performance. First, the previous studies on audit fees, non-audit fees and firm performance are exposed, so then we developed the hypotheses of this research.
2.1 AUDIT FEES
Since Simunic (1980) developed a model to determine the process by which the audit fees are determined, other researches arose in the context of determining audit fees. The empirical studies on the audit fees subject showed that audited characteristics, as well as the companies’ dimension and the sector complexity have a positive influence on the audit fees (Simunic, 1980; Carcello et al., 2002; Choi et al., 2010). It is predicted that large companies have more data to examine, so the fees charged to large companies are higher (Choi et al., 2010). The results of Hay et al. (2013) meta-analysis on audit fees also confirms the positive association of the size’s company, measured by total assets, and complexity with fees. These results taken together indicate that size is an extremely critical explanatory variable for any model of audit fees. The audited client's various attributes that influence the level of work and the respective fee, which the literature investigates, are the client's dimension, complexity, risk, profitability, governance, internal control and leverage (Hay, 2013; Simunic, 1980; Choi et al., 2010).
If an auditor wishes to decrease the issuing risk of a positive opinion when there are materially relevant distortions in the client's financial statements, he generally acts on the nature, the extension and timing of the audit procedures, which naturally influence the fee charged (Moutinho et al., 2012).
Prior research also demonstrates a link between corporate governance and audit fees. Carcello et al. (2002) studied the relation between the board of directors and audit fees characteristics and found a positive relationship between audit fees and the board of directors’ independence, competence and diligence. The auditors tend to assign a low risk
inherent and risk control to companies characterized with a better internal corporate performance (Carcello et al. 2002). To governance performance factors affect the audit plan, the auditor should first recognize and properly assess the corporate governance and second properly use this evidence to develop the audit plan. The literature indicates that when governance structure is strong, the auditor can reduce the sample size and then reduce the extent of an expensive substantive analysis (Cohen et al. 2002).
2.2 NON-AUDIT FEES
Provide non-audit services jointly with audit service create a potential perception that auditors might compromise their independence in order to maintain their clients and the respective income (Haniffa et al., 2011; Hay et al., 2006). Although the belief that non-audit services damage the non-auditor’s independence exists, Hay (2006) found no evidence that audit fees and fees for non-audit services are jointly determined. On the contrary, Whisenant et al. (2003) document empirically that audit fees and non-audit fees are simultaneously determined. They find a positive relationship between audit fees and non-audit fees when OLS is used, but they find no relationship when they use a simultaneous specification of the fee model applying two-stage least squares. However, little empirical evidence from research studies has been available, there isn’t a consistent relationship between audit and non-audit fees.
2.3 AUDIT FEES AND CORPORATE PERFORMANCE
Lee (2009) examined the corporate performance and defined the determinants, such as, the general economic conditions, firm’s size, market share, sales growth, inventory management, debt management, capital intensity, advertising expense and research and development intensity. In a similar vein, Yang and Zhao (2014) determinate as variables to controlling for operating and governance characteristics that influence Tobin’s Q: firm size, measured by the natural logarithm of total book assets, current-year return on assets, one-year and two-one-year lagged ROA, growth opportunities, measured by sales growth over the past three years, capital structure, measured by long term debt over total book assets, risk measured by annualized daily stock return volatility, board size, percent of non-executive
directors on the board, percent of director and officer ownership and percent of institutional ownership. Finally, empirical evidence shows that corporate governance is one important determinant of corporate performance (Lee, 2009; Yang and Zhao, 2014; Bhagat and Bolton, 2008).
On the basis of the preceding discussion, issues arise as to the extent to which fees paid to auditors relates to corporate performance. There is still little empirical evidence about the relationship between audit fees and corporate performance. Moutinho et al. (2012), Martinez et al. (2014) and Stanley (2011) showed a significantly influence of spending on audit services in the firm performance. Moutinho et al. (2012) developed a model to test this relationship, using a sample of 6000 observations of listed companies and verified a negative relationship between these subjects. On the other hand, Martinez et al. (2014) made the distinction between audit and non-audit fees to connect them with a firm value measure and concluded that when the companies spend more in the audit services the Tobin's Q increases. In contrast, Stanley (2011) provides evidence of an inverse relationship between unexplained audit fees and operating performance. In light of above-mentioned statements, this paper proposes the following hypothesis:
Hypothesis 1: Firm performance is negatively associated with audit fees.
Prior research also demonstrates a link between non-audit fees and corporate performance. Authors argue that providing non-audit services jointly with audit services could compromise auditor’s independence in order to maintain their clients (Haniffa et al., 2011; Hay et al., 2006). In other words, the dependency can lead auditors to be less willing to stand up to customers’ pressure to keep customers who pay big non-audit fees. Accordingly, there is documentation that the independence of auditors for audit and non-audit activities is related to the performance of firms, which in turn, influences firm value (Hay et al. 2006; Stanley, 2011; Martinez et al. 2014). In this context, Martinez et al. (2014) provided evidence that high relative spending on non-audit services by the independent auditor has a strongly negative effect on stock price. Stanley also finds a significant inverse relation between audit fees and the one-year-ahead change in a measure
of clients' operating performance.
Thus, it is expected that non-audit services negatively affect firm performance by confining the functions of an independence auditor, a situation that would lead ultimately to lower financial performance of firms (Daoud et al., 2015). Based on the statement aforementioned, this study suggests the following hypothesis:
Hypothesis 2: Firm performance is negatively associated with non-audit fees. An equation is estimated in order to test the hypotheses 1 and 2, using panel data.
3. METHODOLOGY
This section is dedicated to the variables definition and database to test the hypotheses under study. Firstly, the sampling process is described. Secondly, the model's variables and the database will be defined. Finally, econometric model is presented, as well as predictions of coefficients signs.
3.1 SAMPLE
The database used to obtain the financial information is the Thomson DataStream. This database is available in FEP and contains an extensive history of financial information. The study considers a sample of companies in the American stock market index, Standard and Poor 500. The index is designed to measure performance of the broad economy through changes in the aggregate market value of 500 stocks representing all major industries. Data was collected for the companies that constitute the index, excluding financial companies, due to their different financial structure from the non-financial companies and differences in regulatory environment. We use the industry profile from
Datastream to identify the financial companies in the initial sample that should be
excluded. The final sample, after excluding financial companies, is composed by 416 companies and covers the period from 2002 to 2014, resulting in 5408 observations. Table 5 in the appendix section provides the industry profile of sample firms using Industrial grouping (INDM) available in DataStream. The major industries in the industry profile are consumption electricity and exploration & production.
3.2 VARIABLES
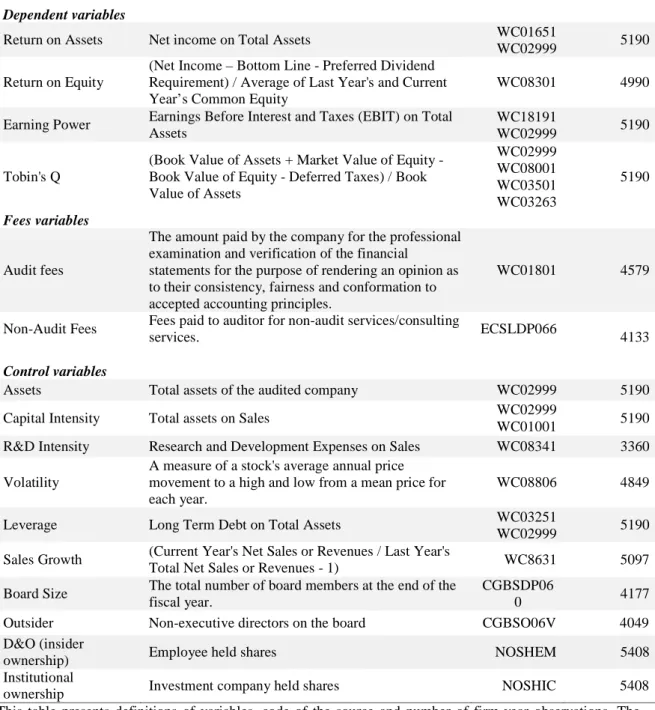
The variable selection comes from the corporate performance determinants addressed in the literature review section. The variables definitions and data source are presented in Table 1.
To test the hypotheses formulated about the relationship between audit and non-audit fees and corporate performance, several performance and firm value measures were used: Tobin’s Q (Bhagat and Bolton, 2008; Gompers et al, 2003; Yang and Zhao, 2014), return
on equity (Sami et al., 2011; Yang and Zhao, 2014), return on assets (Lee, 2009; Yang and Zhao, 2014) and earning power (Bhagat and Bolton, 2008).
The control variables that are used in the estimated model to control operating factors are firm size (Lee, 2009; Yang and Zhao, 2014), sales growth (Lee, 2009; Yang and Zhao, 2014), R&D Intensity (Lee, 2009; Yang and Zhao, 2014), capital intensity (Lee, 2009), leverage (Bhagat and Bolton, 2008; Yang and Zhao, 2014) and volatility/risk (Bhagat and Bolton, 2008; Yang and Zhao, 2014). In the literature, corporate governance was identified as a determinant of corporate performance and to capture the effect of the corporate characteristics, we used some control variables.
We also control for the potential effects of corporate governance characteristics on firm performance with the following variables: board size (Bhagat and Bolton, 2008; Yang and Zhao, 2014), outsiders (Yang and Zhao, 2014; Bhagat and Bolton, 2008; Carcello et al,. 2002), director and officer ownership (Yang and Zhao, 2014) and institutional ownership (Yang and Zhao, 2014).
Table 1 - Definitions of the Variables
Variables Definition DS Code
Number of observations
Dependent variables
Return on Assets Net income on Total Assets WC01651
WC02999 5190 Return on Equity
(Net Income – Bottom Line - Preferred Dividend Requirement) / Average of Last Year's and Current Year’s Common Equity
WC08301 4990 Earning Power Earnings Before Interest and Taxes (EBIT) on Total
Assets
WC18191
WC02999 5190
Tobin's Q
(Book Value of Assets + Market Value of Equity -Book Value of Equity - Deferred Taxes) / -Book Value of Assets WC02999 WC08001 WC03501 WC03263 5190 Fees variables Audit fees
The amount paid by the company for the professional examination and verification of the financial
statements for the purpose of rendering an opinion as to their consistency, fairness and conformation to accepted accounting principles.
WC01801 4579
Non-Audit Fees Fees paid to auditor for non-audit services/consulting
services. ECSLDP066 4133
Control variables
Assets Total assets of the audited company WC02999 5190 Capital Intensity Total assets on Sales WC02999
WC01001 5190 R&D Intensity Research and Development Expenses on Sales WC08341 3360 Volatility
A measure of a stock's average annual price movement to a high and low from a mean price for each year.
WC08806 4849 Leverage Long Term Debt on Total Assets WC03251
WC02999 5190 Sales Growth (Current Year's Net Sales or Revenues / Last Year's
Total Net Sales or Revenues - 1) WC8631 5097 Board Size The total number of board members at the end of the
fiscal year.
CGBSDP06
0 4177
Outsider Non-executive directors on the board CGBSO06V 4049 D&O (insider
ownership) Employee held shares NOSHEM 5408
Institutional
ownership Investment company held shares NOSHIC 5408 This table presents definitions of variables, code of the source and number of firm-year observations. The source of the data is Thomson Datastream and the sample period is from 2002 to 2014.
4. ECONOMETRIC MODEL
To test the hypotheses between performance measures, audit fees and non-audit fees, we estimate the following equation, using panel data:
Tobin’s_Q / EP / ROA / ROE = β0 + β1(Audit_Fees/Assets) + β2(Non-Audit_Fees/Assets) +
β3ln(Assets) + β4Capital_Intensity + β5R&D_Intensity + β6Leverage + β7Volatility +
β8Sales_Growth + β9Board_Size + β10Outsider + β11D&O + β12Inst_Ownership + ε Equation (1)
Where β0 indicates the intercept, ε represents the error term and the other variables were constructed as described in table 1. The estimation method is the Least Square and we used fixed-effect models.
The model is based on models which determine the firm performance (for example, Yang and Zhao, 2014; Martinez et. al., 2014; Lee, 209).
The hypotheses are confirmed if there is a significant negative relationship between audit fees and firm performance measures and also a significant negative relationship between non-audit fees and performance measures. This means that the higher the expense in the consulting services or audit services the lower the operating performance and firm value.
Total assets are related with company’s dimension, which is linked to the corporate performance. In addition the largest companies obtain efficiency gains related with the economies of scale, as well as a strong position in the market (Lee, 2009). Thus,assets have a positive effect on corporate performance. However, the findings of Anderson and Reeb (2003), evidence from the S&P 500, predict that firm performance is negatively and significantly related to firm size and stock return volatility. There is therefore no consistent previous evidence on this subject.
The expected sign in the capital intensity coefficient is positive. This variable is considered an entry barrier, which increase the power of the company in the market and
consequently higher profitability because the competition entrance in the market is difficult. (Lee, 2009; Moutinho et al. 2012)
An increase sales growth drives the revenue of a company, so the coefficient sign for sales growth is expected to be positive (Lee, 2009).R&D involves specialized inputs that are unique to the investing firm and add value to the company, driving the firm’s results ((Lee, 2009; Yang and Zhao, 2014).However other studies about various industries come to different conclusions. Thus, a sign for R&D intensity is not predicted.
The impact of leverage, which is represented by the long term debt on assets, on performance depends on measurement variable. In operational performance, regarding the earning power and ROA, a negative sign is expected when a high level of leverage exists (Lee, 2009; Yang and Zhao, 2014). When the performance is measured by ROE, the leverage's impact on the performance depends on the relative values of Earning power and the cost of debt (Sami et al., 2011; Yang and Zhao, 2014). Regarding the Tobin’s Q, is negatively related to long term debt (Anderson and Reeb, 2003).
Director and officer ownership have a negative impact on the corporate performance, because firms with restrictions to shareholders’ power are less well governed and managers are more able to pursue their individual interests. On the other hand, institutional ownership has a positive effect on corporate performance (Yang and Zhao, 2014). Outside directors, as representative of shareholders, have a particularly strong incentive to prevent and detect opportunistic reporting behaviour by management (Carcello et al., 2002). So, given poor firm performance, the probability of disciplinary management turnover is positively correlated with board independence, as the findings of Bhagat and Bolton (2008). The potential effects of board size are also taken into account (Yang and Zhao, 2014; Bhagat and Bolton, 2008).
5. RESULTS
In this section the results are presented. Initially, the data is analysed through descriptive statistics and correlations. Lastly, estimation results are reported and analysed and the conclusions are drawn.
5.1 UNIVARIATE RESULTS
In this section, the data is analysed using descriptive statistics and correlations.
In the univariate analysis, the outliers were analysed through histograms in order to analyse the presence of outliers. After examination of extreme outliers in the audit fees, some values were found to have measurement errors, so these values were manually corrected. To mitigate the problem of extreme outliers of other variables, we winsorize all operating variables at the 1% level at both tails except for volatility and corporate governance variables. For other variables no extreme outliers were identified.
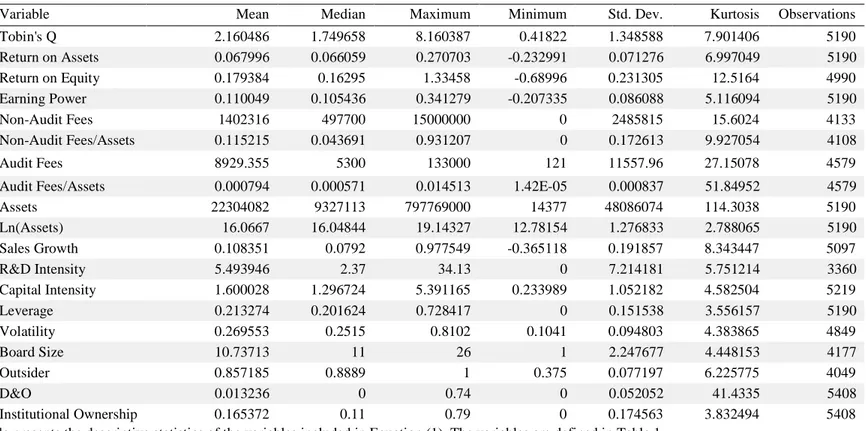
Table 2 provides the descriptive statistics for the dependent and independent variables used in the model. The firm size in terms of total assets have a mean of 22.304.082 respectively. In terms of debt, the sample firms have an average debt ratio with mean of about 0.20, approximately. The mean of the audit fees paid to audit firm are 8.929,35 and the audit fees are 1.402.316, which indicate that firms generally pay more for non-audit services than for non-audit services. Sales increase by an average of approximately 11 percent. The firm value measure, Tobin’s Q, have mean value of approximately 2.16, and the three performance measures, ROA, ROE and EP, have mean values of approximately 6.8 percent, 17.9 percent and 11 percent, respectively.
For the board characteristics, in terms of outsiders, the mean of independent members on the board of directors is 86 percent and ranges between 0.38 and 100 percent. The average of board size is 11 and ranges between 1 and 26. The average proportion of institutional ownership, investment company held shares, is 11% and it ranges from 0 percent to 79 percent.
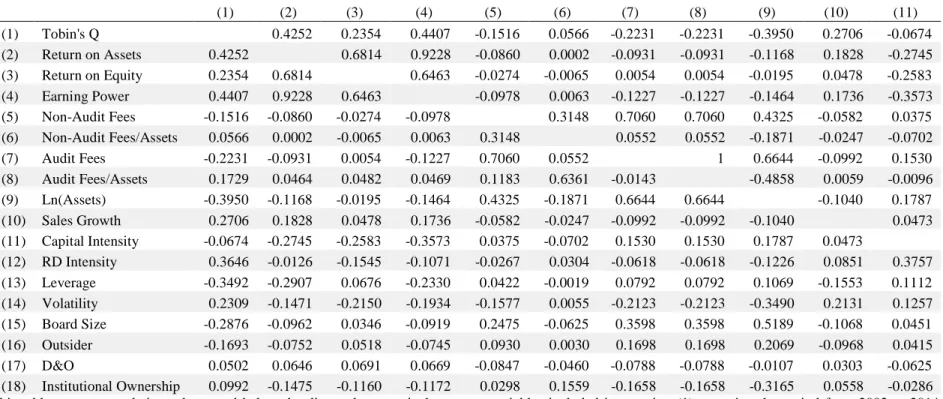
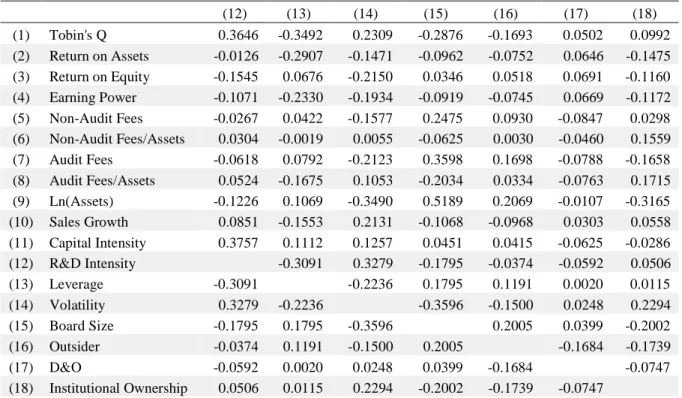
there is a strong correlation between the performance measures, Earning Power, Return on Assets and Return on Equity. The variable Ln(assets) is correlated with the audit fees, around 0.66. According to the literature, size is indicated as a determinant in audit fee models, so the inclusion of audit fees might biased results because the variable contains effects of size, already considered in Ln(assets). Thus, according to the literature, a ratio of audit fees on assets was already included in equation (1). The relationship between performance measures and the fees paid to the audit firm is weak. In addition, none of the variables had correlations greater than 0.70.
Table 2 - Descriptive Statistics for Variables
Variable Mean Median Maximum Minimum Std. Dev. Kurtosis Observations Tobin's Q 2.160486 1.749658 8.160387 0.41822 1.348588 7.901406 5190 Return on Assets 0.067996 0.066059 0.270703 -0.232991 0.071276 6.997049 5190 Return on Equity 0.179384 0.16295 1.33458 -0.68996 0.231305 12.5164 4990 Earning Power 0.110049 0.105436 0.341279 -0.207335 0.086088 5.116094 5190 Non-Audit Fees 1402316 497700 15000000 0 2485815 15.6024 4133 Non-Audit Fees/Assets 0.115215 0.043691 0.931207 0 0.172613 9.927054 4108 Audit Fees 8929.355 5300 133000 121 11557.96 27.15078 4579
Audit Fees/Assets 0.000794 0.000571 0.014513 1.42E-05 0.000837 51.84952 4579 Assets 22304082 9327113 797769000 14377 48086074 114.3038 5190 Ln(Assets) 16.0667 16.04844 19.14327 12.78154 1.276833 2.788065 5190 Sales Growth 0.108351 0.0792 0.977549 -0.365118 0.191857 8.343447 5097 R&D Intensity 5.493946 2.37 34.13 0 7.214181 5.751214 3360 Capital Intensity 1.600028 1.296724 5.391165 0.233989 1.052182 4.582504 5219 Leverage 0.213274 0.201624 0.728417 0 0.151538 3.556157 5190 Volatility 0.269553 0.2515 0.8102 0.1041 0.094803 4.383865 4849 Board Size 10.73713 11 26 1 2.247677 4.448153 4177 Outsider 0.857185 0.8889 1 0.375 0.077197 6.225775 4049 D&O 0.013236 0 0.74 0 0.052052 41.4335 5408 Institutional Ownership 0.165372 0.11 0.79 0 0.174563 3.832494 5408 This table presents the descriptive statistics of the variables included in Equation (1). The variables are defined in Table 1.
Table 3 - Correlation Matrix of Equation (1) (1) (2) (3) (4) (5) (6) (7) (8) (9) (10) (11) (1) Tobin's Q 0.4252 0.2354 0.4407 -0.1516 0.0566 -0.2231 -0.2231 -0.3950 0.2706 -0.0674 (2) Return on Assets 0.4252 0.6814 0.9228 -0.0860 0.0002 -0.0931 -0.0931 -0.1168 0.1828 -0.2745 (3) Return on Equity 0.2354 0.6814 0.6463 -0.0274 -0.0065 0.0054 0.0054 -0.0195 0.0478 -0.2583 (4) Earning Power 0.4407 0.9228 0.6463 -0.0978 0.0063 -0.1227 -0.1227 -0.1464 0.1736 -0.3573 (5) Non-Audit Fees -0.1516 -0.0860 -0.0274 -0.0978 0.3148 0.7060 0.7060 0.4325 -0.0582 0.0375 (6) Non-Audit Fees/Assets 0.0566 0.0002 -0.0065 0.0063 0.3148 0.0552 0.0552 -0.1871 -0.0247 -0.0702 (7) Audit Fees -0.2231 -0.0931 0.0054 -0.1227 0.7060 0.0552 1 0.6644 -0.0992 0.1530 (8) Audit Fees/Assets 0.1729 0.0464 0.0482 0.0469 0.1183 0.6361 -0.0143 -0.4858 0.0059 -0.0096 (9) Ln(Assets) -0.3950 -0.1168 -0.0195 -0.1464 0.4325 -0.1871 0.6644 0.6644 -0.1040 0.1787 (10) Sales Growth 0.2706 0.1828 0.0478 0.1736 -0.0582 -0.0247 -0.0992 -0.0992 -0.1040 0.0473 (11) Capital Intensity -0.0674 -0.2745 -0.2583 -0.3573 0.0375 -0.0702 0.1530 0.1530 0.1787 0.0473 (12) RD Intensity 0.3646 -0.0126 -0.1545 -0.1071 -0.0267 0.0304 -0.0618 -0.0618 -0.1226 0.0851 0.3757 (13) Leverage -0.3492 -0.2907 0.0676 -0.2330 0.0422 -0.0019 0.0792 0.0792 0.1069 -0.1553 0.1112 (14) Volatility 0.2309 -0.1471 -0.2150 -0.1934 -0.1577 0.0055 -0.2123 -0.2123 -0.3490 0.2131 0.1257 (15) Board Size -0.2876 -0.0962 0.0346 -0.0919 0.2475 -0.0625 0.3598 0.3598 0.5189 -0.1068 0.0451 (16) Outsider -0.1693 -0.0752 0.0518 -0.0745 0.0930 0.0030 0.1698 0.1698 0.2069 -0.0968 0.0415 (17) D&O 0.0502 0.0646 0.0691 0.0669 -0.0847 -0.0460 -0.0788 -0.0788 -0.0107 0.0303 -0.0625 (18) Institutional Ownership 0.0992 -0.1475 -0.1160 -0.1172 0.0298 0.1559 -0.1658 -0.1658 -0.3165 0.0558 -0.0286 This table reports correlations above and below the diagonal, respectively, among variables included in equation (1), covering the period from 2002 to 2014. Consult table 1 for variable definitions.
Table 3 (continued) - Correlation Matrix of Equation (1) (12) (13) (14) (15) (16) (17) (18) (1) Tobin's Q 0.3646 -0.3492 0.2309 -0.2876 -0.1693 0.0502 0.0992 (2) Return on Assets -0.0126 -0.2907 -0.1471 -0.0962 -0.0752 0.0646 -0.1475 (3) Return on Equity -0.1545 0.0676 -0.2150 0.0346 0.0518 0.0691 -0.1160 (4) Earning Power -0.1071 -0.2330 -0.1934 -0.0919 -0.0745 0.0669 -0.1172 (5) Non-Audit Fees -0.0267 0.0422 -0.1577 0.2475 0.0930 -0.0847 0.0298 (6) Non-Audit Fees/Assets 0.0304 -0.0019 0.0055 -0.0625 0.0030 -0.0460 0.1559 (7) Audit Fees -0.0618 0.0792 -0.2123 0.3598 0.1698 -0.0788 -0.1658 (8) Audit Fees/Assets 0.0524 -0.1675 0.1053 -0.2034 0.0334 -0.0763 0.1715 (9) Ln(Assets) -0.1226 0.1069 -0.3490 0.5189 0.2069 -0.0107 -0.3165 (10) Sales Growth 0.0851 -0.1553 0.2131 -0.1068 -0.0968 0.0303 0.0558 (11) Capital Intensity 0.3757 0.1112 0.1257 0.0451 0.0415 -0.0625 -0.0286 (12) R&D Intensity -0.3091 0.3279 -0.1795 -0.0374 -0.0592 0.0506 (13) Leverage -0.3091 -0.2236 0.1795 0.1191 0.0020 0.0115 (14) Volatility 0.3279 -0.2236 -0.3596 -0.1500 0.0248 0.2294 (15) Board Size -0.1795 0.1795 -0.3596 0.2005 0.0399 -0.2002 (16) Outsider -0.0374 0.1191 -0.1500 0.2005 -0.1684 -0.1739 (17) D&O -0.0592 0.0020 0.0248 0.0399 -0.1684 -0.0747 (18) Institutional Ownership 0.0506 0.0115 0.2294 -0.2002 -0.1739 -0.0747
5.2 MULTIVARIATE RESULTS
The estimation method is the Least squares. Cross-section and period fixed effects were included in all estimations, to account for individual firm and year effects. Equation (1) was regressed on each of the corporate performance and value measures.
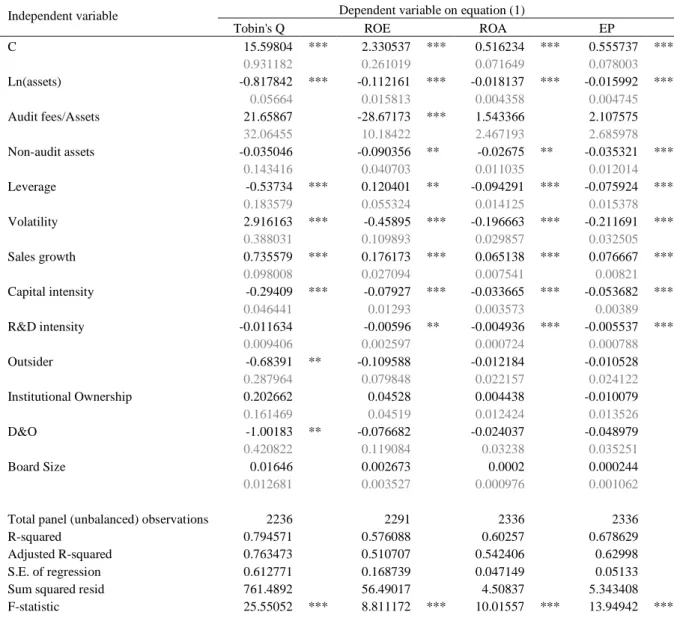
The results of equation 1 are presented in Table 4. Overall, the F-stat for the model is statistically significant at 0.01 levels and the adjusted R2 of the equations with dependent variables Tobin’s Q, ROE, ROA and EP is 0.76, 0.51, 0.54 and 0.63, respectively, which indicates that the model have explanatory power. Standard-deviations are presented below the coefficients.
The coefficient of non-audit fees is statistically significant at 0.05 level for ROA and ROE models and at 0.01 level for earning power model. The negative coefficient of non-audit fees variable confirm the negative influence of non-non-audit fees on corporate performance, however there is no significant impact on the firm value measure, Tobin’s Q. In other words, these results have no evidence that remuneration of the audit firm is associated with firm value measurement. Nevertheless, the non-audit fees on assets have a significantly negative impact on firm performance; this means that the decrease in corporate performance is related to the increase in non-audit fees. Therefore, the hypothesis 2 is confirmed. This finding is consistent with Martinez et al. (2014) and Daoud et al. (2015), who argue that non-audit services negatively affect firm performance by confining the functions of an independence auditor, a situation that would lead ultimately to lower financial performance of firms.
The hypothesis 1 states that audit fees are negatively related with firm performance, but the audit fees variable is just statistically significant in one performance measure, Return on equity. This results show a negative impact of audit fees on return on equity, meaning that increases in return on equity are associated with decreases in audit fees. Although, there is no significant evidence in others firm performance measures.
sales growth, the volatility, the firm size and long term debt. Sales Growth has a statistically significant positive impact at 0.01 level in all performance measures and firm value measure, consistent with Lee (2009). The firm dimension and volatility, except on Tobin’s Q model, are statistically significant at 1% level in all performance measures and firm value, having a negative impact on firm performance, such as the findings of Anderson and Reeb (2003). There is also a negative relationship between the capital intensity and R&D intensity with the firm performance measures. Long term debt has a negative impact on ROA, EP and Tobin’s Q as predicted by Lee (2009), Sami et. al (2011), Yang and Zhao (2014) and Anderson and Reeb (2003).
Accordingly with the findings of Yang and Zhao (2014), director and officer ownership is negatively related with firm value, however this variable is just statistically significant for Tobin’s Q model. The number of non-executive directors on the board, outsiders, is also negatively related to firm value, supporting the argue of Carcello (2002) that outsiders prevent and detect opportunistic reporting by managers. All others control variables for corporate governance are not statistically significant in this model’s results.
Table 4 - Equation (1) estimation results
Independent variable Dependent variable on equation (1)
Tobin's Q ROE ROA EP
C 15.59804 *** 2.330537 *** 0.516234 *** 0.555737 *** 0.931182 0.261019 0.071649 0.078003 Ln(assets) -0.817842 *** -0.112161 *** -0.018137 *** -0.015992 *** 0.05664 0.015813 0.004358 0.004745 Audit fees/Assets 21.65867 -28.67173 *** 1.543366 2.107575 32.06455 10.18422 2.467193 2.685978 Non-audit assets -0.035046 -0.090356 ** -0.02675 ** -0.035321 *** 0.143416 0.040703 0.011035 0.012014 Leverage -0.53734 *** 0.120401 ** -0.094291 *** -0.075924 *** 0.183579 0.055324 0.014125 0.015378 Volatility 2.916163 *** -0.45895 *** -0.196663 *** -0.211691 *** 0.388031 0.109893 0.029857 0.032505 Sales growth 0.735579 *** 0.176173 *** 0.065138 *** 0.076667 *** 0.098008 0.027094 0.007541 0.00821 Capital intensity -0.29409 *** -0.07927 *** -0.033665 *** -0.053682 *** 0.046441 0.01293 0.003573 0.00389 R&D intensity -0.011634 -0.00596 ** -0.004936 *** -0.005537 *** 0.009406 0.002597 0.000724 0.000788 Outsider -0.68391 ** -0.109588 -0.012184 -0.010528 0.287964 0.079848 0.022157 0.024122 Institutional Ownership 0.202662 0.04528 0.004438 -0.010079 0.161469 0.04519 0.012424 0.013526 D&O -1.00183 ** -0.076682 -0.024037 -0.048979 0.420822 0.119084 0.03238 0.035251 Board Size 0.01646 0.002673 0.0002 0.000244 0.012681 0.003527 0.000976 0.001062
Total panel (unbalanced) observations 2236 2291 2336 2336
R-squared 0.794571 0.576088 0.60257 0.678629
Adjusted R-squared 0.763473 0.510707 0.542406 0.62998
S.E. of regression 0.612771 0.168739 0.047149 0.05133
Sum squared resid 761.4892 56.49017 4.50837 5.343408
F-statistic 25.55052 *** 8.811172 *** 10.01557 *** 13.94942 ***
This table reports Least Squares estimation results of equation (1). *, ** and *** denote coefficients significance at 10%, 5% and 1% levels, respectively. Values below coefficients are corresponding standard-deviations. The panel sample covers the period from 2002 to 2014. Variable are defined in table 1.
6. CONCLUSION
The study provides an understanding review on the relationship between the audit and non-audit fees and corporate performance considering several performance and firm value measures. The objective of this investigation is to conclude about the impact of audit fees and non-audit fees on corporate performance, using as the variable dependent ROE, ROA, EP and Tobin’s Q. For this purpose, we used fixed-effect models with a sample of 416 non-financial firms that compose the index S&P 500 covering the period from 2002 to 2014.
Our estimations results provide empirical evidence on the relationship between corporate performance, non-audit fees and audit fees. Previous studies find that audit fees have a significant effect in performance measures, but in our study, using data of companies in S&P 500, the audit fees variable have just a significantly negative relationship in return on equity. This predicts that increases in return on equity are connected with decreases in audit fees. No evidence has been found on the relationship between EP, ROA or Tobin’s Q and audit fees. However, the results of the study provide evidence of a significant negative relationship between performance measures and non-audit fees. The hypothesis confirmed affirms that decreases in operating performance are related with increases in non-audit fees. In other words, paying the auditor to perform consulting services has a negative impact on operating performance.
The above findings have important implications for researchers, policy makers, managers and members of the boards in the selection of an audit firm or other firm to contract consulting services. The findings of a negative relationship between non-audit fees and firm performance support the belief that provide non-audit services confine the functions of the auditor and can endanger the independence of auditor. Above all, this research highlight for the potential perception that auditors might compromise their independence in order to maintain their clients when providing non-audit services jointly with audit service.
do not control for endogeneity of corporate governance, despite the weak results on these variables. Another limitation lies with the possible misspecification of the study’s model. Individual firm and year effects play an important role on the global significance of results. Despite these methodological limitations, we believe that the results are informative and bring important implications.
Further investigation on this matter would be interesting in a number of ways. Due to data availability, it is not possible to classify non-audit services into recurring and nonrecurring services. Future studies can investigate the nature of the non-audit services and looking for clear evidence of the relationship with the independence of auditors and how it could compromise independence.
APPENDIX
Table 5 - Industry profile of sample firms
2002 2003 2004 2005 2006 2007 2008 2009 2010 2011 2012 2013 2014
Industry profile\number of
firms 416 416 416 416 416 416 416 416 416 416 416 416 416
Computer Hardware 1.44% 1.44% 1.44% 1.44% 1.44% 1.44% 1.44% 1.44% 1.44% 1.44% 1.44% 1.44% 1.44%
Software 2.64% 2.64% 2.64% 2.64% 2.64% 2.64% 2.64% 2.64% 2.64% 2.64% 2.64% 2.64% 2.64%
Integrated Oil & Gas 1.44% 1.44% 1.44% 1.44% 1.44% 1.44% 1.44% 1.44% 1.44% 1.44% 1.44% 1.44% 1.44%
Divers. Industrials 1.44% 1.44% 1.44% 1.44% 1.44% 1.44% 1.44% 1.44% 1.44% 1.44% 1.44% 1.44% 1.44%
Pharmaceuticals 3.36% 3.36% 3.36% 3.36% 3.36% 3.36% 3.36% 3.36% 3.36% 3.36% 3.36% 3.36% 3.36%
Broadline Retailers 1.20% 1.20% 1.20% 1.20% 1.20% 1.20% 1.20% 1.20% 1.20% 1.20% 1.20% 1.20% 1.20%
Nondur.Household Prod 0.48% 0.48% 0.48% 0.48% 0.48% 0.48% 0.48% 0.48% 0.48% 0.48% 0.48% 0.48% 0.48%
Fixed Line Telecom. 1.20% 1.20% 1.20% 1.20% 1.20% 1.20% 1.20% 1.20% 1.20% 1.20% 1.20% 1.20% 1.20%
Broadcast & Entertain 2.88% 2.88% 2.88% 2.88% 2.88% 2.88% 2.88% 2.88% 2.88% 2.88% 2.88% 2.88% 2.88%
Internet 1.20% 1.20% 1.20% 1.20% 1.20% 1.20% 1.20% 1.20% 1.20% 1.20% 1.20% 1.20% 1.20% Soft Drinks 1.20% 1.20% 1.20% 1.20% 1.20% 1.20% 1.20% 1.20% 1.20% 1.20% 1.20% 1.20% 1.20% Computer Services 1.20% 1.20% 1.20% 1.20% 1.20% 1.20% 1.20% 1.20% 1.20% 1.20% 1.20% 1.20% 1.20% Biotechnology 1.68% 1.68% 1.68% 1.68% 1.68% 1.68% 1.68% 1.68% 1.68% 1.68% 1.68% 1.68% 1.68% Semiconductors 4.32% 4.32% 4.32% 4.32% 4.32% 4.32% 4.32% 4.32% 4.32% 4.32% 4.32% 4.32% 4.32% Telecom. Equipment 1.68% 1.68% 1.68% 1.68% 1.68% 1.68% 1.68% 1.68% 1.68% 1.68% 1.68% 1.68% 1.68%
Home Improvement Ret. 0.48% 0.48% 0.48% 0.48% 0.48% 0.48% 0.48% 0.48% 0.48% 0.48% 0.48% 0.48% 0.48%
Tobacco 0.72% 0.72% 0.72% 0.72% 0.72% 0.72% 0.72% 0.72% 0.72% 0.72% 0.72% 0.72% 0.72%
Drug Retailers 1.20% 1.20% 1.20% 1.20% 1.20% 1.20% 1.20% 1.20% 1.20% 1.20% 1.20% 1.20% 1.20%
Oil Equip. & Services 2.64% 2.64% 2.64% 2.64% 2.64% 2.64% 2.64% 2.64% 2.64% 2.64% 2.64% 2.64% 2.64%
Medical Equipment 2.16% 2.16% 2.16% 2.16% 2.16% 2.16% 2.16% 2.16% 2.16% 2.16% 2.16% 2.16% 2.16%
Healthcare Providers 2.88% 2.88% 2.88% 2.88% 2.88% 2.88% 2.88% 2.88% 2.88% 2.88% 2.88% 2.88% 2.88%
Aerospace 1.20% 1.20% 1.20% 1.20% 1.20% 1.20% 1.20% 1.20% 1.20% 1.20% 1.20% 1.20% 1.20%
Pipelines 0.72% 0.72% 0.72% 0.72% 0.72% 0.72% 0.72% 0.72% 0.72% 0.72% 0.72% 0.72% 0.72% Spec.Consumer Service 0.48% 0.48% 0.48% 0.48% 0.48% 0.48% 0.48% 0.48% 0.48% 0.48% 0.48% 0.48% 0.48% Footwear 0.24% 0.24% 0.24% 0.24% 0.24% 0.24% 0.24% 0.24% 0.24% 0.24% 0.24% 0.24% 0.24% Delivery Services 0.72% 0.72% 0.72% 0.72% 0.72% 0.72% 0.72% 0.72% 0.72% 0.72% 0.72% 0.72% 0.72% Commodity Chemicals 1.68% 1.68% 1.68% 1.68% 1.68% 1.68% 1.68% 1.68% 1.68% 1.68% 1.68% 1.68% 1.68% Food Products 3.60% 3.60% 3.60% 3.60% 3.60% 3.60% 3.60% 3.60% 3.60% 3.60% 3.60% 3.60% 3.60% Automobiles 0.72% 0.72% 0.72% 0.72% 0.72% 0.72% 0.72% 0.72% 0.72% 0.72% 0.72% 0.72% 0.72% Business Support Svs. 1.44% 1.44% 1.44% 1.44% 1.44% 1.44% 1.44% 1.44% 1.44% 1.44% 1.44% 1.44% 1.44% Personal Products 0.72% 0.72% 0.72% 0.72% 0.72% 0.72% 0.72% 0.72% 0.72% 0.72% 0.72% 0.72% 0.72% Defense 1.44% 1.44% 1.44% 1.44% 1.44% 1.44% 1.44% 1.44% 1.44% 1.44% 1.44% 1.44% 1.44% Computer Hardware 1.44% 1.44% 1.44% 1.20% 1.44% 1.44% 1.20% 1.20% 1.20% 1.20% 1.20% 1.20% 1.20%
Exploration & Prod. 4.56% 4.56% 4.56% 4.56% 4.56% 4.56% 4.56% 4.56% 4.56% 4.56% 4.56% 4.56% 4.56%
Travel & Tourism 0.72% 0.72% 0.72% 0.72% 0.72% 0.72% 0.72% 0.72% 0.72% 0.72% 0.72% 0.72% 0.72%
Retail REITs 1.20% 1.20% 1.20% 1.20% 1.20% 1.20% 1.20% 1.20% 1.20% 1.20% 1.20% 1.20% 1.20%
Comm. Vehicles,Trucks 1.20% 1.20% 1.20% 1.20% 1.20% 1.20% 1.20% 1.20% 1.20% 1.20% 1.20% 1.20% 1.20%
Farm Fish Plantation 0.24% 0.24% 0.24% 0.24% 0.24% 0.24% 0.24% 0.24% 0.24% 0.24% 0.24% 0.24% 0.24%
Multiutilities 1.68% 1.68% 1.68% 1.68% 1.68% 1.68% 1.68% 1.68% 1.68% 1.68% 1.68% 1.68% 1.68% Con. Electricity 5.04% 5.04% 5.04% 5.04% 5.04% 5.04% 5.04% 5.04% 5.04% 5.04% 5.04% 5.04% 5.04% Apparel Retailers 1.68% 1.68% 1.68% 1.68% 1.68% 1.68% 1.68% 1.68% 1.68% 1.68% 1.68% 1.68% 1.68% Electronic Equipment 1.20% 1.20% 1.20% 1.20% 1.20% 1.20% 1.20% 1.20% 1.20% 1.20% 1.20% 1.20% 1.20% Specialty Retailers 3.36% 3.36% 3.36% 3.36% 3.36% 3.36% 3.36% 3.36% 3.36% 3.36% 3.36% 3.36% 3.36% Medical Supplies 1.68% 1.68% 1.68% 1.68% 1.68% 1.68% 1.68% 1.68% 1.68% 1.68% 1.68% 1.68% 1.68% Auto Parts 0.96% 0.96% 0.96% 0.96% 0.96% 0.96% 0.96% 0.96% 0.96% 0.96% 0.96% 0.96% 0.96% Industrial Machinery 1.92% 1.92% 1.92% 1.92% 1.92% 1.92% 1.92% 1.92% 1.92% 1.92% 1.92% 1.92% 1.92% Specialty Chemicals 1.92% 1.92% 1.92% 1.92% 1.92% 1.92% 1.92% 1.92% 1.92% 1.92% 1.92% 1.92% 1.92% Airlines 0.72% 0.72% 0.72% 0.72% 0.72% 0.72% 0.72% 0.72% 0.72% 0.72% 0.72% 0.72% 0.72% Food Retail,Wholesale 0.72% 0.72% 0.72% 0.72% 0.72% 0.72% 0.72% 0.72% 0.72% 0.72% 0.72% 0.72% 0.72% Recreational Services 0.48% 0.48% 0.48% 0.48% 0.48% 0.48% 0.48% 0.48% 0.48% 0.48% 0.48% 0.48% 0.48%
Clothing & Accessory 1.92% 1.92% 1.92% 1.92% 1.92% 1.92% 1.92% 1.92% 1.92% 1.92% 1.92% 1.92% 1.92%
Nonferrous Metals 0.24% 0.24% 0.24% 0.24% 0.24% 0.24% 0.24% 0.24% 0.24% 0.24% 0.24% 0.24% 0.24%
Hotels 0.72% 0.72% 0.72% 0.72% 0.72% 0.72% 0.72% 0.72% 0.72% 0.72% 0.72% 0.72% 0.72%
Paper 0.24% 0.24% 0.24% 0.24% 0.24% 0.24% 0.24% 0.24% 0.24% 0.24% 0.24% 0.24% 0.24%
Waste, Disposal Svs. 0.72% 0.72% 0.72% 0.72% 0.72% 0.72% 0.72% 0.72% 0.72% 0.72% 0.72% 0.72% 0.72%
Distillers & Vintners 0.48% 0.48% 0.48% 0.48% 0.48% 0.48% 0.48% 0.48% 0.48% 0.48% 0.48% 0.48% 0.48%
Toys 0.72% 0.72% 0.72% 0.72% 0.72% 0.72% 0.72% 0.72% 0.72% 0.72% 0.72% 0.72% 0.72%
Dur. Household Prod. 0.96% 0.96% 0.96% 0.96% 0.96% 0.96% 0.96% 0.96% 0.96% 0.96% 0.96% 0.96% 0.96%
Aluminum 0.24% 0.24% 0.24% 0.24% 0.24% 0.24% 0.24% 0.24% 0.24% 0.24% 0.24% 0.24% 0.24%
Media Agencies 0.72% 0.72% 0.72% 0.72% 0.72% 0.72% 0.72% 0.72% 0.72% 0.72% 0.72% 0.72% 0.72%
Industrial Suppliers 0.48% 0.48% 0.48% 0.48% 0.48% 0.48% 0.48% 0.48% 0.48% 0.48% 0.48% 0.48% 0.48%
Hotel & Lodging REITs 0.24% 0.24% 0.24% 0.24% 0.24% 0.24% 0.24% 0.24% 0.24% 0.24% 0.24% 0.24% 0.24%
Gold Mining 0.24% 0.24% 0.24% 0.24% 0.24% 0.24% 0.24% 0.24% 0.24% 0.24% 0.24% 0.24% 0.24%
Iron & Steel 0.48% 0.48% 0.48% 0.48% 0.48% 0.48% 0.48% 0.48% 0.48% 0.48% 0.48% 0.48% 0.48%
Furnishings 0.48% 0.48% 0.48% 0.48% 0.48% 0.48% 0.48% 0.48% 0.48% 0.48% 0.48% 0.48% 0.48% Gas Distribution 0.72% 0.72% 0.72% 0.72% 0.72% 0.72% 0.72% 0.72% 0.72% 0.72% 0.72% 0.72% 0.72% Brewers 0.24% 0.24% 0.24% 0.24% 0.24% 0.24% 0.24% 0.24% 0.24% 0.24% 0.24% 0.24% 0.24% Trucking 0.24% 0.24% 0.24% 0.24% 0.24% 0.24% 0.24% 0.24% 0.24% 0.24% 0.24% 0.24% 0.24% Home Construction 0.72% 0.72% 0.72% 0.72% 0.72% 0.72% 0.72% 0.72% 0.72% 0.72% 0.72% 0.72% 0.72% Tires 0.24% 0.24% 0.24% 0.24% 0.24% 0.24% 0.24% 0.24% 0.24% 0.24% 0.24% 0.24% 0.24%
Containers & Package 0.96% 0.96% 0.96% 0.96% 0.96% 0.96% 0.96% 0.96% 0.96% 0.96% 0.96% 0.96% 0.96%
Consumer Electronics 0.24% 0.24% 0.24% 0.24% 0.24% 0.24% 0.24% 0.24% 0.24% 0.24% 0.24% 0.24% 0.24%
Gambling 0.24% 0.24% 0.24% 0.24% 0.24% 0.24% 0.24% 0.24% 0.24% 0.24% 0.24% 0.24% 0.24%
Heavy Construction 0.72% 0.72% 0.72% 0.72% 0.72% 0.72% 0.72% 0.72% 0.72% 0.72% 0.72% 0.72% 0.72%
Publishing 0.72% 0.72% 0.72% 0.72% 0.72% 0.72% 0.72% 0.72% 0.72% 0.72% 0.72% 0.72% 0.72%
Bus.Train & Employmnt 0.24% 0.24% 0.24% 0.24% 0.24% 0.24% 0.24% 0.24% 0.24% 0.24% 0.24% 0.24% 0.24%
Coal 0.24% 0.24% 0.24% 0.24% 0.24% 0.24% 0.24% 0.24% 0.24% 0.24% 0.24% 0.24% 0.24%
Renewable Energy Eq. 0.24% 0.24% 0.24% 0.24% 0.24% 0.24% 0.24% 0.24% 0.24% 0.24% 0.24% 0.24% 0.24%
Transport Services 0.24% 0.24% 0.24% 0.24% 0.24% 0.24% 0.24% 0.24% 0.24% 0.24% 0.24% 0.24% 0.24%
Elec. Office Equip. 0.24% 0.24% 0.24% 0.24% 0.24% 0.24% 0.24% 0.24% 0.24% 0.24% 0.24% 0.24% 0.24%
REFERENCES
Anderson, R. & Reeb, D. (2003). “Founding-family ownership and firm performance: Evidence from the S&P500”. Journal of Finance, Vol. 58, pp. 1301-1328.
Bhagat, Sanjai & B. Bolton (2008). “Corporate governance and firm performance”.
Journal of Corporate Finance.Vol.14, pp. 257–273.
Carcello, J. V., D. R. Hermanson, T. L. Neal & R.A. Riley (2002). “Board Characteristics and Audit Fees”. Contemporary Accounting Research, Vol. 19, Nº3, pp. 365–384. Choi, J.H., C. F. Kim, J. B. Kim, & Y. Zang (2010). “Audit office size, audit quality,
and audit pricing”. Auditing: A Journal of Pratice and Theory, Vol. 29, Nº1, pp. 73-97.
Cohen, J., G. Krishnamoorthy & A. M. Wright (2002). “Corporate Governance and the Audit Process”. Contemporary Accounting Research, Vol. 19, Nº4, pp. 573–594. Daoud, K., D. Al-Sraheen & N. Alslehat (2015). “The Moderating Effect of an Audit
Committee on the Relationship between Non-Audit Services and Corporate Performance”. Research Journal of Finance and Accounting, 6 (14): 170-179 Daoud, K., D. Al-Sraheen & N. Alslehat (2015). “The Moderating Effect of an Audit
Committee on the Relationship between Non-Audit Services and Corporate Performance”. Research Journal of Finance and Accounting, Vol. 6 Nº14, pp. 170-179.
Gompers, P., J. Ishii & A. Metrick (2003). “Corporate Governance and Equity Prices.”
The Quaterly Journal of Economics, Vol. 118 Nº1, pp. 107-155.
Haniffa, R., M. Zaman, & M. Hudaib (2011). “Corporate Governance Quality, Audit fees and Non-Audit Fees.”, Journal of Business Finance & Accounting, Vol. 38, Nº 1 & Nº2, pp. 165-197.
Hay, D., W. Knechel & N. Wong (2006). “Audit Fees: A Meta-analysis of the Effect of Supply and Demand Attributes.” Contemporary Accounting Research, Vol. 23, Nº1, pp. 141–91.
Hay, D. (2013). “Further Evidence from meta-analysis of audit fee research”.
International Journal of Auditing, Vol. 17, Nº2, pp. 162–176
Lee, J. (2009). “Does Size Matter in Firm Performance? Evidence from US Public Firms”. International Journal of the Economics of Business, Vol. 16, Nº2, pp. 189-203.
Martinez, A. L., Moraes, A. J. (2014). “Association between independent auditor fees and firm value: A study of Brazilian Public Companies”. Journal of Modern Accouting
and Auditing, Vol. 10, Nº4, pp. 442-450.
Moutinho, V., A. Cerqueira & E. Brandão (2012), “Audit fees and firm performance”.
Faculdade de Economia do Porto. Available at:
http://papers.ssrn.com/sol3/papers.cfm?abstract_id=2180020
Stanley, J. (2011). “Is the audit fee disclosure a leading indicator of clients’ business risk?”. Auditing: A Journal of Practice & Theory, Vol.30, Nº3, pp. 157–179. Sami, H., J. Wang & H. Zhou (2011), "Corporate governance and operating performance
of Chinese listed firms", Journal of International Accounting, Auditing and
Taxation, Vol. 20, pp. 106-114.
Simunic, D. A., (1980). “The Pricing Of Audit Services: Theory and Evidence”. Journal
of Accounting Research, Vol. 18, Nº1, pp. 161-190.
Whisenant, S., S. Sankaraguruswamy & K. Raghunandan (2003), “Evidence on the Joint Determination of Audit and Non-Audit Fees”. Journal of Accounting Research, Vol. 41, Nº4, pp. 721–744.
Wu, Xingze (2012). “Corporate governance and audit fees: Evidence from companies listed on the Shanghai Stock Exchange”. China Journal of Accounting Research. Vol. 5, Nº4, pp. 321–342.
Yang, T. & S. Zhao (2014), “CEO duality and firm performance: Evidence from an exogenous shock to the competitive environment”, Journal of Banking & Finance, Vol.49, pp. 534–552.