Changes in End-of-Life Practices in European Intensive Care
Units From 1999 to 2016
Charles L. Sprung, MD; Bara Ricou, MD; Christiane S. Hartog, MD; Paulo Maia, MD; Spyros D. Mentzelopoulos, MD, PhD; Manfred Weiss, MD; Phillip D. Levin, MB, BChir; Laura Galarza, MD; Veronica de la Guardia, MD; Joerg C. Schefold, MD; Mario Baras, PhD; Gavin M. Joynt, MBBCh; Hans-Henrik Bülow, MD; Georgios Nakos, MD, PhD; Vladimir Cerny, MD, PhD; Stephan Marsch, MD, DPhil; Armand R. Girbes, MD, PhD; Catherine Ingels, MD, PhD; Orsolya Miskolci, MD; Didier Ledoux, MD; Sudakshina Mullick, MD; Maria G. Bocci, MD; Jakob Gjedsted, MD, PhD; Belén Estébanez, MD; Joseph L. Nates, MD, MBA, CMQ; Olivier Lesieur, MD, PhD; Roshni Sreedharan, MD; Alberto M. Giannini, MD; Lucía Cachafeiro Fuciños, MD, PhD; Christopher M. Danbury, MB, BS, MPhil; Andrej Michalsen, MD, MPH; Ivo W. Soliman, MD; Angel Estella, MD; Alexander Avidan, MD
IMPORTANCEEnd-of-life decisions occur daily in intensive care units (ICUs) around the world,
and these practices could change over time.
OBJECTIVETo determine the changes in end-of-life practices in European ICUs after 16 years.
DESIGN, SETTING, AND PARTICIPANTSEthicus-2 was a prospective observational study of 22
European ICUs previously included in the Ethicus-1 study (1999-2000). During a self-selected continuous 6-month period at each ICU, consecutive patients who died or had any limitation of life-sustaining therapy from September 2015 until October 2016 were included. Patients were followed up until death or until 2 months after the first treatment limitation decision.
EXPOSURES Comparison between the 1999-2000 cohort vs 2015-2016 cohort.
MAIN OUTCOMES AND MEASURES End-of-life outcomes were classified into 5 mutually
exclusive categories (withholding of life-prolonging therapy, withdrawing of life-prolonging therapy, active shortening of the dying process, failed cardiopulmonary resuscitation [CPR], brain death). The primary outcome was whether patients received any treatment limitations (withholding or withdrawing of life-prolonging therapy or shortening of the dying process). Outcomes were determined by senior intensivists.
RESULTS Of 13 625 patients admitted to participating ICUs during the 2015-2016 study
period, 1785 (13.1%) died or had limitations of life-prolonging therapies and were included in the study. Compared with patients included in the 1999-2000 cohort (n = 2807), patients in the 2015-2016 cohort were significantly older (median age, 70 years [IQR, 59-79] vs 67 years [IQR, 54-75]; P < .001) and the proportion of female patients was similar (39.6% vs 38.7%; P = .58). Significantly more treatment limitations occurred in the 2015-2016 cohort compared with the 1999-2000 cohort (1601 [89.7%] vs 1918 [68.3%]; difference, 21.4% [95% CI, 19.2%-23.6%]; P < .001).
Limitation
2015-2016, No. (%)
1999-2000,
No. (%) Difference, % (95% CI) P Value Withholding of life-prolonging therapy 892 (50) 1143 (40.7) 9.3 (6.4 to 12.3) <.001 Withdrawing of life-prolonging therapy 692 (38.8) 695 (24.8) 14.0 (11.2 to 16.8) <.001 Failed CPR 110 (6.2) 628 (22.4) −16.2 (−18.1 to −14.3) <.001
Brain death 74 (4.1) 261 (9.3) −5.2 (−6.6 to −3.8) <.001
Active shortening of the dying process 17 (1.0) 80 (2.9) −1.9 (−2.7 to −1.1) <.001
CONCLUSIONS AND RELEVANCE Among patients who had treatment limitations or died in 22
European ICUs in 2015-2016, compared with data reported from the same ICUs in 1999-2000, limitations in life-prolonging therapies occurred significantly more frequently and death without limitations in life-prolonging therapies occurred significantly less frequently. These findings suggest a shift in end-of-life practices in European ICUs, but the study is limited in that it excluded patients who survived ICU hospitalization without treatment limitations. JAMA. 2019;322(17):1692-1704. doi:10.1001/jama.2019.14608
Published online October 2, 2019. Corrected on November 5, 2019.
Editorialpage 1655
Supplemental content CME Quiz at
jamanetwork.com/learning
Author Affiliations: Author affiliations are listed at the end of this article.
Corresponding Author: Charles L. Sprung, MD, General Intensive Care Unit, Department of Anesthesiology and Critical Care Medicine, Hadassah Hebrew University Medical Center, PO Box 12 000, Jerusalem, Israel 91120 ([email protected]) Section Editor: Derek C. Angus, MD, MPH, Associate Editor, JAMA ([email protected]).
JAMA |
Original Investigation
|
CARING FOR THE CRITICALLY ILL PATIENT
D
eath in intensive care units (ICUs) frequently occurs after a decision to limit life-sustaining interventions. Despite international consensus for many ethical prin-ciples underlying ICU end-of-life care,1there are consider-able variations in actual practice within and between coun-tries and regions.2For example, in the Ethicus-1 study conducted from January 1999 until July 2000 in 37 European ICUs, the frequency of withholding life-prolonging therapies ranged from 16% to 70%, withdrawing life-prolonging thera-pies from 5% to 69%, active shortening of the dying process from 0% to 19%, and failed cardiopulmonary resuscitation (CPR) from 5% to 48%.3
Over the past decade, there have been changes in European attitudes,1,4laws,5recommendations6,7and guide-lines8,9regarding end-of-life practices. Although paternalism persists among some European caregivers,4more shared decision making has been advocated.10
Recently, European public support for euthanasia and physician-assisted sui-cide has increased, resulting in more deaths from these practices.11The actual extent of end-of-life practice changes across European ICUs remains unknown. The present Ethicus-2 study was designed to assess whether there has been a change in end-of-life practices in European ICUs from 1999-2000 to 2015-2016.
Methods
Centers
All 37 centers that initially participated in the Ethicus-1 study (1999-2000 cohort)3
were invited to participate in the Ethicus-2 study (2015-2016 cohort). Several ICUs no longer existed, and some others declined participation, resulting in the inclusion of 22 of the original 37 ICUs in the present study. The contrib-uting regions and countries included Northern Europe (Denmark, Ireland, The Netherlands, and the United Kingdom), Central Europe (Belgium, Czech Republic, Germany, and Switzerland), and Southern Europe (Greece, Israel, Italy, Portugal, Spain, and Turkey). These ICUs represent 14 of the original 17 countries. Data from ICUs that participated in the 1999-2000 study but not the 2015-2016 study (ICUs in Austria, Finland, and Sweden) were not included in this com-parison study. Institutional ethics committee approval, with a waiver of informed consent, was obtained from each par-ticipating center. Countries and centers were coded anony-mously and study patients were numbered consecutively to ensure confidentiality and to enable clinicians to report prac-tices without risk of legal liability.
Patients
This study used the same study population definitions, ethical and legal considerations, and data collection methods as were used in the 1999-2000-cohort.3Consecutive adult patients admitted to participating ICUs who died or had any limitation of life-saving interventions over a 6-month period were selected by each ICU between September 1, 2015, and September 30, 2016, and were prospectively included in the study. Patients were followed up until discharge from
the ICU, death, or 2 months from the first decision to limit life-prolonging therapies.
Outcomes
End-of-life outcomes were classified into 5 mutually exclu-sive categories: withholding of life-prolonging therapy, with-drawing of life-prolonging therapy, active shortening of the dying process, failed CPR, and brain death. The primary outcome was whether patients received any limitations in prolonging therapy (withholding or withdrawing of life-prolonging therapy, or shortening of the dying process).
Study Definitions for End-of-Life Categories
•Withholding treatment—a decision was made not to start or increase a life-sustaining intervention, such as not to per-form CPR if a patient had a cardiac arrest.
•Withdrawing treatment—a decision was made to actively stop a life-sustaining intervention presently being given, such as stopping a norepinephrine infusion being given for shock. •Active shortening of the dying process—a circumstance
in which someone performed an act with the specific in-tent of shortening the dying process; these acts did not include withholding or withdrawing although withholding or withdrawing could occur prior to active shortening of the dying process.
•Failed CPR—death despite ventilation and cardiac massage. •Brain death—documented cessation of cerebral function and
meeting criteria for brain death.
A hierarchical categorization was used for the most active limitation if more than one occurred (active shortening of the dying process > withdrawing > withholding). Secondary outcomes included hospital survival or death; specific limi-tations of therapies including failed CPR, intubation, venti-lation, vasopressors, and renal replacement therapy; ICU length of stay; time until initiating the first life-sustaining limitation; time after initiating the first life-sustaining limi-tation until death; time until withholding or withdrawing life-sustaining therapies or active shortening of the dying
Key Points
QuestionHave end-of-life practices in European intensive care
units (ICUs) changed from 1999-2000 to 2015-2016?
FindingsIn this prospective observational study of 1785 patients
who had limitations in life-prolonging therapies or died in 22 European ICUs in 2015-2016, compared with data previously reported from the same ICUs in 1999-2000 (2807 patients), treatment limitations (withholding or withdrawing life-sustaining treatment or active shortening of the dying process) occurred significantly more frequently (89.7% vs 68.3%), whereas death without any limitations in life-prolonging therapies occurred significantly less frequently (10.3% vs 31.7%).
MeaningThese findings suggest that end-of-life care practices in
European ICUs changed from 1999-2000 to 2015-2016 with more limitations in life-prolonging therapies and fewer deaths without treatment limitations.
process; patient and institutional characteristics and prob-abilities of death. Post hoc outcomes included ICU charac-teristics and ethical practices (see following section for fur-ther explanation).
Study Procedures and Data Collection
No interventions or treatments were given, withheld, or with-drawn from patients for study purposes. At each institution, the senior intensivist responsible for end-of-life decisions de-termined which end-of-life practice occurred and was respon-sible for completing the study data form including outcomes. Similar data forms to those used for the 1999-2000 cohort were used, and data were entered using a dedicated and se-cured website. Patient data collected included sex, age, reli-gious affiliation, ICU admission diagnosis, chronic disorders, end-of-life category, specific therapy limitations, dates and times of hospital and ICU admission, death or discharge, decisions to limit interventions, and hospital survival or mortality.
Additional procedures to improve validity and consis-tency included adherence to the study protocol ( Supple-ment 1), following specific instructions for study perfor-mance and data form completion, providing concurrent audit and feedback, having immediate answers to frequently asked questions, and having a quality assurance program that evalu-ated 5% of all patients (crosschecking accuracy of data entry was 8841/9249 [96%]).
To evaluate changes in the ICUs from 1999-2000 to 2015-2016, investigators from the participating centers provided data on ICU variables for both time periods including ICU type, ICU and hospital number of beds, ICU mean admissions per month, and ICU physician and nursing staffing. Yearly ICU mortality was calculated from each ICU’s total admission number and mortality.
In an attempt to understand study results in relation to pos-sible changes in ethical practice between 1999-2000 and 2015-2016, investigators were surveyed in 2019 to retrospectively provide data regarding 12 variables that represent various as-pects of ethical practice. Variable selection was based on a re-cent worldwide consensus1and on current, evidence-based guidelines and policy statements.8-10,12
Variable data were collected in a binary (yes/no) form and were based on the fol-lowing items: (1) routine family meetings1,10,12; (2) daily delib-eration for the appropriate level of care1; (3) end-of-life dis-cussions during meetings1; (4) written triggers for limitations9; (5) written end-of-life guidelines5
; (6) written protocols9 ; (7) palliative care consultations10
; (8) ethics consultations10 ; (9) staff taking communications courses1,10,12; (10) staff tak-ing bioethics courses1,8,10,12; (11) each country’s end-of-life guidelines1; and (12) each country’s legislation.1For each of the 12 ethical practice–related variables for the 2 study periods, a positive answer was graded as 1 and a negative answer as 0. The sum was operationalized as an ICU-specific ethical prac-tice score with a range of 0 to 12 points. This score was de-rived for the purposes of this study.
Statistical Analyses
The number of ICU admissions per month (turnover) catego-rized institutions as small (≤30), intermediate (31-60), or large
(≥61). Institutions were also dichotomized into academic vs nonacademic centers. For each patient, the main outcome vari-able was the end-of-life category. Continuous varivari-ables show-ing a symmetric and close to normal distribution are ex-pressed as mean (SD) and compared using the t test. Percentages were compared using the χ2or Fisher exact test. Numeric asymmetric variables are presented as median inter-quartile range (IQR) and compared with the nonparametric Mann-Whitney test (independent samples) or the Wilcoxon signed rank test (paired samples). For paired samples, the pri-mary sampling unit was centers participating in 1999-2000 and in 2015-2016. Probabilities of death within 24, 48, and 72 hours of decisions for withholding and withdrawing life-sustaining treatments and active shortening of the dying process were per-formed for both study periods.
Pairwise exclusion was the method used for missing data. A case that had a missing value for any variable was omitted from the analysis for each table or analysis separately. Be-cause of the potential for type 1 error due to multiple compari-sons, findings for analyses of secondary end points should be interpreted as exploratory. An additional, exploratory, post hoc, multivariable, logistic regression analysis is detailed in Supple-ment 2. Statistical analyses were performed using IBM SPSS version 24. A test was considered significant if the P value was less than .05. P values were 2-sided.
Results
At the 22 centers participating in this study, 13 625 patients (range, 82-1440 patients per center) were admitted over 5.9 months (range, 1-6 months) in 2015-2016. Of these patients, 1785 (13.1%) died or had limitations of life-sustaining treat-ments and constituted the 2015-2016 study population. In 1999-2000, these 22 centers admitted 22 081 patients (range, 143-3118 patients per center) over 13.7 months (range, 1-18 months), and 2807 (12.7%) died or had limitations of life-sustaining treatments. Patient characteristics in the 2015-2016 and 1999-2000 cohorts are presented in Table 1. The pro-portion of patients enrolled in the cohort because limitations were placed on life-sustaining therapy (withholding or with-drawing life-sustaining treatment or active shortening of the dying process) was significantly higher in 2015-2016 (1601 [89.7%]) than in 1999-2000 (1918 [68.3%]; difference, 21.4% [95% CI, 19.2% to 23.6%]; P < .001), while patients who were enrolled because of death occurring without any limitations in life-prolonging therapies (failed CPR and brain death) was significantly less frequent in 2015-2016 (10.3%) than in 1999-2000 (31.7%; difference, −21.4% [95% CI, −23.6% to −19.2%];
P < .001).
Table 2 details the retrospectively collected ICU charac-teristics for the 2 study periods. In 2015-2016, there were sig-nificant increases in ICU admission rates per month (median, 91.0 [interquartile range {IQR}, 32.5-118.8]) vs in 1999-2000 (median, 81.0 [IQR, 40.8-185.0]; P = .02]), and the number of ICU beds increased in 2015-2016 (median, 18.0 [IQR, 11.5-26.5]) vs in 1999-2000 (median 18.0 [IQR, 14.0-29.0];
mortality in 2015-2016 vs in 1999-2000 (10.7% vs 12.2%;
P < .001) and in mean (SD) ethical practice scores (in
2015-2016, 5.6 [2.7] vs in 1999-2000, 2.9 [1.7]; P < .001). Results of a post hoc, logistic regression analysis are presented in the eTables 1-4 (Supplement 2).
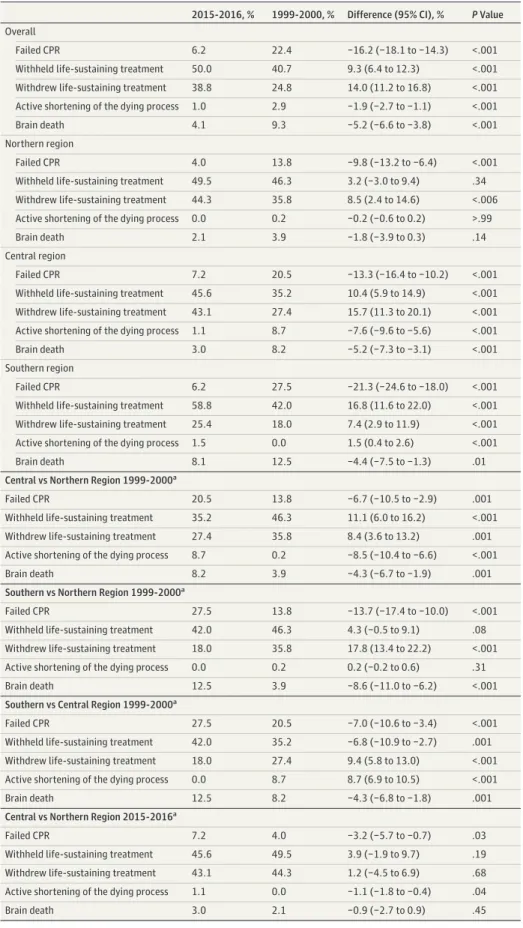
The distribution of patients, according to the types of end-of-life categories, is shown in the Figure and in Table 3. Over-all in 2015-2016, there was significantly less failed CPR (6.2% [110]) than in 1999-2000 (22.4% [628]; difference, −16.2% [95% CI, −18.1% to −14.3%]; P < .001), significantly more withhold-ing of life-prolongwithhold-ing therapies in 2015-2016 (50.0% [892]) than in 1999-2000 (40.7% [1143]; difference, 9.3% [95% CI, 6.4% to 12.3%]; P < .001), and significantly more withdrawing of life-prolonging therapies in 2015-2016 (692 [38.8%] than in 1999-2000 (695 [24.8%], difference, 14.0% [95% CI, 11.2% to 16.8%];
P < .001). Active shortening of the dying process was
signifi-cantly less frequent in 2015-2016 (17 [1.0%]) than in 1999-2000 (80 [2.9%]; difference, −1.9% [95% CI, −2.7% to −1.1%];
P < .001). Brain death was also significantly less frequent in
2015-2016 (74 [4.1%]) than in 1999-2000 (261 [9.3%]; differ-ence, −5.2% [95% CI, −6.6% to −3.8%]; P < .001).
End-of-life categories are also presented by region in the Figure and Table 3. In 2015-2016 vs 1999-2000, the signifi-cant decrease in failed CPR was prominent in the south (dif-ference, −21.3% [95% CI, −24.6% to −18.0%]; P < .001). With-holding life-sustaining treatment exhibited a significant increase in the south (difference, 16.8% [95% CI, 11.6% to 22.0%]; P < .001), whereas withdrawing life-sustaining treat-ment significantly increased in all regions and was highest in the central region (difference, 15.7%, [95% CI, 11.3% to 20.1%];
P < .001).
Among all patients admitted to the study ICUs during the study periods, hospital mortality was significantly lower in 2015-2016 (10.7% [1458/13 625]) than in 1999-2000 (12.2% [2701/22 081]; difference, −1.5% [95% CI, −2.2% to −0.8%];
P < .001). No patients survived to hospital discharge after brain
Table 1. Study Population of the 22 European Centers, 1999-2000 and 2015-2016
Patient Characteristics
1999-2000 (n = 2807)a
2015-2016
(n = 1785)a Difference (95% CI)b
Age, median (IQR), yc 67 (54 to 75) 70 (59 to 79) 4.8 (3.8 to 5.8)
Age, decadesd 13-29 190 (6.8) 43 (2.4) −4.4 (−5.5 to −3.2) 30-49 377 (13.4) 166 (9.3) −4.1 (−6.0 to −2.3) 50-69 1020 (36.3) 656 (36.8) 0.4 (−2.4 to 3.3) 70-96 1220 (43.5) 920 (51.5) 8.1 (5.1 to 11.1) Male sexd 1719 (61.3) 1079 (60.4) −0.8 (−3.7 to 2.1) Female sexd 1085 (38.7) 706 (39.6) 0.9 (−2.0 to 3.8) Patients by regiond Northern Europe 587 (20.9) 424 (23.8) 2.8 (0.4 to 5.3) Central Europe 906 (32.3) 893 (50.0) 17.8 (14.9 to 20.6) Southern Europe 1314 (46.8) 468 (26.2) −20.6 (−23.3 to −17.8)
ICU admission (acute) diagnosesd
Respiratory 539 (19.2) 431 (24.1) 4.9 (2.5 to 7.4) Cardiovascular 478 (17.0) 322 (18.0) 1.0 (−1.3 to 3.3) Neurologic 472 (16.8) 277 (15.5) −1.3 (−3.5 to 0.9) Gastrointestinal 388 (13.8) 98 (5.5) −8.3 (−10.0 to −6.7) Surgery 348 (12.4) 339 (19.0) 6.6 (4.4 to 8.8) Sepsis 248 (8.8) 194 (10.9) 2.0 (0.2 to 3.8) Trauma 196 (7.0) 28 (1.6) −5.4 (−6.5 to −4.3) Metabolic 57 (2.0) 44 (2.5) 0.4 (−0.5 to 1.3) Miscellaneous 53 (1.9) 38 (2.1) 0.2 (−0.6 to 1.1) Hematologic 28 (1.0) 14 (0.8) −0.2 (−0.8 to 0.3) Chronic diseasesd Cardiovascular 942 (33.6) 758 (42.5) 8.9 (6.0 to 11.8) None 624 (22.2) 140 (7.8) −14.4 (−16.4 to −12.4) Chest 313 (11.2) 180 (10.1) −1.1 (−2.9 to −0.8) Other diseases 275 (9.8) 175 (9.8) 0.0 (−1.8 to 1.8) Cancer 253 (9.0) 179 (10.0) 1.0 (−0.7 to 1.8)
Neurological, cognitive, musculare 135 (4.8) 141 (7.9) 3.1 (1.6 to 4.6)
Digestive 130 (4.6) 99 (5.5) 0.9 (−0.4 to 2.2)
Kidney and urinary system 71 (2.5) 64 (3.6) 1.1 (0.0 to 2.1)
Immunologic 64 (2.3) 34 (1.9) −0.4 (−1.2 to 0.5)
Missing data 0 15 (0.8) 0.8 (0.4 to 1.3)
Abbreviations: ICU, intensive care unit; IQR, interquartile range.
aData are reported as No (%) unless
otherwise indicated.
bFor all variables except age, the
difference (95% CI) indicates difference in percentages.
cAge was compared using the
Mann-Whitney test.
dComparisons were determined
using a χ2test and were not
corrected for multiplicity; these exploratory analyses were aimed at detecting differences between study periods, also for the purpose of appropriate adjustments in the subsequent multivariable analyses (see Supplement 2).
e
Indicates 3 disease categories counted as 1.
death, failed CPR, or active shortening of the dying process in either study period; whereas survival was significantly higher in 2015-2016 after withholding life-sustaining therapy (34.9% [311]) than in 1999-2000 (8.9% [102]; difference, 26.0% [95% CI, 22.5% to 29.5%]; P < .001) and after withdrawing life-sustaining therapy (2.3% [16]) than in 1999-2000 (0.6% [4]; difference, 1.7% [95% CI, 0.4% to 3.0%]; P < .001). Mortali-ties after specific limitations in life-prolonging therapies are presented in Table 4.
Survival after any therapy limitation was significantly higher in 2015-2016 (20.4% [327]) than in 1999-2000 (5.5% [106]; difference, 14.9% [95% CI, 12.7% to 17.1%]; P < .001). The improved 2015-2016 survival was present in all 3 regions and higher after withholding mechanical ventilation (36.9% [110]) than in 1999-2000 (11.5% [15]; difference, 25.5% [95% CI, 22.9% to 28.0%]; P < .001), higher after withholding vaso-pressors (89 [20.7%]) than in 1999-2000 (19 [4.6%]; differ-ence, 16.1% [95% CI, 14.1% to 18.2%]; P < .001), and higher after withholding renal replacement therapy (146 [26.9%]) than in 1999-2000 (8 [1.8%]; difference, 25.1% [95% CI, 23.0% to 27.2%]; P < .001) (Table 4).
In 2015-2016, the probability of death following the deci-sion to withhold life-prolonging therapy (adjusted for age, sex, diagnosis, practice, turnover, and region) was 93% within 24 hours, 98% within 48 hours, and 99% within 72 hours; fol-lowing the decision to withdraw life-prolonging therapy, the probability of death was 98% within 24 hours, 99% within 48 hours, and 100% within 72 hours; and following the decision for active shortening of the dying process, the probability of death was 100% at all 3 time points. In 1999-2000, the prob-ability of death following the decision to withhold life-prolonging therapy (adjusted for age, sex, diagnosis, prac-tice, turnover, and region) was 92% within 24 hours, 94% within 48 hours, and 96% within 72 hours; following the de-cision to withdraw life-prolonging therapy, the probability of death was 99% within 24 hours, 100% within 48 hours, and 100% within 72 hours; and following the decision for active shortening of the dying process, the probability of death was 99% within 24 hours, 100% within 48 hours, and 100% within 72 hours.
For all study patients, the median time from ICU admis-sion until the first limitation of life-sustaining therapy was shorter in 2015-2016 compared with 1999-2000 (2.1 vs 4.0 days; P < .001), and the ICU length of stay was shorter in 2015-2016 compared with 1999-2000 (4.0 vs 5.0 days; P < .001) (Table 5). The median time from withdrawing life-sustaining therapy until death was shorter in 2015-2016 compared with 1999-2000 (11.5 vs 17.1 hours; P < .02) and shorter than the me-dian time from withholding life-sustaining therapy until death, which was longer in 2015-2016 compared with 1999-2000 (29.0 vs 14.1 hours; P < .001) (Table 5).
By region, the median time from ICU admission until the first limitation of life-sustaining therapy was 1.9 days in north-ern Europe, 1.2 days in central Europe, and 5.0 days in south-ern Europe in 2015-2016, compared with 2.6 days in northsouth-ern Europe, 3.9 days in central Europe, and 5.6 days in southern Europe in 1999-2000 (Table 5). The median length of stay in the ICU was 4.0 days in northern Europe, 3.0 days in central Table
2. ICU and Hospital V ariable s for 22 E uropean Centers, 19 9 9 -2 000 and 2 0 15-2 0 16 a ICU Char acteristics T otal ICUs Nor thern R egion Centr al R egion Southern R egion Difference (95% CI) P V alue b 1999-2000 (N = 22) 2015-2016 (N = 22) 1999-2000 (n=4 ) 2015-2016 (n=4 ) 1999-2000 (n=6 ) 2015-2016 (n=6 ) 1999-2000 (n = 12) 2015-2016 (n = 12) ICU type Gener al 18 18 33331 2 1 2 Surgical 33112200 Medical 1 1 1100 Closed ICU , N o . (%) c 22 (100.0) 21 (95.5) 4 (100.0) 4 (100.0) 6 (100.0) 6 (100.0) 12 (100.0) 11 (91.7) −4.5 (−13.2 to 4.2) >.99 ICU No . o f beds, median(IQR) 18.0 (11.5 to 26.5) 18.0 (14.0 to 29.0) 18.0 (14.3 to 31.5) 19.5 (15.8 to 31.5) 27.0 (19.5 to 40.5) 34.0 (26.0 to 54.3) 13.0 (8. 5 to 1 8.8) 14.0 (10.3 to 17.5) 0.0 (0.0 to 3.0) .02 ICU admissions/ mo , median (IQR) 91.0 (32.5 to 118.8) 81.0 (40.8 to 185.0) 115.0 (55.0 to 141.3) 108.5 (51.8 to 167.5) 155.0 (103.8 to 191.3) 213.0 (178.8 to 296.0) 37.0 (25.0 to 75.5) 46.0 (32.3 to 75.0) 8.0 (2.0 to 27.0) .02 Institution hospital beds, median (IQR) 800 (595 to 1225) 850 (600 to 1238) 600 (585 to 825) 600 (585 to 825) 1113 (788 to 1678) 1163 (788 to 1940) 725 (487 to 1150) 833 (593 to 1150) 0.0 (0.0 to 350.0) .31 ICU physician staffing per bed, median (IQR) 0.33 (0.20 to 0.50) 0.40 (0.25 to 0.56) 0.19 (0.15 to 0.43) 0.21 (0.15 to 0.44) 0.28 (0.23 to 0.39) 0.36 (0.22 to 0.68) 0.50 (0.25 to 0.65) 0.50 (0.26 to 0.59) 0.0 (0.0 to 0.1) .88 ICU nursing staffing per bed, median (IQR) 0.50 (0.40 to 0.68) 0.50 (0.40 to 0.68) 1.00 (0.75 to 1.15) 1.00 (0.75 to 1.15 0.50 (0.40 to 0.63) 0.50 (0.40 to 0.63) 0.50 (0.40 to 0.50) 0.50 (0.40 to 0.50) 0.0 (0.0 to 0.0) >.99 ICU mor talit y, y early av er age % 12.2 10.7 11.6 13.1 8.5 9.2 17.4 11.7 −1.5 (−2.2 to −0.8) <.001 Institution, academic, No . y es (%) 19 (86.4) 20 (90.9) 4 (100.0) 4 (100.0) 5 (83.3) 5 (83.3) 1 0 (83.3) 11 (91.7) 4.5 (−14.2 to 23.2) >.99 (con tinued)
T able 2. ICU and Hospital V ariable s for 22 E uropean Centers, 19 9 9 -2 000 and 2 0 15-2 0 16 a(continued) ICU Char acteristics T otal ICUs Nor thern R egion Centr al R egion Southern R egion Difference (95% CI) P V alue b 1999-2000 (N = 22) 2015-2016 (N = 22) 1999-2000 (n=4 ) 2015-2016 (n=4 ) 1999-2000 (n=6 ) 2015-2016 (n=6 ) 1999-2000 (n = 12) 2015-2016 (n = 12) ICU ethical pr actice v ariables, No . y es (%) R outine family meetings 15 (68.2) 17 (77.3) 2 (50.0) 2 (50.0) 4 (66.7) 5 (83.3) 9 (75.0) 10 (83.3) 9.1 (−17.1 to 35.3) .74 Daily deliber ation for appropriate le v e l of care for each patient 10 (45.5) 17 (77.3) 2 (50.0) 2 (50.0) 1 (16.7) 6 (100.0) 7 (58.3) 9 (75.0) 31.8 (4.6 to 59.0) .06 E nd-of-life discussions during w eekly meetings 10 (45.5) 14 (63.6) 2 (50.0) 3 (75.0) 2 (33.3) 4 (66.7) 6 (50.0) 7 (58.3) 18.1 (−10.8 to 47.0) .3 6 Written triggers for limitations 4 (18.2) 8 (36.4) 1 (25.0) 2 (50.0) 1 (16.7) 2 (33.3) 2 (16.7) 4 (33.3) 18.2 (−7.6 to 44.0) .31 Written end-of-life guidelines 5 (22.7) 10 (45.5) 2 (50.0) 3 (75.0) 1 (16.7) 2 (33.3) 2 (16.7) 5 (41.7) 22.8 (−4.4 to 50.0) .20 Written end-of-life protocols 1 (4.8) 5 (22.7) 0 2 (50.0) 0 1 (16.7) 1 (8.3) 2 (16.7) 17.9 (−1.8 to 37.6) .19 Palliativ e care consultations 1 (4.8) 7 (31.8) 0 1 (25.0) 0 3 (50.0) 1 (8.3) 3 (25.0) 27.0 (5.6 to 48.4) .046 E thics consultations 3 (13.6) 4 (18.2) 0 0 3 (50.0) 3 (50.0) 0 1 (8.3) 4.6 (−17.0 to 26.2) >.99 Staff taking communication courses 3 (13.6) 12 (54.5) 1 (25.0) 4 (100.0) 0 3 (50.0) 2 (16.7) 5 (41.7) 40.9 (15.6 to 66.2) .01 Staff taking bioethics courses 2 (9.6) 5 (22.7) 1 (25.0) 2 (50.0) 0 1 (16.7) 1 (8.3) 2 (16.7) 13.1 (−8.3 to 34.5) .41 Countr y end-of-life guidelines 3 (13.6) 10 (45.5) 1 (25.0) 4 (100.0) 2 (33.3) 3 (50.0) 0 3 (25.0) 31.9 (6.6 to 57.2) .045 Countr y end-of-life legislation 6 (27.2) 12 (54.5) 3 (75.0) 3 (75.0) 3 (50.0) 3 (50.0) 0 6 (50.0) 27.3 (−0.6 to 55.2) .12 E thical pr actice score, mean (SD) d 2.9 (1.7) 5.6 (2.7) 3.8 (0.4) 7.0 (21.9) 2.8 (1.6) 6.2 (2.7) 2 .6 (1.9) 4.8 (2.8) 2.7 (1.6 to 3.7) < .001 Abbre viations: ICU ,intensiv e care unit; IQR ,interquar tile ra n g e . aComparisons of ICU and hospital v ariable s and of the e thical pr ac tice score w ere aimed at de tec tin g diff erence s be tw een the study periods that could suppor t fur ther consider ation fo r v ariable inclusion in the subsequent multiv ariable analyse s (see Supplement 2); theref ore ,the se comparisons can be considered as e xplor ator y. T h e se e xplor ator y analyse s w ere aimed at de tec tin g subcomponents e xhibitin g the greate st chan ge s b e tw een study periods, thereb y drivin g the o v e rall chan ge in the e thical pr ac tice score . bP v alue s o f compared, continuous v ariable s w ere de termined b y a paired t te st (if normally dis tributed) or b y the Wilco xo n signed rank te st (if e xhibitin g sk e w e d dis tributions); P v alue s o f compared percenta ge s w ere de termined usin g the F isher e xac t te st .All P v alue s corre spond to comparisons of total ICU 2 0 15-2 0 16 vs total ICU 19 9 9 -2 000 . P v alue s o f comparisons of subcomponents of the e thical pr ac tice score w ere not correc ted fo r multiplicit y. cAn open ICU means that the ph ysician who is re sponsible fo r the patient admits the patient into the ICU and maintains formal re sponsibilit y for the patient and the patient’ s treatment ,while the intensivis t is a consultant without primar y re sponsibilit y for the patient .A closed ICU means that af ter the patient is admit ted into the ICU , re sponsibilit y for the patient and the patient’ s treatment is tr ansf erred to the intensivis t. dDe termined as the sum of the immediately precedin g, 12 e thical pr ac tice v ariable s and ha vin g a score ra n g e o f 0-12 points (with each point corre spondin g to a n ans w e r o f “y e s” ;a higher score [ie ,ⱖ 6 points] as compared with a lo w e r score [ie ,ⱕ 3 points] ref lec ts ICU e thical pr ac tice that is more organiz ed accordin g to current guideline s and polic y statements (see also ref erence s 5 ,8-10 ,1 2).
Europe, and 6.0 days in southern Europe in 2015-2016, com-pared with 3.0 days in northern Europe, 5.0 days in central Eu-rope, and 6.0 days in southern Europe in 1999-2000 (Table 5).
Discussion
In this prospective observational study of 22 European ICUs, limitations in life-prolonging therapies occurred signifi-cantly more frequently, and death without limitations in life-prolonging therapies occurred significantly less frequently in 2015-2016 compared with 1999-2000.
Recent developments may account for the increase in lim-iting life-prolonging treatment and the decrease in failed CPR. During the time interval between the 2 studies, new laws,5,13,14 governmental statements,15-17
recommendations,6,7,18 guidelines,8,9consensus statements by international organizations,10,19,20education,21and research1,3,4,22-24 re-garding end-of-life practices have been developed. These
frameworks help guide, support, and protect physicians when decisions about life-prolonging treatment are made. More-over, do not resuscitate orders have become commonplace and provide a formal framework for decision making and communication.25Public debates and social media have led to greater awareness and openness to discuss these issues among those in professional and lay communities.
Furthermore, palliative care has improved in Europe7and worldwide. Integration of palliative care into ICUs has been shown to result in earlier family meetings, shorter hospital lengths of stay,26
an increase in advance directives, and a de-crease in the use of nonbeneficial life-prolonging treatments.27 Randomized trials demonstrated that family-support interventions28and communication facilitators29reduce the length of stay in ICUs.28,29
In recent years, physicians have gained greater knowl-edge about ICU prognoses30and subsequent long-term outcomes.31Religious,3,22,32cultural,1legal,32and socioeco-nomic factors33may also play a role. Regional differences may Figure. Changes in End-of-Life Practices From 1999-2000 to 2015-2016 in 22 ICUs by European Region
100 80 60 40 20 0 ICU Patients, %
Participating Centers by Identification Number Withheld life-sustaining treatment
A 22 1 2 3 4 5 6 7 8 9 10 11 12 13 14 15 16 17 18 19 20 21 100 80 60 40 20 0 ICU Patients, %
Participating Centers by Identification Number Withdrew life-sustaining treatment
B 8 20 17 2 21 4 11 15 6 22 14 16 3 19 13 5 18 12 7 10 9 1 100 80 60 40 20 0 ICU Patients, %
Participating Centers by Identification Number Failed cardiopulmonary resuscitation
C 2 19 22 8 9 21 16 18 10 12 6 20 13 7 1 3 17 14 15 5 4 11 100 80 60 40 20 0 ICU Patients, %
Participating Centers by Identification Number Brain death D 4 19 14 2 5 22 11 18 13 21 7 8 15 20 12 6 10 9 1 16 17 3 Northern Europe 1999-2000 2015-2016 Central Europe Southern Europe
Presented are percentages of end-of-life practices in 22 centers with randomization of center numbers. Circles indicate 1999-2000 data and squares indicate the 2015-2016 data. The intensive care units (ICUs) have been sorted by the 1999-2000 prevalues across all ICUs in ascending order. The same ICU
number has been kept throughout. All graphs have varying orders depending on the sort (based from left to right on lowest to highest percentage of patients in 1999-2000). Two centers had 17 patients with active shortening of the dying process (data not shown).
Table 3. Changes in End-of-life Practices From 1999-2000 to 2015-2016 in 22 Intensive Care Units by European Region
2015-2016, % 1999-2000, % Difference (95% CI), % P Value Overall
Failed CPR 6.2 22.4 −16.2 (−18.1 to −14.3) <.001
Withheld life-sustaining treatment 50.0 40.7 9.3 (6.4 to 12.3) <.001 Withdrew life-sustaining treatment 38.8 24.8 14.0 (11.2 to 16.8) <.001 Active shortening of the dying process 1.0 2.9 −1.9 (−2.7 to −1.1) <.001
Brain death 4.1 9.3 −5.2 (−6.6 to −3.8) <.001
Northern region
Failed CPR 4.0 13.8 −9.8 (−13.2 to −6.4) <.001
Withheld life-sustaining treatment 49.5 46.3 3.2 (−3.0 to 9.4) .34 Withdrew life-sustaining treatment 44.3 35.8 8.5 (2.4 to 14.6) <.006 Active shortening of the dying process 0.0 0.2 −0.2 (−0.6 to 0.2) >.99
Brain death 2.1 3.9 −1.8 (−3.9 to 0.3) .14
Central region
Failed CPR 7.2 20.5 −13.3 (−16.4 to −10.2) <.001
Withheld life-sustaining treatment 45.6 35.2 10.4 (5.9 to 14.9) <.001 Withdrew life-sustaining treatment 43.1 27.4 15.7 (11.3 to 20.1) <.001 Active shortening of the dying process 1.1 8.7 −7.6 (−9.6 to −5.6) <.001
Brain death 3.0 8.2 −5.2 (−7.3 to −3.1) <.001
Southern region
Failed CPR 6.2 27.5 −21.3 (−24.6 to −18.0) <.001
Withheld life-sustaining treatment 58.8 42.0 16.8 (11.6 to 22.0) <.001 Withdrew life-sustaining treatment 25.4 18.0 7.4 (2.9 to 11.9) <.001 Active shortening of the dying process 1.5 0.0 1.5 (0.4 to 2.6) <.001
Brain death 8.1 12.5 −4.4 (−7.5 to −1.3) .01
Central vs Northern Region 1999-2000a
Failed CPR 20.5 13.8 −6.7 (−10.5 to −2.9) .001
Withheld life-sustaining treatment 35.2 46.3 11.1 (6.0 to 16.2) <.001 Withdrew life-sustaining treatment 27.4 35.8 8.4 (3.6 to 13.2) .001 Active shortening of the dying process 8.7 0.2 −8.5 (−10.4 to −6.6) <.001
Brain death 8.2 3.9 −4.3 (−6.7 to −1.9) .001
Southern vs Northern Region 1999-2000a
Failed CPR 27.5 13.8 −13.7 (−17.4 to −10.0) <.001
Withheld life-sustaining treatment 42.0 46.3 4.3 (−0.5 to 9.1) .08 Withdrew life-sustaining treatment 18.0 35.8 17.8 (13.4 to 22.2) <.001 Active shortening of the dying process 0.0 0.2 0.2 (−0.2 to 0.6) .31
Brain death 12.5 3.9 −8.6 (−11.0 to −6.2) <.001
Southern vs Central Region 1999-2000a
Failed CPR 27.5 20.5 −7.0 (−10.6 to −3.4) <.001
Withheld life-sustaining treatment 42.0 35.2 −6.8 (−10.9 to −2.7) .001 Withdrew life-sustaining treatment 18.0 27.4 9.4 (5.8 to 13.0) <.001 Active shortening of the dying process 0.0 8.7 8.7 (6.9 to 10.5) <.001
Brain death 12.5 8.2 −4.3 (−6.8 to −1.8) .001
Central vs Northern Region 2015-2016a
Failed CPR 7.2 4.0 −3.2 (−5.7 to −0.7) .03
Withheld life-sustaining treatment 45.6 49.5 3.9 (−1.9 to 9.7) .19 Withdrew life-sustaining treatment 43.1 44.3 1.2 (−4.5 to 6.9) .68 Active shortening of the dying process 1.1 0.0 −1.1 (−1.8 to −0.4) .04
Brain death 3.0 2.1 −0.9 (−2.7 to 0.9) .45
be decreasing due to increasing secularism in parts of Europe34 and greater international consensus for end-of-life practices.1 Many of the centers included in this study reported nu-merical or statistically significant increases in country end-of-life legislation and guidelines, ICU written end-end-of-life guide-lines, protocols and triggers for limitations, communication and bioethics courses, end-of-life discussions and deliberations about levels of care, palliative care and ethics consultations, and family meetings since 1999-2000. These changes re-sulted in significant, overall improvements in the ethical prac-tice score. Other factors associated with treatment limitation included physician religion,3,22patient age, and chronic dis-ease. The latter 2 factors were previously shown to contrib-ute to decisions to withhold ICU support.35
An important finding of this study was the higher sur-vival rates after limitations in life-prolonging therapies. Limi-tations occur not only at the end-of-life but also earlier to respect patient wishes and to avoid invasive therapies likely to prolong the dying process or result in poor quality of life. Death occurred more often after the actual withdrawal of life-sustaining treatments than after withholding potential future or present life-prolonging therapies. In 2015-2016, more patients survived after withholding mechanical ventilation, vasopressor use, and renal replacement therapy, which may reflect improved ICU practices with more patients surviving acute illnesses.
Previous end-of-life practice comparison studies show contradictory results. Between 1987 and 1993 Prendergast Table 4. Outcome of Patients With and Without Limitations of Life-Sustaining Treatments and First Limitations
(Withholding or Withdrawing of Life-Sustaining Treatments) for CPR, Endotracheal Tube, Mechanical Ventilation, Vasopressor, and Renal Replacement Therapy in 22 European Centers, 1999-2000 vs 2015-2016
Characteristics
No. of Patients Who Died/Total No. (%)
Difference (95% CI),% P Valuea
1999-2000 (n = 2807)
2015-2016 (n = 1785) Died without limitation of therapyb 889/889 (100.0) 184/184 (100.0)
Died with limitation of therapy 1812/1918 (94.5)
1274/1601 (79.6) −14.9 (−17.0 to −12.8) <.001 First limitation in patients with
withholding of life-sustaining treatmentc CPR 1635/1736 (94.2) 1151/1469 (78.4) −15.8 (−17.9 to −13.7) <.001 Endotracheal tube 120/168 (71.4) 205/349 (58.7) −12.7 (−15.5 to −9.9) .006 Mechanical ventilation 116/131 (88.5) 188/298 (63.1) −25.5 (−28.0 to −22.9) <.001 Vasopressor 393/412 (95.4) 340/429 (79.3) −16.1 (−18.2 to −14.1) <.001 Renal replacement therapy 432/440 (98.2) 397/543 (73.1) −25.1 (−27.2 to −23.0) <.001 First limitation in patients with
withdrawing of life-sustaining treatmentc CPR 45/46 (97.8) 18/18 (100.0) 2.2 (1.6 to 2.7) >.99 Endotracheal tube 30/30 (100) 130/137 (94.9) −5.1 (−6.1 to −4.1) .35 Mechanical ventilation 73/74 (98.6) 188/196 (95.9) −2.7 (−3.7 to −1.7) .45 Vasopressor 232/232 (100.0) 259/263 (98.5) −1.5 (−2.1 to −1.0) .13 Renal replacement therapy 97/97 (100.0) 81/81 (100.0)
Abbreviation: CPR, cardiopulmonary resuscitation.
a
P values were determined using a χ2
or Fisher exact test.
b
The Table presents study patients who lived or died with or without limitations. There were no patients who survived in the failed CPR or brain death categories (without limitations of therapies.)
cThe first limitation could, and not
infrequently did, involve withholding or withdrawing more than one life-sustaining treatment. Thus, the sum of the total of the first limitations may exceed the number of patients in whom life-sustaining treatment was withheld or withdrawn. Table 3. Changes in End-of-life Practices From 1999-2000 to 2015-2016 in 22 Intensive Care Units
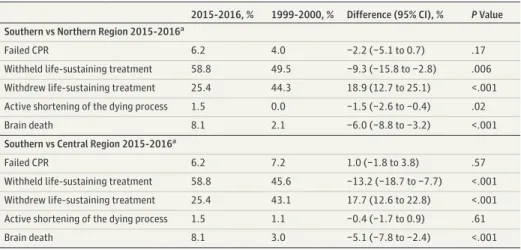
by European Region (continued)
2015-2016, % 1999-2000, % Difference (95% CI), % P Value Southern vs Northern Region 2015-2016a
Failed CPR 6.2 4.0 −2.2 (−5.1 to 0.7) .17
Withheld life-sustaining treatment 58.8 49.5 −9.3 (−15.8 to −2.8) .006 Withdrew life-sustaining treatment 25.4 44.3 18.9 (12.7 to 25.1) <.001 Active shortening of the dying process 1.5 0.0 −1.5 (−2.6 to −0.4) .02
Brain death 8.1 2.1 −6.0 (−8.8 to −3.2) <.001
Southern vs Central Region 2015-2016a
Failed CPR 6.2 7.2 1.0 (−1.8 to 3.8) .57
Withheld life-sustaining treatment 58.8 45.6 −13.2 (−18.7 to −7.7) <.001 Withdrew life-sustaining treatment 25.4 43.1 17.7 (12.6 to 22.8) <.001 Active shortening of the dying process 1.5 1.1 −0.4 (−1.7 to 0.9) .61
Brain death 8.1 3.0 −5.1 (−7.8 to −2.4) <.001
Abbreviation: CPR, cardiopulmonary resuscitation.
a
Column 2 displays the percentage value for the first-mentioned region, and column 3 displays the value for the second-mentioned region.
Table 5. Time Frames for Length of Stay to First Limitation, to Death After First Limitation, and for Withholding and Withdrawing of Life-Sustaining Therapy in Patients With End-of-Life Decisions, by Region and by Type of Limitation in 22 European Centers, 1999-2000 (n = 2807) and 2015-2016 (n = 1785)
Years of Cohort
Median (IQR)
Difference (95% CI)a P Valueb
1999-2000 2015-2016
Overall
Length of stay in the ICU, d 5.0 (1.0 to 13.0) 4.0 (1.0 to 11.0) −1.8 (−2.8 to −0.9) <.001
No. of patients 2799c 1785
Time from ICU admission to first limitation, d 4.0 (1.0 to12.3) 2.1 (0.3 to 7.5) −3.5 (−4.5 to −2.5) <.001
No. of patients 1891 1538
Time from first limitation of treatment until death, h 16.2 (3.6 to 57.0) 20.0 (3.0 to 87.9) −32.4 (−50.2 to 14.7) .08
No. of patients 1817 1274
Time from withholding life-sustaining therapy until death, h
14.1 (2.8 to 63.5) 29.0 (4.5 to 134.8) 54.2 (24.3 to 84.2) <.001
No. of patients 1034 581
Time from withdrawing life-sustaining therapy until death, h
17.1 (4.5 to 49.8) 11.5 (2.3 to 54.6) 26.7 (7.5 to 45.9) .02
No. of patients 686 676
Northern region
Length of stay in the ICU, d 3.0 (1.0 to 11.0) 4.0 (1.0 to 10.0) −0.99 (−2.64 to 0.66) .68
No. of patients 586 424
Time from ICU admission to first limitation, d 2.6 (0.6 to 9.9) 1.9 (0.4 to 6.9) −2.3 (−3.9 to −0.7) <.01
No. of patients 474 376
Time from first limitation of treatment until death, h 12.7 (3.6 to 41.5) 20.9 (3.5 to 69.7) −56.3 (−87.5 to −25.1) .04
No. of patients 471 335
Time from withholding life-sustaining therapy until death, h
9.6 (3.0 to 41.2) 35.0 (5.1 to 147.4) 79.9 (39.3 to 120.5) <.001
No. of patients 260 147
Time from withdrawing life-sustaining therapy until death, h
15.0 (4.6 to 43.0) 13.0 (3.3 to 30.9) 39.3 (−9.1 to 87.8) .22
No. of patients 206 188
Central region
Length of stay in the ICU, d 5.0 (2.0 to 15.0) 3.0 (1.0 to 9.0) −4.5 (−6.1 to 3.0) <.001
No. of patients 903 893
Time from ICU admission to first limitation, d 3.9 (0.8 to 14.0) 1.2 (0.1 to 5.1) 6.8 (−8.4 to −5.2) <.001
No. of patients 640 763
Time from first limitation of treatment until death, h 26.6 (5.8 to 92.6) 23.5 (2.7 to 115.4) −17.4 (−52.6 to 17.9) .13
No. of patients 578 569
Time from withholding life-sustaining therapy until death, h
32.7 (6.3 to 160.9) 57.0 (8.6 to 286.5) 39.7 (−42.8 to 122.2) .11
No. of patients 243 187
Time from withdrawing life-sustaining therapy until death, h
15.6 (5.0 to 51.6) 12.9 (1.9 to 75.7) 32.1 (4.7 to 59.6) .12
No. of patients 246 372
Southern region
Length of stay in the ICU, d 6.0 (2.0 to 14.0) 6.0 (2.0 to 18.0) 1.9 (0.1 to 3.7) .10
No. of patients 1310 468
Time from ICU admission to first limitation, d 5.6 (1.5 to 12.7) 5.0 (1.3 to 15.9) 1.0 (−0.9 to 2.8) .84
No. of patients 777 399
Time from first limitation of treatment until death, h 12.5 (2.0 to 50.5) 16.2 (3.0 to 62.1) −11.7 (−35.6 to 12.1) .14
No. of patients 768 370
Time from withholding life-sustaining therapy until death, h
11.0 (1.5 to 54.5) 18.5 (3.4 to 74.2) 23.9 (−9.8 to 57.6) .01
No. of patients 531 247
Time from withdrawing life-sustaining therapy until death, h
20.8 (4.0 to 50.1) 10.3 (2.5 to 32.7) −11.2 (−31.9 to 9.6) .12
No. of patients 234 116
a
Difference (95% CI) indicates difference of means, 2015-2016 minus 1999-2000 values.
bP values were determined by Mann-Whitney test.
c
Cell reports 2799 patients instead of 2807 because there were 8 patients with missing data.
and Luce demonstrated a 39% decrease in failed CPR and a 39% increase in withdrawing and withholding treatments in 2 US ICUs.36
McLean et al compared the mode of dying between 1988 and 1993 in 2 Canadian ICUs and found 23% and 34% increases in the withdrawal of life-sustaining treat-ments in the 2 ICUs.37Jakobson et al found no significant differences in CPR or withholding of life-prolonging thera-pies in an Israeli ICU between 1994 and 1999.38
The authors suggested that the lack of change was due to the already low CPR rate and high withholding rate. In a French single-center study by Lesieur et al, limitations increased by 16% from 2012 to 2016, while failed CPR decreased 36%.39
The present study found an increase from 1999 to 2016 of with-holding (9%) and withdrawing (14%) life-sustaining thera-pies, whereas failed CPR decreased (-16%).
The present study demonstrated that active shortening of the dying process is uncommon in the ICU. Despite increas-ing public approval, more countries permittincreas-ing euthanasia, and euthanasia increasing as the cause of death in the Nether-lands and Belgium,11,40there was a slight decrease in active shortening of the dying process in the study. This may be re-lated to physician reluctance to actively shorten the dying cess because ICU patients cannot express their wishes and pro-vide an explicit request, making this action illegal even in Belgium and the Netherlands where euthanasia is permitted. Euthanasia and active shortening of the dying process are not needed in the ICU because once caregivers and surrogates con-clude that ongoing interventions are not in the patient’s best interest, death typically ensues rather quickly after withdraw-ing life-prolongwithdraw-ing treatment.
Although some changes were statistically significant be-cause of the large numbers of patients, they were not clini-cally relevant, such as the decrease in active shortening of the dying process and ICU length of stay. Despite the fact that more ICUs in the southern region admitted patients, there were fewer patients admitted in the southern region in 2015-2016 than in 1999-2000 compared with the northern and central regions. This was most likely related to the much lower number of ICU beds and monthly admissions to ICUs in the southern region compared with ICUs in the northern and central regions.
Strengths of the study include its multinational nature, the large number of patients, use of the same centers and defini-tions, the same physicians being responsible for end-of-life de-cisions and data collection, methods to improve quality, the long time interval between studies, and the evaluation of changes in the study ICUs (especially ethical practices) in re-lation to end-of-life outcomes.
Limitations
This study has several limitations. First, this follow-up study includes only 59% of previous centers, different percentages of patients from the regions, and different physicians treat-ing many of the patients. Second, the majority of the ICUs were academically affiliated and may not be representative of Eu-ropean ICUs more generally. Third, while secular trends, chang-ing ethical views, and public awareness may be responsible for many of the changes observed, the study design did not al-low for direct assessment of how ethical principles and laws affect outcomes. Fourth, the data used to calculate the ethi-cal practice score were collected retrospectively and may be subject to recall bias and social desirability bias. Fifth, it re-mains possible that changes in admission case mix not ad-justed for in the analyses, or substantial changes in survival rates related to changes in organizational factors and quality of care, may be confounders responsible for some of the ob-served changes. Sixth, the number of patients not receiving in-dicated treatment limitations could not be determined.
Conclusions
Among patients who had treatment limitations or died in 22 European ICUs in 2015-2016, compared with data previously reported from the same ICUs in 1999-2000, limitations in life-prolonging therapies occurred significantly more frequently and death without limitations in life-prolonging therapies oc-curred significantly less frequently. Although these findings suggest a shift in end-of-life practices in European ICUs, the study is limited in that patients who survived ICU hospital-ization without treatment limitations were not included.
ARTICLE INFORMATION
Published Online: October 2, 2019. doi:10.1001/jama.2019.14608
Correction: This article was corrected online on November 5, 2019, for omitted author contributions. Author Affiliations: Department of
Anesthesiology, Critical Care Medicine, and Pain Medicine, Hadassah Medical Center, Hebrew University of Jerusalem, Jerusalem, Israel (Sprung, de la Guardia, Avidan); Department of
Anesthesiology, Pharmacology, and Intensive Care, University Hospital of Geneva, Geneva, Switzerland (Ricou); Department of Anesthesiology and Intensive Care Medicine, Charité Universitätsmedizin Berlin, Berlin and Klinik Bavaria, Kreischa, Germany (Hartog); Intensive Care Department, Hospital S. Antonio, Centro Hospitalar do Porto, Porto, Portugal (Maia); First Department of Intensive Care Medicine, University
of Athens Medical School, Evaggelsimos General Hospital, Athens, Greece (Mentzelopoulos); Clinic of Anaesthesiology, University Hospital Medical School, Ulm, Germany (Weiss); General Intensive Care Unit, Shaare Zedek Medical Center, Jerusalem, Israel (Levin); Intensive Care Unit, Hospital General Universitario de Castellón, Castellón de la Plana, Spain (Galarza); Inselspital, Department of Intensive Care Medicine, University of Bern, Switzerland (Schefold); The Hebrew University— Hadassah School of Public Health, Jerusalem, Israel (Baras); Department of Anaesthesia and Intensive Care, The Chinese University of Hong Kong, Hong Kong, China (Joynt); Department of Anesthesiology and Intensive Care, Holbaek University Hospital, Zealand Region, Denmark (Bülow); Department of Intensive Care Medicine, University of Ioannina, Ioannina, Greece (Nakos); Department of Anesthesiology, Perioperative Medicine, and Intensive Care, J.E. Purkinje University, Masaryk
Hospital Usti nad Labem, Czech Republic (Cerny); Medical Intensive Care, University of Basel Hospital, Basel, Switzerland (Marsch); Department of Intensive Care Medicine, VU Medical Center, Amsterdam, the Netherlands (Girbes); Intensive Care Medicine, University Hospitals K.U. Leuven, Leuven Belgium (Ingels); Mater Misericordiae University Hospital, Intensive Care Unit, Dublin, Ireland (Miskolci); Department of Anesthesiology and Intensive Care Medicine, University of Liege, Liege, Belgium (Ledoux); Critical Care Medicine,Tata Medical Center, Kolkata, India (Mullick);
Dipartimento di Scienze dell'Emergenza, Anestesiologiche e della Rianimazione, Fondazione Policlinico Universitario A. Gemelli IRCCS, Rome, Italy (Bocci); Department of Anesthesia and Intensive Care Medicine, Aarhus University Hospital, Aarhus, Denmark (Gjedsted); Intensive Care Unit, Hospital Universitario La Paz, Madrid, Spain (Estébanez, Fuciños); Critical Care
Department, The University of Texas MD Anderson Cancer Center, Houston (Nates); Intensive Care Unit, Saint Louis General Hospital, La Rochelle, France (Lesieur); Department of General Anesthesiology, Center for Critical Care Medicine, Cleveland Clinic, Cleveland, Ohio (Sreedharan); Division of Pediatric Anesthesia and Intensive Care, ASST Spedali Civili, Brescia, Italy (Giannini); Department of Intensive Care, Royal Berkshire Hospital, Berkshire, United Kingdom (Danbury); Department of Anesthesiology and Critical Care, Medizin Campus Bodensee-Tettnang Hospital, Tettnang, Germany (Michalsen); Department of Intensive Care, University Medical Center Utrecht, Utrecht, the Netherlands (Soliman); Intensive Care Department, University Hospital SAS of Jerez, Jerez de la Frontera, Spain (Estella).
Author Contributions: Drs Sprung and Avidan had full access to all the data in the study and take responsibility for the integrity of the data and the accuracy of the data analysis.
Concept and design: Sprung, Ricou, Hartog, Azevedo Maia, Weiss, Bulow, Nakos, Girbes, Nates, Michalsen, Avidan.
Acquisition, analysis, or interpretation of data: All authors.
Drafting of the manuscript: Sprung, Weiss, Levin, Galarza, Schefold, Joynt, Nakos, Miskolci, Bocci, Gjedsted, Estébanez-Montiel, Nates, Sreedharan, Cachafeiro Fuciños, Danbury, Soliman, Avidan. Critical revision of the manuscript for important intellectual content: Sprung, Ricou, Hartog, Azevedo Maia, Mentzelopoulos, Weiss, Levin, Galarza, de la Guardia, Schefold, Baras, Joynt, Bulow, Nakos, Cerny, Marsch, Girbes, Ingels, Miskolci, Ledoux, Mullick, Gjedsted, Nates, Lesieur, Giannini, Cachafeiro Fuciños, Danbury, Michalsen, Soliman, Estella, Avidan.
Statistical analysis: Levin, de la Guardia, Baras, Gjedsted, Avidan.
Administrative, technical, or material support: Sprung, Ricou, Hartog, Weiss, Levin, de la Guardia, Schefold, Joynt, Cerny, Ledoux, Bocci, Gjedsted, Nates, Sreedharan, Cachafeiro Fuciños, Danbury, Michalsen, Avidan.
Supervision: Sprung, Ricou, Weiss, de la Guardia, Joynt, Nakos, Girbes, Ingels, Miskolci, Bocci, Gjedsted, Estébanez-Montiel, Nates, Estella, Avidan.
Other - country coordination for Switzerland: Ricou. Other - eFigure 1: Mullick.
Group Information: The ETHICUS-2 Study Group: Scientific Coordinating Center (Israel)—C.L. Sprung (coordinator), R. Bernstein (administrator), A. Avidan (internet webmaster and database manager), M. Baras (statistician), V. de la Guardia (quality assurance). Steering Committee— C.L. Sprung (chair), M. Anstey, A. Avidan, E. Azoulay, J. Benbenishty, D. Bin, D. Cook, R. Curtis, C. Feldman, C.S. Hartog, G.M. Joynt, M. Kainuma, M. Levy, R.K. Mani, A. Michalsen, B. Ricou, M. Soares, R. Truog. Investigators from 22 centers of the Ethicus comparison study—Belgium: D. Ledoux (center coordinator), University of Liège, Liège; C. Ingels (center coordinator), University Hospital Gasthuisberg, Leuven. Czech Republic: V. Cerny (center coordinator), J. Benes, J. Jobanek, T. Parizek, Aro Masarykova Nemonice, Usti nad Labem. Denmark: J. Gjedtsted (center coordinator), Arhus University Hospital, Arhus. Germany: C.S. Hartog (center coordinator), I.A. Anca, P. Bloos, A. Haucke, S. Kharel, S. Kolanos, H. Kunsch, S. Schwarzkopf, Jena University Hospital, Jena.
Greece: S. Zakynthinos (center coordinator), S. Mentzelopoulos, A. Kotanidou, S. Kokkoris, I. Pantazopoulos, G. Karlis, Evaggelsimos General Hospital, Athens; C. Mathas (center coordinator), Agia Olga Hospital of Nea Ionia, Athens; G Nakos (center coordinator), V. Koulouras, G. Papathanakos, University Hospital of Ioannina, Ioannina. Ireland: O. Miskolci (center coordinator), C. O'Loughlin, Mater Hospital, University College, Dublin. Israel: C.L. Sprung (center coordinator), A. Avidan, V. de la Guardia, A. Farran,
V. Van Heerden, Hadassah Medical Center, Hebrew University of Jerusalem, Jerusalem; M. Klein (center coordinator), E. Brotfain, Soroka Hospital, Beer-Sheva; P. Levin (center coordinator), N. Alon, Shaarei Zedek Medical Center, Jerusalem. Italy: A. Palo (center coordinator), S. Cortesi, S. Guarisco, Policlinico San Matteo, Pavia. The Netherlands: A. Girbes (center coordinator), E. Alberts, VU Hospital, Amsterdam. Portugal: P. Maia (center coordinator), Hospital Geral Santo Antonio, Porto; L. Bento (center coordinator), Hospital de S. Jose, Lisboa. Spain: J.M.G. Garcia (center coordinator), I. Saralegui, Hospital Gregorio Maradon, Madrid; B. Vidal Tegedor (center coordinator), L. Galarza, Hospital General Universitario de Castellon, Castellon. Switzerland: B. Ricou (center coordinator), G. Auzou, Hopital Cantonal Universitaire de Geneve, Geneva; S. Marsch (center coordinator), K. Tisljar, Kantosspital Basel, Basel. Turkey: F. Esen (center coordinator), P.E. Ozcan, O. Yenigun, University of Istanbul, Istanbul. United Kingdom: D. Brealey (center coordinator), R. Stoyanova, K. Tam, University College London, London.
Conflict of Interest Disclosures: Dr Hartog reports receipt of grants to her institution from the German Federal Ministry of Education and Research (BMBF) via the Center for Sepsis Control and Care, German Innovations Funds/Federal Joint Committee, and the European Society of Intensive Care Medicine. Dr Schefold reports receipt of grants (all paid into departmental accounts) from Orion Pharma, Abbott Nutrition International, B. Braun Medical AG, CSEM AG, Edwards Lifesciences Services GmbH, Kenta Biotech, Maquet Critical Care AB, Omnicare Clinical Research AG, Nestle, Pierre Fabre Pharma AG, Pfizer, Bard Medica S.A., Abbott AG, Anandic Medical Systems, Pan Gas AG Healthcare, Bracco, Hamilton Medical AG, Fresenius Kabi, Getinge Group Maquet AG, Dräger AG, Teleflex Medical GmbH, Glaxo Smith Kline, Merck Sharp and Dohme AG, Eli Lilly and Company, Baxter, Astellas, Astra Zeneca, CSL Behring, Novartis, Covidien, and Nycomed outside the submitted work. No additional disclosures were reported. Funding/Support: This study was funded by the Walter F. and Alice Gorham Foundation. Role of the Funder/Sponsor: The Walter F. and Alice Gorham Foundation had no part in the design and conduct of the study; collection, management, analysis, and interpretation of the data; preparation, review, or approval of the manuscript; and decision to submit the manuscript for publication.
Meeting Presentation: Presented at the European Society for Intensive Care Medicine’s annual congress; October 2, 2019; Berlin, Germany.
REFERENCES
1. Sprung CL, Truog RD, Curtis JR, et al. Seeking worldwide professional consensus on the principles of end-of-life care for the critically ill: the Consensus for Worldwide End-of-Life Practice for Patients in
Intensive Care Units (WELPICUS) study. Am J Respir Crit Care Med. 2014;190(8):855-866. doi:10.1164/ rccm.201403-0593CC
2. Mark NM, Rayner SG, Lee NJ, Curtis JR. Global variability in withholding and withdrawal of life-sustaining treatment in the intensive care unit: a systematic review. Intensive Care Med. 2015;41 (9):1572-1585. doi:10.1007/s00134-015-3810-5 3. Sprung CL, Cohen SL, Sjokvist P, et al; Ethicus Study Group. End-of-life practices in European intensive care units: the Ethicus Study. JAMA. 2003;290(6):790-797. doi:10.1001/jama.290.6.790 4. Devictor DJ, Tissieres P, Gillis J, Truog R; WFPICCS Task Force on Ethics. Intercontinental differences in end-of-life attitudes in the pediatric intensive care unit: results of a worldwide survey. Pediatr Crit Care Med. 2008;9(6):560-566. doi:10. 1097/PCC.0b013e31818d3581
5. Council of Europe. Guide on the decision-making process regarding medical treatment in end-of-life situations.https://www.coe.int/t/dg3/
healthbioethic/conferences_and_symposia/Guide% 20FDV%20E.pdf. Accessed August 30, 2018. 6. Truog RD, Campbell ML, Curtis JR, et al; American Academy of Critical Care Medicine. Recommendations for end-of-life care in the intensive care unit: a consensus statement by the American College [corrected] of Critical Care Medicine. Crit Care Med. 2008;36(3):953-963. doi: 10.1097/CCM.0B013E3181659096
7. Cherny NI, Radbruch L; Board of the European Association for Palliative Care. European Association for Palliative Care (EAPC)
recommended framework for the use of sedation in palliative care. Palliat Med. 2009;23(7):581-593. doi:10.1177/0269216309107024
8. Bossaert LL, Perkins GD, Askitopoulou H, et al; Ethics of Resuscitation and End-of-Life Decisions Section Collaborators. European Resuscitation Council Guidelines for Resuscitation 2015: section 11, the ethics of resuscitation and end-of-life decisions. Resuscitation. 2015;95:302-311. doi:10. 1016/j.resuscitation.2015.07.033
9. Downar J, Delaney JW, Hawryluck L, Kenny L. Guidelines for the withdrawal of life-sustaining measures. Intensive Care Med. 2016;42(6):1003-1017. doi:10.1007/s00134-016-4330-7
10. Davidson JE, Aslakson RA, Long AC, et al. Guidelines for family-centered care in the neonatal, pediatric, and adult ICU. Crit Care Med. 2017;45(1): 103-128. doi:10.1097/CCM.0000000000002169 11. Emanuel EJ, Onwuteaka-Philipsen BD, Urwin JW, Cohen J. Attitudes and practices of euthanasia and physician-assisted suicide in the United States, Canada, and Europe. JAMA. 2016;316(1):79-90. doi: 10.1001/jama.2016.8499
12. Kon AA, Davidson JE, Morrison W, Danis M, White DB; American College of Critical Care Medicine; American Thoracic Society. Shared decision making in ICUs: an American College of Critical Care Medicine and American Thoracic Society Policy Statement. Crit Care Med. 2016;44 (1):188-201. doi:10.1097/CCM.0000000000001396 13. Steinberg A, Sprung CL. The dying patient: new Israeli legislation. Intensive Care Med. 2006;32(8): 1234-1237. doi:10.1007/s00134-006-0186-6 14. Sulmasy DP. Italy’s New advance directive law: when in Rome…. JAMA Intern Med. 2018;178(5): 607-608. doi:10.1001/jamainternmed.2018.0462
15. Socialstyrelsen. To give or not to give life support. Sweden: The National Board on health and Welfare 2011.https://www.socialstyrelsen.se/ globalassets/sharepoint-dokument/artikelkatalog/ kunskapsstod/2011-6-39.pdf. Accessed September 22, 2019.
16. Danish Patient Safety Authority. A guide on withholding life support, resuscitation and withdrawing of treatment.https://stps.dk/da/ udgivelser/2012/vejledning-om-forudgaaende- fravalg-af-livsforlaengende-behandling,-herunder- genoplivningsforsoeg,-og-om-afbrydelse-af-behandling. Accessed August 30, 2018. 17. The Norwegian Directorate of Health. Decision-making process when limiting
life-sustaining treatment.https://helsedirektoratet. no/retningslinjer/beslutningsprosesser-ved-begrensning-av-livsforlengende-behandling. Accessed August 30, 2018.
18. Valentin A, Druml W, Steltzer H, Wiedermann CJ. Recommendations on therapy limitation and therapy discontinuation in intensive care units: consensus paper of the Austrian Associations of Intensive Care Medicine. Intensive Care Med. 2008;34(4):771-776. doi:10.1007/ s00134-007-0975-6
19. Bosslet GT, Pope TM, Rubenfeld GD, et al; American Thoracic Society ad hoc Committee on Futile and Potentially Inappropriate Treatment; American Thoracic Society; American Association for Critical Care Nurses; American College of Chest Physicians; European Society for Intensive Care Medicine; Society of Critical Care. An official ATS/AACN/ACCP/ESICM/SCCM policy statement: responding to requests for potentially inappropriate treatments in intensive care units. Am J Respir Crit Care Med. 2015;191(11):1318-1330. doi:10.1164/rccm.201505-0924ST
20. Myburgh J, Abillama F, Chiumello D, et al; Council of the World Federation of Societies of Intensive and Critical Care Medicine. End-of-life care in the intensive care unit: report from the Task Force of World Federation of Societies of Intensive and Critical Care Medicine. J Crit Care. 2016;34:125-130. doi:10.1016/j.jcrc.2016.04.017
21. Sullivan AM, Lakoma MD, Billings JA, Peters AS, Block SD; PCEP Core Faculty. Teaching and learning end-of-life care: evaluation of a faculty
development program in palliative care. Acad Med. 2005;80(7):657-668. doi: 10.1097/00001888-200507000-00008
22. Bülow HH, Sprung CL, Baras M, et al. Are religion and religiosity important to end-of-life decisions and patient autonomy in the ICU? the Ethicatt study. Intensive Care Med. 2012;38(7):1126-1133. doi:10.1007/s00134-012-2554-8
23. Kranidiotis G, Ropa J, Mprianas J, Kyprianou T, Nanas S. Attitudes towards euthanasia among Greek intensive care unit physicians and nurses. Heart Lung. 2015;44(3):260-263. doi:10.1016/j. hrtlng.2015.03.001
24. Lobo SM, De Simoni FHB, Jakob SM, et al; ICON investigators. Decision-making on withholding or withdrawing life support in the ICU: a worldwide perspective. Chest. 2017;152(2):321-329. doi:10. 1016/j.chest.2017.04.176
25. Burns JP, Truog RD. The DNR order after 40 years. N Engl J Med. 2016;375(6):504-506. doi:10. 1056/NEJMp1605597
26. Braus N, Campbell TC, Kwekkeboom KL, et al. Prospective study of a proactive palliative care rounding intervention in a medical ICU. Intensive Care Med. 2016;42(1):54-62. doi: 10.1007/s00134-015-4098-1
27. O’Mahony S, McHenry J, Blank AE, et al. Preliminary report of the integration of a palliative care team into an intensive care unit. Palliat Med. 2010;24(2):154-165. doi:10.1177/0269216309346540 28. White DB, Angus DC, Shields A-M, et al; PARTNER Investigators. A randomized trial of a family-support intervention in intensive care units. N Engl J Med. 2018;378(25):2365-2375. doi:10. 1056/NEJMoa1802637
29. Curtis JR, Treece PD, Nielsen EL, et al. Randomized trial of communication facilitators to reduce family distress and intensity of end-of-life care. Am J Respir Crit Care Med. 2016;193(2):154-162. doi:10.1164/rccm.201505-0900OC
30. Johnson RF Jr, Gustin J. Acute lung injury and acute respiratory distress syndrome requiring tracheal intubation and mechanical ventilation in the intensive care unit: impact on managing uncertainty for patient-centered communication. Am J Hosp Palliat Care. 2013;30(6):569-575. doi:10. 1177/1049909112460566
31. Herridge MS, Tansey CM, Matté A, et al; Canadian Critical Care Trials Group. Functional disability 5 years after acute respiratory distress syndrome. N Engl J Med. 2011;364(14):1293-1304. doi:10.1056/NEJMoa1011802
32. Ntantana A, Matamis D, Savvidou S, et al. The impact of healthcare professionals’ personality and religious beliefs on the decisions to forego life sustaining treatments: an observational, multicentre, cross-sectional study in Greek intensive care units. BMJ Open. 2017;7(7):e013916. doi:10.1136/bmjopen-2016-013916
33. Phua J, Joynt GM, Nishimura M, et al; ACME Study Investigators; Asian Critical Care Clinical Trials Group. Withholding and withdrawal of
life-sustaining treatments in low-middle-income versus high-income Asian countries and regions. Intensive Care Med. 2016;42(7):1118-1127. doi:10. 1007/s00134-016-4347-y
34. Norris P, Inglehart R. Sacred and Secular: Religion and Politics Worldwide. Cambridge, England: Cambridge University Press; 2004. doi:10.1017/ CBO9780511791017
35. Gopalan PD, Pershad S. Decision-making in ICU—a systematic review of factors considered important by ICU clinician decision makers with regard to ICU triage decisions. J Crit Care. 2019;50: 99-110. doi:10.1016/j.jcrc.2018.11.027
36. Prendergast TJ, Luce JM. Increasing incidence of withholding and withdrawal of life support from the critically ill. Am J Respir Crit Care Med. 1997; 155(1):15-20. doi:10.1164/ajrccm.155.1.9001282 37. McLean RF, Tarshis J, Mazer CD, Szalai JP. Death in two Canadian intensive care units: institutional difference and changes over time. Crit Care Med. 2000;28(1):100-103. doi: 10.1097/00003246-200001000-00016
38. Jakobson DJ, Eidelman LA, Worner TM, Oppenheim AE, Pizov R, Sprung CL. Evaluation of changes in forgoing life-sustaining treatment in Israeli ICU patients. Chest. 2004;126(6):1969-1973. doi:10.1378/chest.126.6.1969
39. Lesieur O, Herbland A, Cabasson S, Hoppe MA, Guillaume F, Leloup M. Changes in limitations of life-sustaining treatments over time in a French intensive care unit: a prospective observational study. J Crit Care. 2018;47:21-29. doi:10.1016/j.jcrc. 2018.05.018
40. Sprung CL, Somerville MA, Radbruch L, et al. Physician-assisted suicide and euthanasia: emerging issues from a global perspective. J Palliat Care. 2018;33(4):197-203. doi:10.1177/