Motion of rigid particles flowing in a microfluidic device with a pronounced stenosis:
Trajectories and deformation index
11th World Congress on Computational Mechanics (WCCM XI) 5th European Conference on Computational Mechanics (ECCM V) 6th European Conference on Computational Fluid Dynamics (ECFD VI) E. Oñate, J. Oliver and A. Huerta (Eds)
MOTION OF RIGID PARTICLES FLOWING IN A MICROFLUIDIC
DEVICE WITH A PRONOUNCED STENOSIS: TRAJECTORIES AND
DEFORMATION INDEX
DIANA PINHO*†
¥
, RAQUEL O. RODRIGUES*
¥
, TOMOKO YAGINUMA*, VERA FAUSTINO*, DAVID BENTO*†, CARLA S. FERNANDES*, VALDEMAR GARCIA*,
ANA I. PEREIRA*◊, RUI LIMA*† *
ESTiG, Polytechnic Institute of Bragança C. Sta. Apolónia
5301-857 Bragança, Portugal
e-mail: [email protected], [email protected], [email protected], [email protected]
†
CEFT, Faculty of Engineering, University of Porto, R. Dr. Roberto Frias,
4200-465 Porto, Portugal
e-mail: [email protected], [email protected], [email protected]
◊
Algoritmi, Universidade do Minho, Campus Azurém,
4800-058 Guimarães, Portugal e-mail: [email protected]
¥
Both authors contributed equally to this work
Key Words: Rigid particles, Red blood cells, Microchannel with stenosis, Trajectories, Deformation index.
1 INTRODUCTION
The study of the blood flow behaviour in stenosis has been extensively investigated [1-3], due to the important role that the fluid dynamics plays in the progress of diseases, such as, arteriosclerosis or infarcts [4]. The World Health Organization (WHO) estimates that 17.3 million people died in 2008, from cardiovascular diseases and the number will continue to grow up until 2030, when an estimated of 23.3 million deaths annually is predicted [5].
At the same time, it is known that red blood cells (RBCs) rigidity has been correlated with myocardial infection, hypertension, diabetes mellitus, and others haematological disorders and diseases that affect RBCs deformation [7]. Therefore, flow studies with rigid Red Blood Cells (rRBCs) [6] or with artificial rigid Red Blood Cells (arRBCs) with dimensions close to human RBCs needs to be investigated, due to the important role that they play in clarifying the hemodynamic behaviour of these diseased cells.
In small arteries, in order of 100 µm or less, blood is assumed no longer as a homogeneous fluid, but as a multi-phase fluid. For these cases, the blood may be modelled as a suspension of RBCs in plasma and individual cells motion need to be investigated [4]. These kind of studies are essential not only as an attempt to understand the blood flow behaviour in microcirculation, but also to develop microfluidic devices, as an alternative clinical methodology to detect blood diseases.
In order to clarify the flow behaviour of both healthy and rRBCs when subjected to high shear rates, we have investigated the trajectories and deformation index (DI) of healthy ovine RBCs and an arRBCs in a microchannel with a pronounced microstenosis (75%).
2 MATERIALS AND METHODS
2.1 Working fluids and microchannel geometry
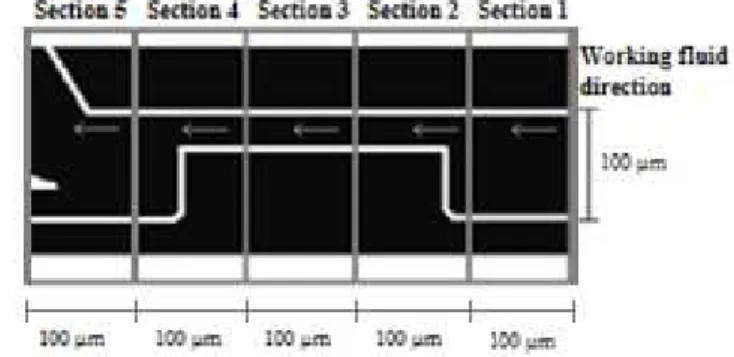
A standard soft lithography technique was used to fabricate microchannels in polydimethylsiloxane (PDMS) [8, 9]. Figure 1 represents a scheme of the geometry of the microchannel used in the present study. The scheme also shows the five sections taken in the microchannel with 100 µm each to measure the DI along the stenosis device.
Figure 1: Scheme of the microchannel stenosis device.
abnormal rigid RBCs mixed with 1% Haematocrit (Hct) of healthy ovine RBCs (± 5 µm). The in vitro blood used was collected from a healthy ovine, where ethylenediaminetetraacetic acid (EDTA) was added to prevent coagulation. All samples were stored hermetically at 4ºC until experiments be performed at room temperature (20±2ºC).
In brief, the RBCs were separated from the bulk blood by centrifuging at 2000 RPM for 15 minutes at room temperature. After removing the buffy coat and plasma, the packed RBCs were then re-suspended, centrifuged and washed twice in physiological salt solution (PSS) 0.9%. Finally, the result packed RBCs were re-suspended in Dextran 40 at Hct 1% and a 0.5% of Polystyrene (PS) latex microspheres were added, in order to simulate the abnormal rigid RBCs. The work fluid was used immediately in our experiments.
2.2 High-speed video microscopy system
The high-speed video microscopy system used in the present study consisted in an inverted microscope (IX71, Olympus) combined with a high-speed camera (FASTCAM SA3, Photron). The PDMS microchannel was placed on the stage of the microscope where the flow rate of the working fluid was kept constant at 1, 10 or 20 µl/min, using a syringe pump (PHD ULTRA) with a 1 ml syringe (TERUMO ® SYRING).
The images of the flowing RBCs and arRBCs were captured using the high speed camera at a frame rate of 7500 frames/s and shutter at 1/50000, this latter parameter aims to reduce potential errors caused by the camera’s exposure time. The recording videos were then transferred to a computer to perform image analysis.
2.3 Image analysis
The images were processed and analysed by an image handling software, ImageJ (1.46r, NIH). To measure the DI of the RBCs and arRBCs, a background image was created from the original stack images by averaging each pixel over the sequence of static images. Next, the background image was subtracted from the original images, resulted in elimination of all the static objects. After that, several image filtering operations, such as, Medium operation was applied to obtain better image quality. Finally, the grey scale images were converted to binary images adjusting the Threshold level. After the binarization, the flowing RBCs and arRBCs were measured frame by frame manually, by using the Analyze Particles function, in ImageJ software. This way, the major and minor axis lengths of the RBC binary shapes (ellipsoids) were obtained and the DI calculated.
The DI equation we use for characterizing RBCs is defined as follows, in Equation 1:
DI =
(1)
where, Lmajor and Lminor represent the major and minor axis length, respectively.
Sample cells were selected to track at three fixed positions, upper wall, middle channel and lower wall of the microchannel device, so a representative behaviour of the RBCs and arRBCs trajectories could be taken.
3 RESULTS AND DISCUSSIONS
3.1 Deformation index of rigid RBCs and healthy RBCs
Firstly, we have investigated the behaviour of the DI of arRBCs and healthy RBCs when flowing at different flow rates (1, 10, 20 µl/min). The results in Figure 2 show that for both RBCs (rigid and healthy) the maximum DI was obtained at the highest flow rate in study (20 µl/min), at the stenosis zone, represented by the sections 2, 3 and 4.
As expected, healthy RBCs had higher DIs when compared with arRBCs at all flow rates in study. At 20 µl/min, healthy RBCs obtaining a maximum DI of 0.38 instead of the 0.09 obtained by the arRBCs, which represent a 38% and 9% of deformation, respectively.
Figure 2: DI obtained in the five section of the stenosis´s microchannel at different flow rates a) arRBCs; b) Healthy ovine RBCs. Error bars represents a 95% confidence interval.
3.2 Trajectories of rigid RBCs and healthy RBCs
Subsequently, we investigated the trajectories of both RBCs, healthy and rigid, at the same flow rates used to determine the DI.
In order to evaluate a representative behaviour of the sample cells along the microchannel, we selected three fixed positions, namely lower, middle and upper wall.
The results presented in Figure 3 show that rigid and healthy RBCs, represented by (a) and (b), respectively, have a slightly shift in their trajectories at the three fixed positions, when compared between them. It can also be observed that the flow rate has influence in the trajectory of both cells (rigid and healthy) at the middle position of the microchannel, this impact being more evident for the healthy RBCs. However, this influence is not so evident for the tracked positions along the walls (upper and lower wall), where the shear flow, is near to zero.
Figure 3: Graphic representation of the trajectories obtained from arRBCs and healthy RBCs in three fixed position (lower, middle and upper wall) of the stenosis’s microchannel at different flow rates. (a) arRBCs; (b)
Healthy ovine RBCs
Figure 4: Comparison of trajectories between healthy and rigid RBCs on the middle position of the microchannel at different flow rates.
4 CONCLUSIONS
The presented results show that the existence of a pronounced stenosis in a microchannel has a strong influence in the motion of blood cells, when they are analysed at a low haematocrit. Also, we demonstrate that healthy RBCs and arRBCs, represented in our study by PS latex microspheres, had a different behaviour when subject a different flow rates. This motion differences can be extremely important on the development of a microfluidic device to detect early stage blood diseases.
ACKNOWLEDGMENT
The authors acknowledge the financial support provided by PTDC/SAU-BEB/105650/2008, PTDC/EME-MFE/099109/2008, PTDC/SAU-ENB/116929/2010, EXPL/EMS-SIS/2215/2013, scholarship SFRH/BD/91192/2012 and scholarship SFRH/BD/89077/2012 from FCT (Science and Technology Foundation), COMPETE, QREN and European Union (FEDER).
REFERENCES
[1] Pinho, D., et al., A microfluidic device for partial cell separation and deformability assessment BioChip Journal (2013) 7(4):367-374
[2] Lima, R, et al., Development of a Microfluidic Device for Partial Cell Separation. Japan-Portugal Nano-BME Symposium (2009), Porto/Braganca, Japan-Portugal, 3-6 June
[3] Pinho, D., et al., Visulaization of the cell-free layer (CFL) in a PDMS microchannel with a micro-stenosis. In: Prespectives in Fundamental and Applied Rheology, Rubio-Hernandez, F.J., et al. (Eds), 2nd Edition (2013) 363-367
[4] Fujiwara, H., et al., Red blood cell motion in high-hematocrit blood flowing through a stenosed microchannel. Journal of Biomechanics (2009) 42:838-843
[6] Rodrigues, R.O., et al., Separation and deformation of red blood cells in PDMS microchannels. In: Perspectives in Fundamental and Applied Rheology, Rubio-Hernandez, F.J., et al. (Eds), 2nd Edition (2013) 407- 413
[7] Rodrigues, R., et al., Red Blood Cells deformability index assessment in a hyperbolic microchannel: the diamide and glutaraldehyde effect. WebmedCentral plus BIOMEDICAL ENGINEERING (2014) 5(1):WMCPLS00253. [8] Lima, R., et al., In vitro blood flow in a rectangular PDMS microchannel: experimental
observations using a confocal micro-PIV system. Biomedical Microdevices (2008) 10: 153-167.