Analysis of Perceived Benefits and
Potential Costs to Users in Co-Creation:
Examining users that opt out of co-creation
Katherina Ann Horváth 152114208
Dissertation written under the supervision of Professor Claudia Costa
Dissertation submitted in partial fulfilment of requirements for the International MSc in Management, at the Universidade Católica Portuguesa, August 31st 2016.
A
BSTRACTTitle: Analysis of Perceived Benefits and Potential Costs to Users in Co-Creation: Examining users that opt out of co-creation
Author: Katherina Ann Horváth
Successful customer co-creation results in higher firm profitability and greater efficiencies. Firms strategically increase customer co-creation activities to generate novel solutions that would otherwise go uncaptured. Despite the benefits of co-creation, the literature leaves the users’ attitude and profile unexplored and wholly overlooks possible cost to users in participation.
This thesis aims to better understand the differences between users that opt in and out of co-creation by analyzing potential costs of participation (in terms of time, risk and effort) and analyzing the perceived benefits that influences and (de)motivates users to co-create. The perceived benefits tested include hedonic, utility and individualism benefits, and user perceptions of fairness in value distribution. Demographic variables were tested for profile building purposes. Independent-samples t-test and Chi-square tests were employed to compare and contrast users’ likelihood of participation and evaluate mean scores of each variable. Data was collected through an online questionnaire was administered to 231 participants. Results determined that the perceived benefits are statistically significant thus effect users’ likelihood of participation and that the higher the perceived cost in participation, the less likely a user is to participate. These findings hold implications for how firms should approach co-creation design and how they should structure marketing communications to increase participation rates.
O
R
ESUMOTitulo: Análise da perceção dos utilizadores de cocriação relativamente aos benefícios e custos inerentes a estes processos: A perspetiva dos utilizadores que optam por não recorrer a processos de cocriação.
Autor: Katherina Ann Horváth
Processos de cocriação bem-sucedidos resultam na criação de valor através de modelos mais lucrativos e eficientes. A opção de recorrer a processos de cocriação com o envolvimento do cliente faz parte de uma decisão estratégica da empresa que procura capturar valor através da geração de novas soluções com particularidades que de outra forma não seria capturadas. Apesar dos benefícios, a literatura académica conclui que o perfil do utilizador é muito diversificado e pouco explorado. Para além disso, muitos dos custos de implementação e utilização destes processos não serem contemplados.
Esta tese tem como objetivo fazer uma análise detalhada sobre a diferença entre os utilizadores que optam e os que não optam por recorrer a processos de cocriação, analisando potencias custos de participação (em termos de tempo, risco e dedicação) e diferenciando potenciais benefícios. Os eventuais benefícios que foram testados incluem hedonismo, utilidade e benefícios individuais, e a perceção de justiça por parte do utilizador relativamente à forma como o valor gerado é distribuído entre as partes envolvidas. Variáveis demográficas ou perfis específicos foram testados.
De forma a comparar e contrastar a probabilidade de participação dos utilizadores e avaliar as médias de cada variável foram realizadas amostras independentes através de métodos estatísticos, t-test e qui-quadrado. As amostras recolhidas foram obtidas através de um questionário online realizado a 231 participantes. Os resultados concluem que a perceção relativamente aos benefícios gerados por cocriação é estatisticamente significativa bem como a probabilidade de participação nestes processos. Para além disso, concluiu-se que quanto maior é a perceção relativamente aos custos necessários à cocriação, menor é a disponibilidade do utilizador para participar. Estes resultados providenciam alguns insights sobre como a empresa deve estabelecer processos de cocriação e como deve estruturar a sua comunicação para aumentar o número de participantes.
Keywords: perceção de benefícios, perceção de custos, cocriação com clientes, envolvimento do cliente
T
ABLE OFC
ONTENTS Abstract ... 2 O Resumo... 3 List Of Figures ... 6 List Of Tables... 7 Acknowledgements ... 8 1 Introduction ... 9 1.1 Open Innovation... 9 1.2 Co-Creation ... 9 1.3 Aims ... 102 Literature Review And Hypothesis Development ... 12
2.1 Innovation Model ... 12
2.1.1 Closed Innovation Model... 12
2.1.2 Open Innovation Model ... 12
2.2 Active Role Of The Customer ... 13
2.2.1 Emerging Concept Of A Market ... 14
2.2.2 Co-Creation Breadth ... 15
2.3 Customer Co-Creation ... 16
2.3.1 Customer Co-Creation Typologies ... 17
2.4 The Value Of Co-Creation ... 18
2.5 Hypotheses Development ... 20
2.6 The Costs Co-Creation... 23
2.7 Individual Characteristics ... 25 3 Methodology ... 26 3.1 Design ... 26 3.2 Measures ... 28 3.2.1 Perceived Benefit ... 28 3.2.2 Potential Cost ... 30 3.2.3 Profile Measures ... 30 4 Results ... 32 4.1 Sample Characteristics ... 32
4.2 Perceived Benefit Results ... 33
4.3 Potential Cost Results ... 35
4.4 Profile Building Results ... 37
5 Discussion ... 39
5.1.1 Perceived Benefits Discussion ... 39
5.1.2 Potential Cost Discussion ... 40
5.1.3 Individual Characteristics Discussion ... 40
5.2 Theoretical Implications ... 41
5.3 Managerial Implications ... 41
6.1 Limitations ... 44 6.2 Future Research... 45 7 Bibliography... 46 8 Appendix ... 56 8.1 Questionnaire ... 56 8.2 Reliability Statistics ... 61
L
IST OFF
IGURESFigure 1: Process Model For Leveraging External Sources Of Innovation (West & Bogers, 2014)
... 9
Figure 2: Closed Versus Open Innovation Process (Simic, 2013)... 13
Figure 3: Traditional Concept Of A Market (Prahalad & Ramaswamy, 2004) ... 15
Figure 4: Emerging Concept Of A Market (Prahalad & Ramaswamy, 2004) ... 15
L
IST OFT
ABLESTable 1: Likelihood Of Participation Descriptive Statistics ... 27
Table 2: Benefit Variable Group Statistics ... 34
Table 3: Benefit Variables - Independent Samples T-Test ... 35
Table 4: Cost Variable Group Statistics... 36
Table 5: Time Independent Samples T-Test ... 36
Table 6: Statistical Significance Differences Of Chi-Squared Tests In Profile ... 38
Table 7: General Characterizes Of Sample... 62
Table 8: Cronbach’s Alpha Coefficients Summary ... 61
A
CKNOWLEDGEMENTSI would first like to thank my supervisor Professor Cláudia Costa, from Nova School of Business and Economics, for her support and guidance through this new and challenging process. Her assistance in helping me define my research topic, advising me on major challenges as well as providing detailed constructive feedback helped shape my thesis.
Secondly, I’d like to thank my parents for supporting me both financially and emotionally during my studies abroad.
Lastly, I’m thankful to all the peers and professors from all backgrounds I had the pleasure of studying alongside during these two years in four separate countries, truly a remarkable Master’s program!
1 I
NTRODUCTION1.1 OPEN INNOVATION
The foundation of open innovation is based on the idea that users will freely share their creative inputs and firms will capture value by leveraging those inputs (Franke, et al., 2013); (Chesbrough, 2006). It is an understanding that not all ideas come from within. Therefore firms must look outside themselves to take advantage of the abundance new research and advancements available. Through open innovation firms can expand their research and development (R&D) department’s responsibilities to include both an internal and external knowledge exchange.
The traditional business models operate under the acceptance that all ideas and projects are generated from within the firm (Chesbrough, 2006); (Prahalad & Ramaswamy, 2004). The open innovation paradigm inverts this notion and requires firms to rely on the wealth of knowledge outside the firm resulting in a more open and robust model of innovation. Firms can now innovate at a more accelerated and effective pace while having lower R&D costs, which translates into increased profits and lower costs (Gemser & Perks, 2015); (Chesbrough, 2011).
1.2 CO-CREATION
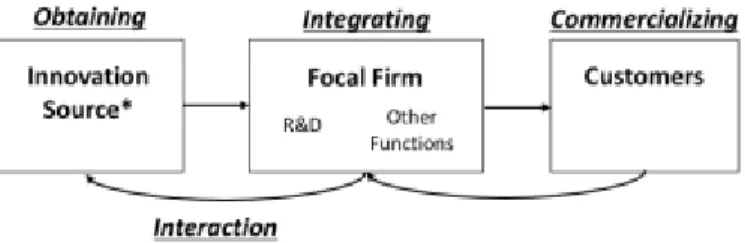
Co-creation is when the user(s) is willing and motivated to become involved in a part of firms’ innovation process (Gemser & Perks, 2015). Promoting co-creation activities is a strategic decision by the firm to deliberately join two parties – the user(s) and the firm – to generate a novel idea or solution that would otherwise go uncaptured (Prahalad & Ramaswamy, 2004). The user or potential user can co-create at any stage of the firms’ innovation process; whether it be the obtaining, integrating or commercializing external innovations stage (or a combination of all three) depicted in Figure 1 (West & Bogers, 2014).
FIGURE 1: PROCESS MODEL FOR LEVERAGING EXTERNAL SOURCES OF INNOVATION (WEST & BOGERS, 2014) Companies are continuously experimenting with customer-firm collaboration to better understand what works best in their specific industry, product category and company (Gemser &
Perks, 2015). The idea of consumer co-creation is similar to a joint venture in the sense that there is an agreement between the user and the firm and both parties come to a common problem definition or solution (Prahalad & Ramaswamy, 2004).
Procter & Gamble, the fast moving consumer good giant, has changed their innovation approach which now requires 50% of all innovations to come from outside the firm (rather than the status quo of only 10%) and has created a Director of External Innovation position (Chesbrough, 2006). A multitude of successful products have been developed due to this change such as the SpinBrush which is now their best-selling electric tooth brush in the United States (Huston & Sakkab, 2006).
A second example is Merck, one of the largest and most scientifically accomplished pharmaceutical companies globally, which relies heavily on outside sources in order to tap additional medical technologies and solutions available (Chesbrough, 2006). Without using other sources, the firm could only account for under one percent of all the biomedical research in the world. Additional user co-creation successes include Lay’s new chip flavours and Dell allowing users to join their customer support initiatives (Chesbrough, 2011); (Dervojeda, et al., 2004).
The benefits of user co-creation to both parties are well documented. Successful co-creation results in higher profitability, greater efficiency, more positive brand value for firms (Dervojeda, et al., 2004). Also, internal design teams are supplemented therefore lowering costs, increasing innovation potential as well as customer loyalty (Schreier, et al., 2012). Firms are taking advantage of the high potential customer reach regarding scale and scope and use co-creation activities as a key differentiator in order to gain a competitive advantage (Dervojeda, et al., 2004); (Payne, et al., 2008). Customers that co-create on the other hand can extract social, personal and monetary benefits by partaking in co-creation (Bendapudi & Leone, 2003) revealing a win-win situation for the firm and those involved in the co-creation activity.
1.3 AIMS
There is a dearth of literature regarding why users do not want to participate in co-creation activities. The attitude and profile of the typical users that opts in or out of co-creation activities as well as their motives to do so have been wholly overlooked (Bogers, et al., 2010); (Schreier, et al., 2012). The literature focuses solely on the benefits and advantages firms reap when co-creating yet leaves the costs largely unexplored (Gemser & Perks, 2015).
Numerous journals and articles suggest that a users’ willingness to participate in co-creation activities is more a function of their individual differences rather than related to the community or company sponsoring the co-creation activity (Füller, et al., 2008); (Ebner, et al., 2009) therefore a better understanding of those individual differences is paramount. In addition, the greater the number of users participating in a co-creation activity increases the likelihood of high quality ideas coming fourth (Schreier, et al., 2012) thus through better understanding these differences firms can identity and recruit potential co-creators more successfully.
Creating and developing co-creation projects, no matter the scale, involves high resources such as time and money (Bendapudi & Leone, 2003) therefore understanding how to better target users to participate in co-creation is imperative since higher participation rates translate into higher quality ideas (Schreier, et al., 2012). Users that are disgruntled by the co-creation project are more likely to “exit” or not participate rather than voice their concerns to the company (Franke, et al., 2013) which results in firms not understanding their key partners in co-creation, the users, not to mention the wasted effort and recourses in designing and creating the activity. This knowledge is essential for both academics and professionals since customers that opt out of participating in co-creation actually composes the majority of the market today (Schreier, et al., 2012).
This thesis aims to better understand the reasons why users opt out of co-creation, by analyzing users’ costs of participation and benefits in participating in co-creation. Thus the main research questions are: (1) which benefit influences and (de)motivates users to co-create, (2) what are the costs to users and (3) profiling a user that opts out of co-creation.
2 L
ITERATURER
EVIEW ANDH
YPOTHESISD
EVELOPMENT2.1 INNOVATION MODEL
2.1.1 CLOSED INNOVATION MODEL
The Closed Innovation Model, often referred to as the golden age of internal R&D was the standard way to innovate and conduct research up until the 20th century (Chesbrough, 2006). The attitude toward innovation was that firms must be self-sufficient in their research generation, development and testing. All materials, designs, manufacturing and sales and support were expected to be conducted internally (Chesbrough, 2006).
Often the largest companies had the greatest advantage due to economies of scale in the R&D departments. This advantage allowed companies to bring to market the most successful products therefore reaping the economic rents and strengthening their status as dominant players within the market. This became a reinforcing cycle. The R&D departments were vertically integrated for two reasons. First, there was a lack of efficacious external alternatives therefore companies had to rely solely on themselves for innovations and secondly these companies completely controlled the value chain of business activities (Chesbrough, 2006). In addition to having cutting edge innovations and technology, they attracted and hired the best and brightest minds (Chesbrough, 2006).
2.1.2 OPEN INNOVATION MODEL
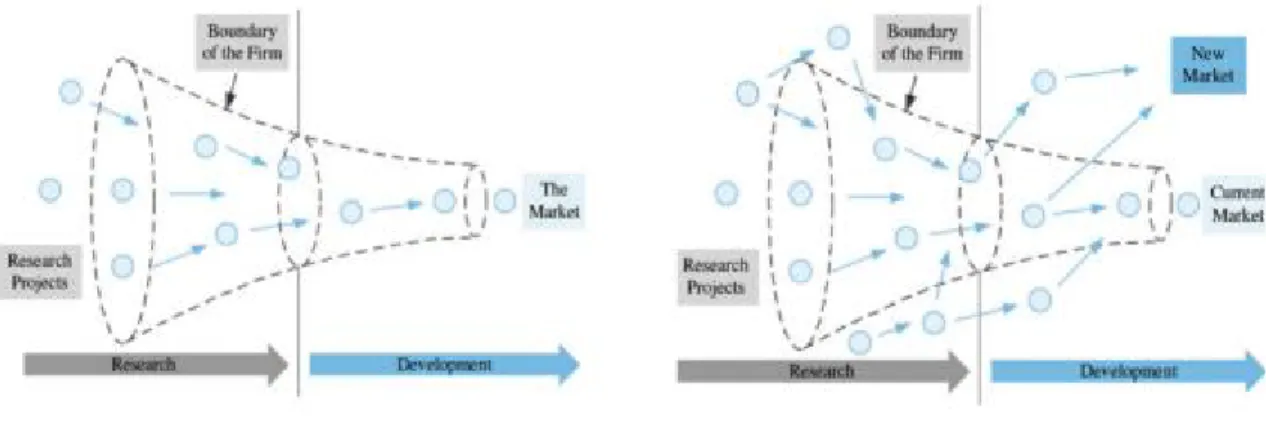
Professor Henry Chesbrough first popularized the Open Innovation Model in 2006 explaining that firms can extract valuable knowledge by inviting new sources such as customers, suppliers, universities, national labs, start-up businesses or consultants to participate in the innovation process (Chesbrough, 2006); (Schoellhammer & Orcik, 2014). The knowledge environment had shifted allowing the traditional firms’ boundary to be more flexible and porous. This results in ideas flowing in and out of the firm more easily which is a contrast to the rigid walls of the Closed Innovation Model (Chesbrough, 2006). In the Open Innovation Model ideas can either flow from ‘outside in’ meaning the firm can incorporate ideas that have been externally developed into their own innovation process. Or ideas flow from ‘inside out’ meaning that firms take their internally developed ideas and export them outside the firm. The latter is less recognized yet of equal importance (Chesbrough, 2011) (see Figure 2).
FIGURE 2: CLOSED VERSUS OPEN INNOVATION PROCESS (SIMIC, 2013)
Open innovation provides an opportunity for larger and more mature organizations to reinvent themselves and engage with a much larger source of ideas and technologies (Chesbrough, 2006); (Chesbrough, 2011). The new model allows for more efficient and cost effective R&D requiring firms to rethink the way they generate ideas in order to be relevant and keep a competitive advantage. Firms can no longer solely rely on internal R&D for idea fruition since knowledge is now distributed heterogeneously among users, agents, and producers (Chesbrough, 2006). Firms must restructure themselves to manage and leverage the abundance of available external knowledge while still perusing their own R&D initiatives. The mentality that successful ideas are solely generated from within is obsolete.
2.2 ACTIVE ROLE OF THE CUSTOMER
Traditionally, users have lacked the knowledge, skills and technical expertise required during new product development (NPD) (Randall, et al., 2005). Today’s changing digital landscape gives users to access unrestricted and unprecedented amounts information and knowledge that was previously only available to firms resulting in a more educated user base (O’Hern & Rindfleisch, 2010); (Piller & Walcher, 2006). All topics can now easily be studied, user friendly tutorials and detailed technical information are now available for free (Jeppesen & Molin, 2003). This radical shift ensures users are more knowledgeable and can make more informed innovation decisions (Prahalad & Ramaswamy, 2004). In addition, a power shift (from the firms to users) is evident since users now have increased access to the company, product, technology, performance and price information (Prahalad & Ramaswamy, 2004). This shift allows users to better compare and contrast material, therefore multinationals to have less freedom to change price and quality according to locations (Prahalad & Ramaswamy, 2004).
Potential co-creators that freely share ideas with the firm are a vital source of innovation and critical to successful co-creation (Chesbrough, 2006); (Jeppesen & Frederikse, 2006). The traditional definition of who can be a valuable co-creator has significantly broadened; Co-creators are all participants, users, customers or potential customers that choose to become active in the firms’ co-creation activities. A lead user is a person that has superior knowledge in the respective field they are co-creating within or has an advanced understanding of market needs (Gemser & Perks, 2015). Studies have shown that these users are significantly more effective at creating innovations of general importance than businesses are (Hienerth & Letti, 2011). In contrast, a regular user is better at producing original ideas and thinking creatively (Kristensson, et al., 2004); (Magnusson, 2009) except when innovating technology-based products (Knudsen, 2007).
Innovation now originates from different areas of society such as the market, industry and academia (Schoellhammer & Orcik, 2014). Market co-creators are comprised of both lead and regular users, users from specific target groups and the general public (Kristensson, et al., 2004); (Von Hippel, 2001); (Füller, et al., 2008). Industry co-creators include competing firms’ staff (Orcik & Anisic, 2014), suppliers and consultants (Chesbrough, 2006). Academic co-creators are all students, researchers and scientists working in cooperation with universities and national labs (Orcik & Anisic, 2014). Each type of actor is of equal importance and has a unique problem solving method (Orcik & Anisic, 2014).
2.2.1 EMERGING CONCEPTOFAMARKET
Traditionally the concept of a market was linear, and the market was very separated from the innovation process (Prahalad & Ramaswamy, 2004) visually depicted in Figure 3. Firms created value by inventing a novel good or service and exchange that good or service value with the end consumers in the market (Prahalad & Ramaswamy, 2004). The interaction was primarily based on consumers’ experiences and the firm aiming to yield high economic rents from the consumers (Prahalad & Ramaswamy, 2004).
FIGURE 3: TRADITIONAL CONCEPT OF A MARKET (PRAHALAD & RAMASWAMY, 2004)
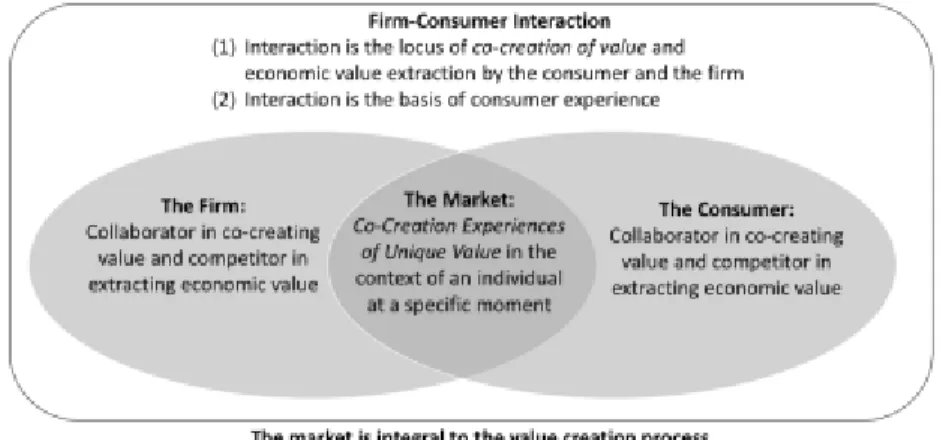
The emerging concept of a market is replacing the traditional in a market where customer co-creation can flourish (Prahalad & Ramaswamy, 2004). The evolution of users has changed from being a passive buyer into a valuable and active co-creator. Now the firm and user(s) can create value through a robust collection of customer-centric interactions occurring anywhere throughout the network (Prahalad & Ramaswamy, 2004). More applicable ideas will come forth when participants are the actual users of the final products (Schreier, et al., 2012) since they have a deeper insight into unresolved problems and their unique needs (Von Hippel, 2005). The mix of users regarding quantity, diversity, type and restrictions placed upon them is an important differentiating factor between goods that are co-created by the crowd versus goods that are developed by internal designers (Schreier, et al., 2012). Figure 4 highlights the new landscape where value creation and the marketplace converge.
FIGURE 4: EMERGING CONCEPT OF A MARKET (PRAHALAD & RAMASWAMY, 2004)
2.2.2 CO-CREATION BREADTH
The customer reach potential is substantial both in breadth and scope as demonstrated by a representative study which revealed that approximately six percent of the consumer population over 18 years of age in the United Kingdom have co-created in some way in 2009 – 2012 (Von
Hippel, et al., 2012). These six percent translates into approximately 2.9 million users that have willingly collaborated with firms to create and develop new products in just those three years studied. The potential of co-creation activities is shown by consumers’ annual NPD expenditures which are greater than 1.4 times the annual consumer product R&D expenditures of all companies in the UK combined (Von Hippel, et al., 2012). Also, the list of user-designed successful products in the fast moving consumer good, pharmaceuticals, medical, fashion industries in infinite (Von Hippel, 2005).
Users greatly enjoy customer-led innovation ideas (Franke & Schreier, 2010); (Lakhani & Wolf, 2005) which explains why users have willingly become such active innovation participants (O’Hern & Rindfleisch, 2010). Users are self-selecting into multiple co-creation activities, increasing their NPD skills and connecting with other like-minded users (O’Hern & Rindfleisch, 2010). It is becoming abundantly clear co-creation and mass customization of goods and services is a mainstream marketing activity (Hoyer, et al., 2010) (O’Hern & Rindfleisch, 2010) and that companies across all industries are taking advantage of this in hopes to capture the multitude of tangible and intangible benefits.
2.3 CUSTOMER CO-CREATION
The concept of customer participation was first presented by Lovelock and Young in 1979, highlighting that when users assume a more active role, firm productivity will increase. Since then co-creation has significantly evolved and it is now influencing business models, providing novel paths to market and making firms re-evaluate how they communicate to end users (Prahalad & Ramaswamy, 2004). Co-creation is an NPD activity where the users are central and vital contributors in the innovation process (O’Hern & Rindfleisch, 2010). They actively contribute and/or actively select the content for a new product that a firm will peruse (O’Hern & Rindfleisch, 2010). Co-creation can be conceptualized as a joint venture between users and firms to collaboratively innovate new products and ideas, a role that has been traditionally been taken on by the firm (Gemser & Perks, 2015).
Users are now able to connect on new platforms, avenues, formats without regard for geographic or social barriers allowing for immediate and effective co-creation (O’Hern & Rindfleisch, 2010); (Prahalad & Ramaswamy, 2004); (Piller & Walcher, 2006). Online platforms such as websites, emails, online design tools, social networks make online brainstorming, idea generation and co-designing possible (Hoyer, et al., 2010); (Dahlander & Wallin, 2006); (Füller,
et al., 2008). Users can co-create in the front end of the innovation process through ideation contests, virtual communities, forums or in the back end of the innovation process through offline co-creation, toolkits and peer production.
2.3.1 CUSTOMER CO-CREATION TYPOLOGIES
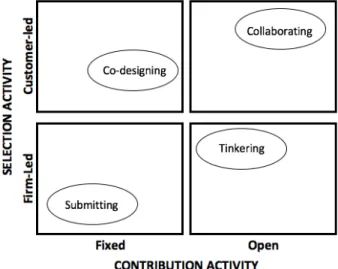
To develop new products two activities must be completed: a novel idea or concept must be contributed and a selection of the aforementioned contributions must occur (Kahn, et al., 2013). As such four customer co-creation typologies emerge based on these two NPD activities: contribution and selection (O’Hern & Rindfleisch, 2010) (see Figure 5).
The contribution activities are all the impacts, ideas and additions users make to the NPD process which is defined by the firm or is completely open to users’ suggestions. Contribution activities defined by the firm include activities related to brand positioning, targets, and broad design directions. The level of firm control lies on a continuum from fixed (high control) to open (low control). Open contribution requires the firm to release some of the control into the hands of the users. The second construct, selection activities is either be guided by the firm or guided by the user (O’Hern & Rindfleisch, 2010).
FIGURE 5: FOUR TYPES OF CUST OMER CO-CREATION (O’HERN & RINDFLEISCH, 2010)
COLLABORATING
Collaborating co-creation provides an opportunity to develop and interject user ideas into NPD process (O’Hern & Rindfleisch, 2010). The best example of collaborative co-creation is successful open source software initiatives (O’Hern & Rindfleisch, 2010). These initiatives allow users to make fundamental changes to a program’s basic structure such as the source code resulting
in successes such as Linux, Apache, and Firefox all of which haven gained widespread adaptation and huge market successes (O’Hern & Rindfleisch, 2010); (Lakhani & Wolf, 2005).
TINKERING
Through tinkering, firms can increase differentiation more easily and test the market for new products at a lower cost (O’Hern & Rindfleisch, 2010). Although it will be more difficult to police users and possibly develop new competitors (O’Hern & Rindfleisch, 2010). Online computer game manufactures frequently make small alternations to the computer game and invite users to interject and aid the development of the game which is an example of tinkering co-creation (O’Hern & Rindfleisch, 2010). For example, the popular computer game The Sims was altered and modified based on this type of co-creation (Jeppesen & Molin, 2003).
CO-DES IGNING
Benefits of co-designing co-creation activities include the firm essentially outsourcing the design and creative part of NPD therefore reducing developmental costs (O’Hern & Rindfleisch, 2010). Since the users are the designers, the risk of product failure also decreases. Although it is difficult to attract a sizeable amount of skilled designers and the threat of new entrants is heightened (O’Hern & Rindfleisch, 2010). This type of co-creation activity is popular across many categories including fast moving consumer goods, household goods, sporting equipment, consumer packaged goods and the food industry (Ogawa & Piller, 2006).
SUBMITTING
The final type of customer co-creation is submitting which requires users to submit their new product ideas, solutions or prototypes to the firm. The firm then selects an idea to test, develop and market. Of the four types, submitting has the lowest customer margin of freedom or variation since the contribution activities are fixed and the selection process is solely firm led. Examples include firms that invite consumers to participate online competitions such as Ducati Motors’ contest to design a dream car. Users submit technical ideas and innovative designs to the executive team which they then use (Sawhney, et al., 2005).
2.4 THE VALUE OF CO-CREATION
PROFITABILITY
Benefits of successful co-creation result in more revenues and improved profitability for the firm (Prahalad & Ramaswamy, 2013) due to lower costs or higher prices (West & Bogers,
2014). By essentially outsourcing the NPD efforts firms acquire consumer ideas for a fraction of the cost that it could otherwise which decreases the firms’ marketing research significantly (Evans & Wolf, 2005).
Co-creation allows firms to overcome the issue of sticky customer needs since the customers themselves are the designers (Von Hippel, 2001). Users create a better quality product that better fits their own needs which translates to higher commercial potential and a greater likelihood of success (Dervojeda, et al., 2004); (Fang, et al., 2008); (Kristensson, et al., 2004); (Magnusson, 2009); (Von Hippel, 2001). The higher customers satisfaction with the products leads to increased product sales (Dervojeda, et al., 2004); that is referred to as the “innovation effect of user design” (Franke & Piller, 2004) since consumers’ purchase intentions and overall demand increase. In addition, the risk of products failing decreases up 50% (Ogawa & Piller, 2006).
Consumers’ willingness to pay has been shown to increases up to 50% in certain cases when products are co-designed (Schreier, et al., 2012); (Franke, et al., 2009). This is evident in MUJI, a Japanese consumer goods brand, which showed that their aggregate sales from user co-created products were five times higher than employee/designer co-created products for three years straight (Nishikawa, et al., 2013).
When co-creating, the speed to the market is greatly increased (Dervojeda, et al., 2004) and firms that successfully market co-designed products are able to enter other consumer groups at an accelerated pace. (Schreier, et al., 2012). The organizational performance will improve; firm operations will become more efficient, employee satisfaction will improve and inventory turnover rate will be higher (Ostrom, et al., 2010).
US ER-FIRM RELATIONS HIP
Through co-creation firms can meet customer needs more effectively therefore increasing demand for the co-created products resulting in a strong competitive advantage (Prahalad & Ramaswamy, 2000); (Payne, et al., 2008); (Ostrom, et al., 2010). Effective co-creation strengthens the user-firm relationship which leads to increased loyalty and increased future participation in co-creation events (Dervojeda, et al., 2004). The strengthened relationship leads to increased positive word of mouth, more referrals and favourable brand impressions (Dervojeda, et al., 2004); (Franke, et al., 2009); (Franke & Schreier, 2010). Overall the commercial attractiveness and reputation are significantly improved when goods and services are successfully co-created (Franke, et al., 2006); (Fuchs & Schreier, 2011).
2.5 HYPOTHESES DEVELOPMENT
Users believe that they themselves can benefit both intrinsically and extrinsically from participation (Ernst, et al., 2010).
HEDONIC BENEFITS
Many users have a strong interest in co-creation and enjoy innovation process (Füller, 2010); (Franke & Schreier, 2010). They take great pleasure from partaking in the co-creation process and enjoy contributing their unique thoughts and ideas (Franke & Schreier, 2010); (Evans & Wolf, 2005); (Sharma, et al., 2002); (Lakhani & Wolf, 2005); (O’Hern & Rindfleisch, 2010). Some participants derive pleasure from the problem-solving aspect and mental stimulation that comes from co-creation (Nambisan & Baron, 2009) while some appreciate when the products they helped co-creation come to market (Shah & Tripsas, 2007); (Lakhani & Von Hippel, 2003).
Many co-creation activates are naturally social in nature which allows users to gain a strong sense of belonging to a community which intrinsically benefits them (Nambisan & Baron, 2009). The social interactions within the virtual communities is a source of pleasure, enjoyment and the users appreciate the positive reactions received (Jeppesen & Molin, 2003); (Nambisan & Baron, 2009). Some users gain pleasure when speaking about product features and usage characteristics (Muniz Jr. & O’Guinn, 2001). These intrinsically social motivations have been heavily documented in open-source software programs (West & Gallagher, 2006).
To better understand if hedonic/pleasure benefits (or lack thereof) results in a difference in respondents opting in or out of co-creation activities the following hypothesis is proposed:
Hypothesis 1: The level of pleasure (hedonic benefits) users receive from co-creation will affect their willingness to participate.
UTILITY BENEFITS (REGARDING NEEDS)
Utility refers to the user having a need or requirement for a product essential to their life but it is not available due to a gap in the market. Users have the best and most accurate information about their own needs but this information is difficult and costly to transfer to firms resulting in information asymmetry between the two parties (Von Hippel, 2005); (Thomke & Von Hippel, 2002). This information gap happens when the interests of users and firms are misaligned (Von Hippel, 2005). Due to high dissatisfaction with what is currently available users have no choice but to co-create in order to fulfil their unsatisfied need requirement (Franke & Schreier, 2008) (Franke, et al., 2013); (Ernst, et al., 2010); (Hunt, et al., 2013). In fact, Von Hippel found that
millions of U.K. consumers create and modify products in order to better serve their particular needs (Von Hippel, et al., 2012). By co-creating users will derive utility because they get the product they require thus benefitting from the co-creation process (Mathur, et al., 2016); (Dahl & Moreau, 2007); (Franke, et al., 2006). The most successful examples of users co-creation for this reason is in the medical industry (Franke & Schreier, 2010). This reasoning leads to the following hypothesis:
Hypothesis 2: The level of utility (need) users require will affect their likelihood of participation.
INDIVIDUALIS M BENEFITS (REGARDING WANTS)
Taking part in product development allows consumers to be more aware of and educated about the challenges, costs and constraints when developing a new product (Joshi & Sharma, 2004); (Hoyer, et al., 2010). Through the process users learn how better articulate their needs and wants to firms (Franke, et al., 2009) and gain a higher appreciation for the final good or service they helped create (Joshi & Sharma, 2004); (Hoyer, et al., 2010). In addition, through co-creation the user gains a strong sense of personal accomplishment (Franke & Schreier, 2010) and philosophical belief that their co-creation work is important (Evans & Wolf, 2005); (Hertel, et al., 2003); (Sharma, et al., 2002).
Users can develop their personal and social identities through the uniqueness of the goods and services they use (Hunt, et al., 2013). If their appetite towards and the importance they place upon product design and aesthetics is high then owning individualistic, unique and customizable goods is imperative for them (Hunt, et al., 2013). If users’ product needs are rare, unique or difficult to find, users are better off co-creating in order to personalize and customize products to a degree that the market has not provided so far (Füller, 2010); (Hunt, et al., 2013). Uniqueness refers to the degree of distinctiveness, individuality and overall visual rareness the product has in comparison to other products in the same category (Hunt, et al., 2013).
Customers find it hard to clearly articulate their wants therefore this valuable information proves to be very sticky (Von Hippel, 1994). Co-creation allows users to apply tacit knowledge to the product by developing unique and individualistic items to meet their desires as users themselves are shaping the products and inputting their ideas (O’Hern & Rindfleisch, 2010). Users will develop a product that the firm would not have been able to (Franke, et al., 2006), ahead of the market since they develop goods for their specific needs before firms do (Von Hippel, 2005).
If users’ wants are extremely unique and demand a high level of aesthetic and individualistic distinctiveness then their motivation to co-create will be greater (Füller, 2010); (Hunt, et al., 2013) therefore the following hypothesis is developed:
Hypothesis 3: The users’ likelihood of participation in co-creation activities is positively related to the level uniqueness and individualism in the products.
MONETARY BENEFITS (REGARDING FAIRNES S)
The level of motivation will greatly vary per user according to their underlying attitudes and goals (Deci & Ryan, 2000). The self-determination theory distinguishes between types of motivations according to goals (either intrinsic or extrinsic) (Deci & Ryan, 2000); (Gagné & Deci, 2005). Intrinsic motivators come from within, actions are inherently gratifying, users gain an achievement or satisfaction (Deci & Ryan, 2000); (Lee, et al., 2005). Whereas extrinsic motivators are controlled by others or the environment and actions are completed because it leads to a specific outcome (such as pay or a promotion) (Deci & Ryan, 2000); (Lee, et al., 2005).
The main extrinsic user benefit from participation in co-creation activities is monetary rewards received, with less regard for gaining knowledge or a better understanding of the innovation process (O’Hern & Rindfleisch, 2010); (Füller, 2010). In addition, some participants gain status, advance their careers and/or earn awards for successfully co-creating in the innovation contests (Terwiesch & Xu, 2008); (O’Hern & Rindfleisch, 2010); (Deci & Ryan, 2000).
The fairness theory suggests that users are highly concerned with resource allocation, namely power in firms and how distributed is between the firm and users (Franke, et al., 2013). Procedural fairness is regarding fair internal procedures leading to that value distribution (Gilliland, 1993). Some users might perceive low transparency in terms and conditions, unclear internal intellectual procedures, limited intellectual property protection and unprotected or unpatented user innovations as unfair procedural processes conducted by firms. Distributive fairness on the other hand concerns users’ expectations about the fair distribution of value (both monetary value and reputation value) between the company and the user (Gilliland, 1993). The disproportionate amount of profit the firm makes off user designs (in comparison to what the user earns) and whether the wining contributors earn a fixed sum or percentages of sales from their co-designed product are all distributive fairness issues that are concerning to potential users (Gilliland, 1993).
A successful example of such monetary rewards is t-shirt design firm Threadless, that awards co-creators with a portion of the sales and rights from their designs. Although fair profit distribution (distributive fairness) has been heavily debated within the firm, as co-creators receive up to $1,500 but the firm earns up to $450,000 from that same winning design causing some to complain about unfair profit distribution (Franke, et al., 2013); (Brabham, 2010).
Users’ understandings and expectations regarding fairness will greatly impact their likelihood of participation (Franke, et al., 2013) therefore the following hypothesis is proposed:
Hypothesis 4: Users’ willingness to participate in co-creation activities will be positively associated with perceptions of fairness in value distribution
2.6 THE COSTS CO-CREATION
Consumers will deeply analyze the benefits (or lack of benefits) they will experience from participating in co-creation activities (O’Hern & Rindfleisch, 2010) and compare those with the potential costs of participation in order to decide if they will engage in the co-creation activity at all (Hoyer, et al., 2010); (Etgar, 2008). Frequently co-creation studies emphasize the benefits of user participation yet neglect the risks and costs that they can incur (Mahr, et al., 2014). If the benefits users receive from participation in co-creation does not align with the potential costs they will face then users are more likely to decline participation (Radford & Sridhar, 2005).
TIME
Costs in terms of time is the personal time users dedicate to co-creating and the opportunity costs related with that (Bendapudi & Leone, 2003). Time can be categorized in monetary and nonmonetary sections (Hoyer, et al., 2010).
Monetary time costs include the time spend co-creating that cannot be spent generating income from a traditional place of work. Users consider the this cost in ‘real time’ therefore include all expending and waiting time which is are natural externalities of co-creation when they then reflecting on and include in the total cost of time (Zeithaml & Bitner, 1996). All inconvenience costs (such as travelling required or rearrange personal schedules according to the co-creation project) is also included in users’ time cost analysis (Zeithaml, 2011).
EFFORT
A second substantial cost of participation is the psychological or physical effort required by firms. Users to learn the obligatory skills and relevant knowledge required to take part in the
co-creation process (Hoyer, et al., 2010). If participation requires a high level of specific knowledge in a certain field, users will have to mentally and physically prepare and put in the effort to learn the skills they lack to participate (Hoyer, et al., 2010). If the co-creation project is technology sensitive than users’ participation will be contingent upon their personal technological sophistication. For example, co-creation activities within the open source software field will require specific coding knowledge that must be acquired before users can contribute requiring a high level of effort from users that cannot code.
An additional non-monetary effort is the search cost which requires effort from users to search for and identify items they will use or need in their co-creation endeavour (Lovelock, 2011). When the problem complexity is high and the user perceives too much energy and effort will be required of them, users might waver in their desire to participate (Hoyer, et al., 2010).
RIS K
Since risk and participation are very closely related constructs it must be analysed further (Hunt, et al., 2013); (Dholakia, 2001). Risk can be further divided into categories, psychological, functional and social risk (Hoyer, et al., 2010); (Radford & Sridhar, 2005); (Dholakia, 2001). Examples of psychological risk are negative feelings users feel as a by-product of participation such as anxiety, apprehension, fear of not understanding or rejection (Dholakia, 2001); (Zeithaml & Bitner, 1996). Functional risk refers to the risk that the users’ submissions could fail despite their invested effort or that the co-creation activity itself fails to deliver on promised functions or benefits. An example of functional risk is if part of a co-creation toolkit’s functionality fails to run or load (Laroche, et al., 2004). Social risk is referring to users’ concern of their peers’ opinion. Using a certain product or service can alter the users status within their family or friends circle, therefore posing a social risk (Laroche, et al., 2004). In addition, there is the risk that user contributions will not be credited appropriately. By not getting proper credit or recognition for their successful designs and submissions (Franke, et al., 2013) firms can take advantage of intellectual property. For example, 17% of consumer-innovators do not protect their innovations which leave them open to exploitation by firms (Von Hippel, et al., 2012).
The user will consider all potential costs of participation, in addition to the individual opportunity costs before they decide if they will participate (Hoyer, et al., 2010); (Bendapudi & Leone, 2003). To better understand the potential costs to users, the following hypothesis is developed:
Hypothesis 5: The higher the perceived costs in participation in co-creation, the less likely a user is to participate.
2.7 INDIVIDUAL CHARACTERISTICS
Research has shown that preferences for new products vary according to age, and younger users are more willing to adopt novel goods whether they are ideas, products or services. (Lambert-Pandraud & Gilles, 2010). Co-creation is a relatively new concept it can be postulated that older users (in comparison to younger users) are less accepting of co-creation activities (Lambert-Pandraud & Gilles, 2010). In addition, technology sensitive applications and projects (such as co-creation) is sensitive to the variations in users’ technological and digital aptitude resulting in a sophistication gap – younger users are faster adopters of new technological products and services when compared to older users (Prahalad & Ramaswamy, 2000).
Co-creation activities are becoming more and more technologically advanced (Dervojeda, et al., 2004) and as a consequence users must continue to be up to date with new developments to fully benefit from all the innovations (Dholakia, et al., 2009). Previous research on user education (drawing from the social learning theory (Bandura, 1977)) has established that the consumer education allows users to develop their motivations (Kelley, et al., 1992); (Zaho, et al., 2008) and abilities (Aubert, 2006); (Hennig-Thurau, 2000); (Dellande, et al., 2004). The literature neglects how education will facilitate customers’ co-creation behaviours therefore to better understand this participants’ formal education level will be measured.
There is a limited amount of literature regarding co-creators’ specific demographic information. Only a few broad characteristics are highlighted, studies show that the co-creators are young, males and have decent technical knowledge in their field of activity (Von Hippel, et al., 2012).
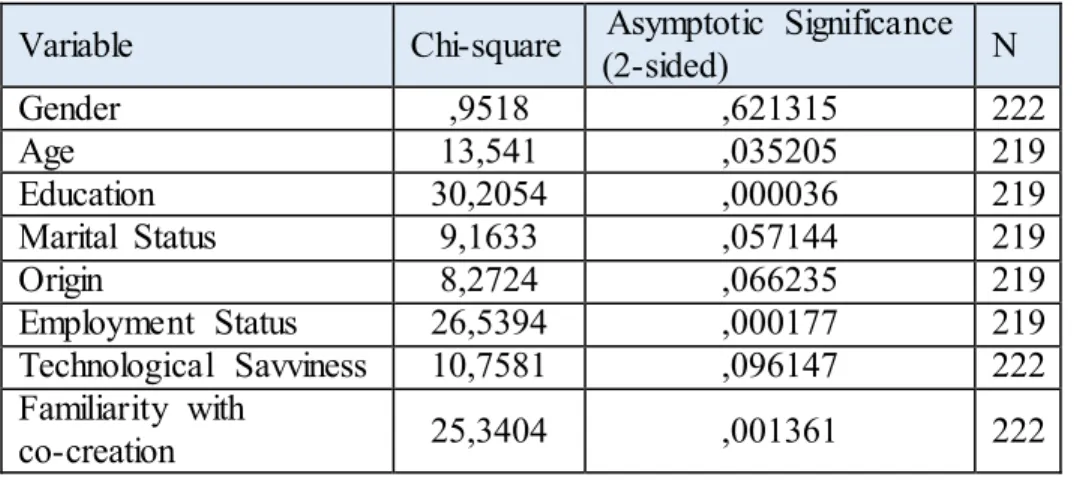
To further develop a more well-rounded profile of typical users that opt out of co-creation, education, familiarity with co-creation opportunities, origin, employment status, and marital status will be tested for significance. In order to test the limited demographic information available, the following hypothesis was developed:
Hypothesis 6: Potential co-creators that opts out of co-creation are typically older users, female, and have lower technologically ability.
3 M
ETHODOLOGY3.1 DESIGN
I chose to conduct a questionnaire for practically and convenience reasons because it is an effective method to collect a large amount of standardized and comparable responses from potential co-creators in a relatively short and cost effective way. The strongest advantage of a questionnaire is the direct and fast access to a lot of respondents from targeted potential co-creators avoiding geographic barriers. In addition, when compared to personal interviews, questionnaires allow respondents to be more honest since they are less afraid of researcher judgments (Bronner & Kuijlen, 2007); (Deutskens, et al., 2006).
The downside to any online questionnaire is that it automatically excludes those that do not frequently access technology (Pallant, 2010). The level of qualitative analysis will be lower, and the number of respondents that entirely complete the questionnaire from start to finish is less than it would be in personal interviews or focus groups (Manfreda, et al., 2008); (Grandcolas, et al., 2003). In addition, a selection bias will be evident since it is almost impossible to ensure a completely representative and robust sample (Grandcolas, et al., 2003).
Overall, the questionnaire was still deemed the most effective and appropriate method to efficiently generate valuable and deep insights because the questionnaire results can be easily quantified and analyzed through SPSS Statistics software in an objective manner. In addition, I can carry out the research without serious affects to the validity and reliability of the research (Ackroyd & Hughes, 1992) and I can test hypothesis’ easily using a questionnaire (Popper, 1959). The questionnaire was distributed via social media, specifically Facebook, and personal requests from May 2nd to May 25th 2016 using Qualtrics Research Software thus accessible to respondents via computers and mobile phones 24 hours a day. Facebook was deemed as an appropriate distribution method because it decreases both access and geographical barriers while simultaneously increasing the snowball effect (Gregori & Baltar, 2013). The target was the population in general without strict restrictions as anyone can co-create therefore an online questionnaire was most fitting. All data was processed and analysed using SPSS Statistics software. The full questionnaire is available in Appendix 8.1.
The questionnaire in three sections. First, I aimed to identify respondents’ attitude toward benefits they will receive from co-creation, secondly I surveyed the potential costs of taking part in co-co-creation activities and finally I collected data on the demographic profile of co-creators.
Since there is a vast amount of literature on user motivations to co-create I decided that a focus group was not required.
Respondents were asked to read a small introduction about Lay’s’ “Do Us a Flavour” campaign which is an annual ideation co-creation contest conducted by Frito-Lay, the leading producer of corn chips, potato chips and other snack foods. This campaign invites users to submit a potato chip flavour idea electronically and rewards the creator of the winning flavour idea with a monetary prize. This Lay’s ‘Do Us a Flavour’ campaign example of an ideation contest which is proven to be user-friendly and a very successful driver of customer innovation (Piller, et al., 2010). The product category is relevant to participant since the majority have this tried chips and snack products, and it is simple enough that lead users are not obligatory for participation. It has been shown that products with low complexity are best in studies of this nature (Schreier, et al., 2012).
To being the questionnaire, respondents were asked to rate how willing they would be to participate in such a contest from one to five by dragging a vertical slider to indicate their willingness level. One represented that users were absolutely certain they will not participate in such a contest and five represented that respondents were extremely certain that they will participate in such a contest. In order to help eliminate survey bias the default value for this slider scale was set at three (the middle) rather than at one.
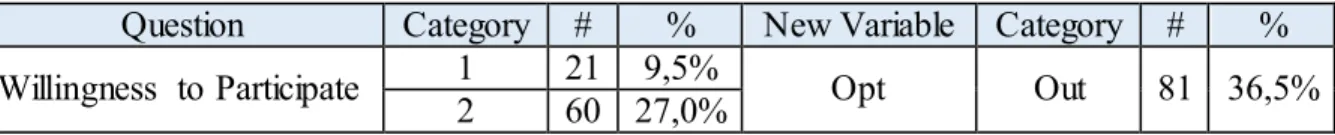
From this question a new categorical variable called ‘Opt’ was created which had only three values corresponding to the differing levels of willingness indicated by respondents. Participants that indicated that their willingness level was one or two were grouped together under the category ‘optOUT’ and participants that indicated that their willingness level was four to five were grouped together under the category ‘optIN’. All participants that selected three, the middle point, were excluded in order to make the analysis more accurate. The excluded category was called ‘optEXCLUDE’. This question was the foundation for the research and allowed this thesis to compare and contrast between respondents that would most likely opt in and out of co-creation activities. Descriptive statistics showed that 36,5% of sample opted out of co-creation activities, 39,2% opted in and 24,3% was excluded. Table 1 provides an exact breakdown of the new variable Opt.
TABLE 1: LIKELIHOOD OF PARTICIPATION DESCRIPTIVE ST ATISTICS
Question Category # % New Variable Category # % Willingness to Participate 1 2 21 9,5% 60 27,0% Opt Out 81 36,5%
3 54 24,3% Exclude 54 24,3%
4 51 23,0% In 87 39,2%
5 36 16,2%
3.2 MEASURES
All questions were closed ended Likert scale questions ranging from one to five in order to increase the statistical analysis available. To avoid response bias I randomly reversed question wording (Pallant, 2010). For analysis purposes, I then reversed the items to ensure the scale was measuring accurately. In order guarantee the model’s consistency, I conducted the Cronbach’s alpha reliability tests. The acceptable alpha range should be between 0,7 and 0,95 (DeVellis, 2011); (Pallant, 2010) but since the Chronbach's alpha is artificially inflated with a large number of items or artificially deflated due to a low number of items, some researchers expand the cut off barrier to 0,6 (George & Mallery, 2003); (Field, 2005). For variables with less than three items in them (such as the time variable) a Cronbach’s alpha is not appropriate therefore a Pearson correlation test was conducted. Table 8 and 9 in Appendix 8.2 provides a complete summary of the reliability coefficients (Cronbach’s alpha and Pearson correlation tests).
3.2.1 PERCEIVED BENEFIT
To identify respondents’ attitude toward benefits they will receive from co-creation the perceived benefit construct was tested which comprised of four separate variables: hedonic, utility/need, individualistic want and fairness. Each multi-item variable was averaged to make an overall score for each separate variable which was then used for further analysis.
HEDONIC
The hedonic variable was composed of eight items adapted from Bendapudi, N., & Leone, R. P. (2003) and Nambisan, S. & Baron, R. A. (2009). Participants were asked if they agree or disagree with the statements “I participate for my own entertainment”, “I enjoy the idea generation aspect of the contest”, “Participation gives me a creative outlet”, “I participate in order to relax”, “Participation gives me feelings of happiness”, “I participate because I am bored”, “I participate because I value the process of innovating” and “I participate because I enjoy browsing and voting for other submissions”. All variables were measured from one (strongly agree) to five (strongly disagree). The Cronbach’s alpha for this measure is 0,777 indicating a high level of internal consistency for this scale. A low total hedonic score represents that pleasure-seeking behaviour/hedonism is greatly important to respondents (they enjoyed co-creation) and high hedonic score represents the opposite.
UTILITY/NEED
The utility variable was divided between base category need dissatisfaction (do respondents value the product) and their perceived usefulness adapted from Kaplan, A. M., Schoder, D. & Haenlein, M. (2007). All five items were tested using the Likert scale from one (strongly agree) to five (strongly disagree). The base category need items were “Participation is too time consuming” and “Participation is of no interest to me” and the perceived usefulness items were “Participation will be difficult”, “Participating in co-creation contests like this is not useful for me” and “I do not care for customized goods or services according to my tastes”. All items were in reference to participation in the Lays “Do Us a Flavour” campaign presented at the beginning of the questionnaire. The Cronbach’s alpha for this measure is in the acceptable range at 0,742. A low utility score means that respondents have a low overall need for specific goods (insinuating a low need to co-create out of necessity), and a high utility score means just the opposite – users have a high utility requirement for a good that is unavailable.
INDIVIDUALIS TIC WANT
To test the individualistic want variable, the level of uniqueness and individualism was analysed through a Likert scale from one (describes users extremely well) to five (does not describe them whatsoever). Participants were asked to rate the five items adapted from Franke, N. & Schreier, M. (2008) which were “I have trouble finding products to suit my unique needs and tastes”, “It is important that the products I use are rare”, “I enjoy having things that others do not”, “I have the need to do unique activities”, “Product aesthetics are highly important to me”. The Cronbach’s alpha for this measure is 0,804 indicating a strong level of internal consistency. A low individualistic score represents respondents greatly appreciating customized or individualistic goods (strong desire for unique items) whereas a high score represents the opposite.
FAIRNES S
The fairness variable was composed of six items adapted from Franke, N., Keinz, P. & Klausberger, K. (2013). Respondents were asked to rate how important statements were from one (extremely important) to five (not important at all) regarding procedural fairness through items “The public decides which flavour wins the contest (The public votes online)” and “Lay’s decides which flavour wins the contest” as well as regarding distributive fairness through items “Lay's shares the profits with the creator of the winning flavour”, “The creator of the flavours' name being visible to end consumers”, “The winner of the contest will get a lump sum monetary prize” and
“The winner of the competition will get a percentage of sales (prize depends on success of product)”. The Cronbach’s alpha for this measure is 0,671 which is acceptable but weak. Fairness is a very important variable to test therefore although the Cronbach’s alpha is weak it will be retained. Low scores represent that value distribution fairness is important to respondents and high scores representing value distribution fairness is not important to respondents.
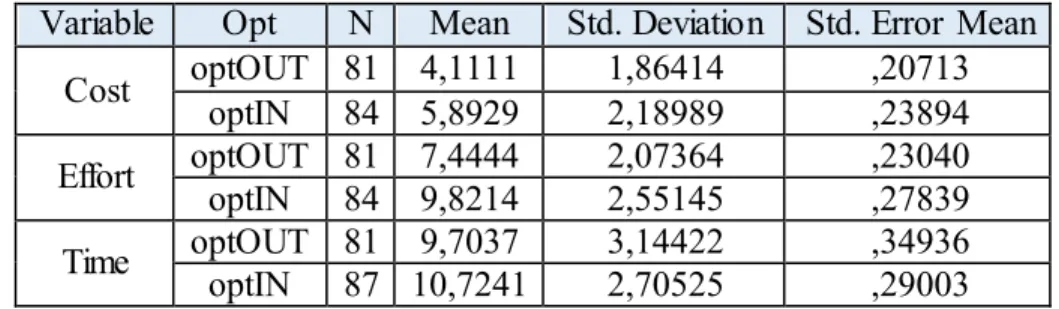
3.2.2 POTENTIAL COST
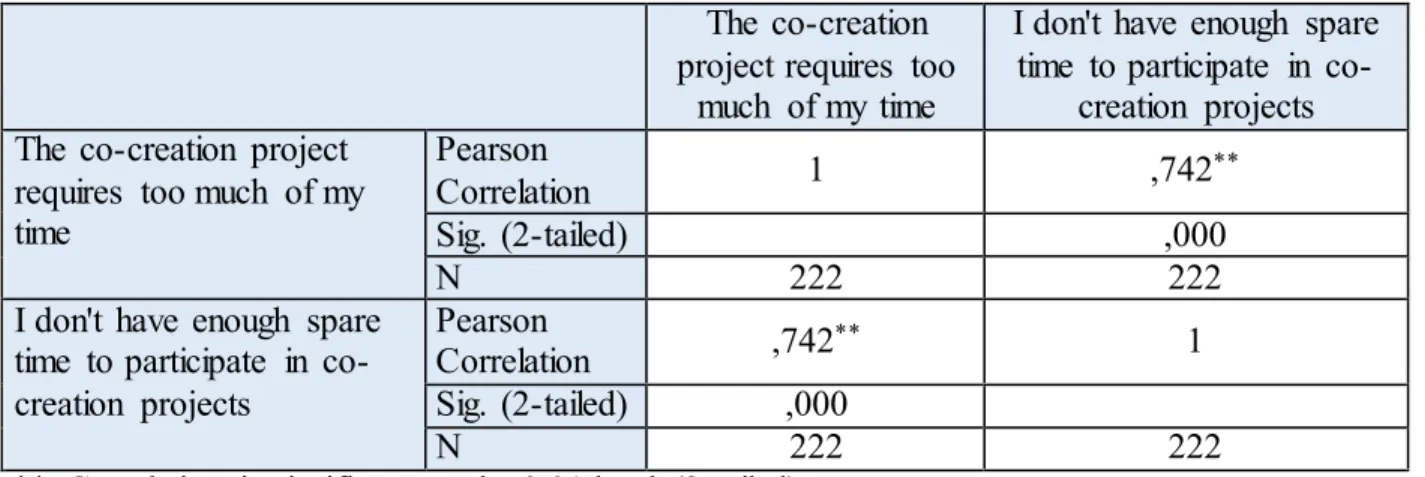
TIME
Using a Likert scale from one (strongly agree) to five (strongly disagree) respondents answered these two items “I don't have enough spare time to participate in co-creation projects” and “The co-creation project requires too much of my time” which were adapted from (Dholakia, et al., 2009). The Cronbach’s alpha was inappropriate since there are only two items therefore a Pearson’s Correlation Coefficient was done and proved that there was a strong positive relationship between the two items (r=,742, n=2, p=,000).
EFFORT
The effort variable was composed of three items which were “Participation in a co-creation project requires too much energy/effort from me”, “I don't participate in co-creation because it is too complex for me” and “I don't care to learn the required skills needed so I can participate”. These items were adapted from Franke, N. & Schreier, M. (2010). The Cronbach’s alpha for this measure is 0,718 which is acceptable. A higher score means that respondents believe that participation will require a high amount of personal effort and a low score represents the opposite. RIS K
The risk variable was composed of three items that measured psychological, functional and social risk of participation which was adapted from Dholakia, U. M. (2001). The items were “Participating in co-creation contests would give me anxiety” (psychological risk), “When co-creating with a firm I would worry about how successful the creation will be” (functional risk) and “Participating would cause me concern about what my friends would think of me” (social risk). The Cronbach’s alpha for this measure is 0,771 representing a high level of internal consistency for this scale. A lower overall risk score insinuates that the respondent believes participation results in high risks (they are more risk adverse) and a high risk score means respondents believes participation results in fewer risks.
To collect data on the demographic profile of co-creators and a more well-rounded profile of non-participating users, questions asked include sex, age, education, marital status, employment status and country of origin. In addition, respondents were asked to self-determine their level of technological understanding as well as how familiar they were with co-creation activities to make a more robust profile. The profile data collected was categorical.
4 R
ESULTSI employed independent-samples t-test in order to compare the mean scores of each benefit variable (hedonic, utility/need, individualistic want and fairness) and each cost variable (time, effort and risk) with the group of participants that opted in and out of participation. This statistical tool will identify whether there is statistically significant difference in the mean scores between respondents that opt in and out. By essentially testing if the two user groups differ in terms of their benefit and cost construct scores I will be able to accept or reject hypothesis 1 through 5. In order to calculate the effect size for independent-samples t-test Eta squared statistic will be calculated which measures the proportion of variance in the dependent variables that is explained by the independent variable, in this case Opt (Pallant, 2010); (Cohen, 1988). The eta squared equation is presented in Equation 1. The guidelines used to interpret the eta squared values are proposed by Cohen 1988, pp. 284–7 (Cohen, 1988).
EQUATION 1: ETA SQUARED EQUATION (COHEN, 1988) Eta squared= t2
t2 + (N1 + N2 – 2)
To explore the relationship between the demographic variable and the opt variable, I employed A chi-square d test for independence. An assumption of the chi-square tests’ is that each category has a minimum of five expected frequencies. If violated the Fisher’s Exact Probability Test corrects for this and was employed when this issue came up in the analysis (Gravetter & Wallnau, 2007). Since demographic data type is categorical and the opt variable is therefore this test is appropriate. Independent-samples t-test were no longer applicable because the demographic variables had more than three categories within them.
4.1 SAMPLE CHARACTERISTICS
There was a total of 231 questionnaire responses with nine respondents not fully completing the questionnaire. Therefore the sample total is 222 (completion rate of 96,1%) which is above the minimum recommended of 200 people (Hogarty, et al., 2005). 59,7% of the sample was female with an age range from 18 to 35 (95,7%). Nine respondents fell outside this age bracket. The majority of respondents had high school education (87,94%), 64,9% bachelor’s degree, 21,6% masters and 1,4% doctorate. The sample is almost evenly divided between employed and students (44,6%, 52,7%) and the majority respondents are single (93,2%). Just over half the respondents were European (59,5%), specifically from Germany, Portugal, and Hungary (31,2%, 18,2%, 10,4).
The majority of the North America respondents were Canadian (89,9%). Table 7 in Appendix 8.3 displays the full list of the sample characteristics.
4.2 PERCEIVED BENEFIT RESULTS
HEDONIC BENEFIT
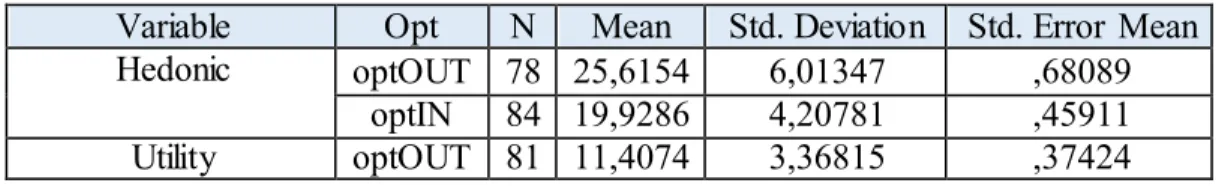
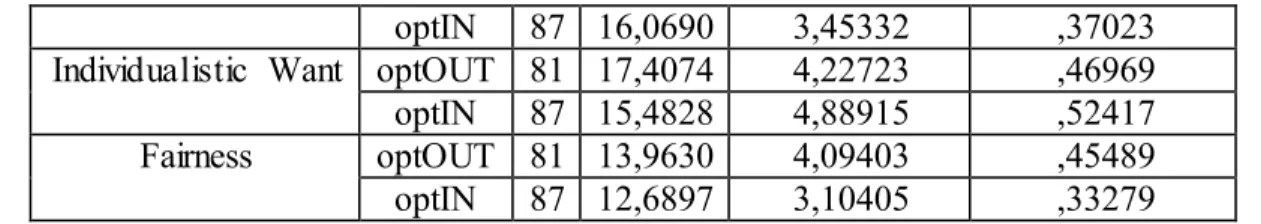
The average hedonic score of participants that opted out was 5,6868 higher than those that opted in (MoptOUT=25,6154, MoptIN=19,9286). A higher hedonic score represents that pleasure-seeking behaviour/hedonism is not greatly important to those respondents. Table 2 and 3 describes the statistical analysis in full detail.
To understand if the difference is significant between respondents that opt in and out, and thus accept or reject H1, an independent-samples t-test was done. The results of the analysis showed that there was a significant difference in scores for the group that opted out (M=25,6154, SD=6,01347) and the group that opted in (M=19,9286, SD=4,20781; t (136,715) = 6,925, p=0,014, two-talied). The magnitude of the differences in the means (mean difference=5,68681, 95% CI: – 4,06289 to 7,31074) was very large (eta squared=0,2597). From this analysis I conclude that the magnitude of the hedonic differences between opting in and out of co-creation was significant, and accounts for 25,97% of the variance thus validating the H1.
UTILITY BENEFIT
The average utility score of participants that opted out was 4,6616 lower than those that opted in (MoptOUT=11,4074, MoptIN=16,0690). A lower score means that respondents have a lower overall need for specific goods (insinuating a low need to co-create out of necessity). Table 2 and 3 describes the statistical analysis in full detail.
To understand if there is a significant difference in utility benefits received between respondents that opt in and out an independent-samples t-test was done. The results of the analysis showed that there was a significant difference in scores for the group that opted out (M=11,4074, SD=3,36815) in comparison to the group that opted in (M=16,0690, SD=3,45332; t (165,635) = -8,855, p=0,524, two-talied). The magnitude of the differences in the means (mean difference=-4,66156, 95% CI: -5,70094 to -3,62218) was very large (eta squared=0,3213). From this analysis it is concluded that the magnitude of the utility benefit differences between the group opting in and out of co-creation was significant, and accounts for 32,13% of the variance, therefore H2 is accepted.