Asian Online Journals (www.ajouronline.com) 18
Cluster Analysis of Business Data
Áurea Sousa1, Helena Bacelar-Nicolau 2, Osvaldo Silva 3 1
Department of Mathematics, CEEplA and CMATI, University of Azores, 9501-855 - Ponta Delgada, Portugal,
2
Laboratory of Statistics and Data Analysis, Faculty of Psychology, University of Lisbon, 1649-013-Lisboa, Portugal,
3
Department of Mathematics, CES and CMATI, University of Azores, 9501-855-Ponta Delgada, Portugal,
_________________________________________________________________________________
ABSTRACT— In this work, classical as well as probabilistic hierarchical clustering models are used to look for
typologies of variables in classical data, typologies of groups of individuals in a classical three-way data table, and typologies of groups of individuals in a symbolic data table. The data are issued from a questionnaire on business area in order to evaluate the quality and satisfaction with the services provided to customers by an automobile company. The Ascendant Hierarchical Cluster Analysis (AHCA) is based, respectively, on the basic affinity coefficient and on extensions of this coefficient for the cases of a classical three-way data table and a symbolic data table, obtained from the weighted generalized affinity coefficient. The probabilistic aggregation criteria used, under the probabilistic approach named VL methodology (V for Validity, L for Linkage), resort essentially to probabilistic notions for the definition of the comparative functions. The validation of the obtained partitions is based on the global statistics of levels (STAT).
Keywords—Cluster Analysis, Affinity Coefficient, VL Methodology, Complex Data, Global Statistics of Levels.
_________________________________________________________________________________
1.
INTRODUCTIONCluster analysis or classification usually concerns a set of exploratory multivariate data analysis methods and techniques for grouping either statistical data units (subjects, samples, subsets,…) or variables (homogeneous, heterogeneous, complex,…) into clusters of similar elements. In cluster analysis there is no prior knowledge about the clustering structure of the dataset. There are two main classes of clustering methods: hierarchic and non-hierarchic methods. In this paper we will focus on hierarchic agglomerative methods (Ascendant Hierarchical Cluster Analysis - AHCA).
Cluster Analysis is widely used in a variety of research and business areas, and computational advances have helped to simplify the application of clustering techniques to real datasets. In the field of business, clusters of consumer segments are often sought for successful marketing strategies. Using cluster analysis, a customer ‘type’ can represent a homogeneous market segment. In fact, customers respond better to segment marketing which addresses their specific needs, leading to increased market share and customer retention (Burns and Burns, 2008). In growing competitive world, marketing plays a vital role in every business firm (Premkanth, 2012).
The records of very large datasets makes imperative summarize these data in terms of their underlying concepts, which can only be described by symbolic data (complex data). The symbolic data types are generalizations of classical data types, and symbolic objects often synthesize information concerning a group of individuals of a population. Each entry of a symbolic data table can contain just one value or several values such as subsets of categories, intervals of real axes, or frequency distributions (Bock and Diday, 2000; Bacelar-Nicolau, 2000, 2002; Doria et al., 2013, Sousa et al.; 2013b). Rows correspond to symbolic objects (data units), whereas columns correspond to symbolic variables.
Several measures of proximity between symbolic objects have been proposed. An exhaustive review of some dissimilarities measures between symbolic objects is reported in Esposito et al. (2000).
A modal variable Y, with domain (or range or observation space) y, defined on a set E={a, b, ...} of objects, is a mapping Y(a)=(U(a), a), a E, where a is a non-negative measure in y, such as a frequency distribution, a probability or a weight distribution on the domain y and U(a) y is the support for a in domain y. If a is specified by a histogram,
Asian Online Journals (www.ajouronline.com) 19 Y is called a histogram variable. Y is a (bar or) diagram variable if the observation space yis finite and a is described by a bar diagram (Bock and Diday, 2000). In the case of symbolic data we concentrate here on data units described by modal variables.
The paper is organized as follows: Section 2 is related with the models of AHCA used in the present work. Subsection 2.1 is devoted to the clustering of variables based on the basic affinity coefficient in a classical context. Subsection 2.2 presents an extension of the basic affinity coefficient for the case of a classical three-way data table, which corresponds to a particular case of the weighted generalized affinity coefficient. Subsection 2.3 is dedicated to the clustering of symbolic objects described by modal variables based on the weighted generalized affinity coefficient in the field of the Symbolic Data Analysis. We present, in Section 3, the best partitions obtained with the application of AHCA to a dataset on business area.There, in order to cluster groups of individuals, we apply two different strategies based on the extensions of the basic affinity coefficient, which are referred in subsections 2.2 and 2.3, respectively. Finally, Section 4 contains some concluding remarks about the work and its results.
2. HIERARCHICAL AGGLOMERATIVE CLUSTERING MODELS
An agglomerative hierarchical method begins with every single object in a single cluster (singleton). It then successively merges the most similar clusters together until the entire set of data becomes one group. In this work, we use the basic affinity coefficient and the weighted generalized affinity coefficient (see, subsections 2.1, 2.2, and 2.3) as the basis of hierarchical clustering algorithms (classical and probabilistic aggregation criteria) in our approach to this subject.
2.1. Clustering of variables based on the basic affinity coefficient in a classical context
From the affinity coefficient between two discrete probability distributions proposed by Matusita (1951) as the basic similarity measure for comparing two laws of the same type, Bacelar-Nicolau (1980, 1988) introduced the affinity coefficient, as a basic similarity coefficient between pairs of variables or of subjects in cluster analysis context (corresponding to pairs of columns or rows of a data matrix) as follows.
Let’s suppose we want to classify a set of p variables, describing N data units, where the Np cells of the corresponding data table contain one single real non-negative value. The entry of this data matrix is the value that
corresponds to the i-th individual and to the j-th variable, and the rows correspond to the description of the N data units by p variables to be classified, represented in the columns. The basic affinity coefficient between the variables Vj and Vj´ (abbreviated, j and j’), with j j’, is defined by:
, (1)
where:
and .
The affinity coefficient , defined by formula (1), takes values in the interval [0, 1]. A theoretical study of the affinity coefficient and their asymptotic normal distributions may be found e.g. in Bacelar-Nicolau (1980, 1988). An empirical study on the asymptotic distribution of the basic affinity coefficient used in this paper can be found in Sousa (2005) and Sousa et al. (2013a). The simulation studies have led to the conclusion that the convergence of the affinity coefficient for the normal distribution is quite fast and, in general, a good approximation is obtained for small sample sizes, that is for sample sizes above 20 and in many cases for sample sizes above 10.
2.2.
Clustering of groups of individuals based on a particular case of the weighted generalized
affinity coefficient
The aim of this approach is to provide a method to compare independent groups of individuals without loss information related to the individuals belonging to each one of these groups.
Consider H initial sub-tables (one sub-table for each of the independent groups of individuals) containing, respectively, N1, N2,…, NH, individuals and p identical variables. We take a Simple Random Sampling (SRS) of individuals of each sub-table. Each entry of the sub-table Th, (h=1,.., H) contains the responses given by the individuals of the group h, for the variables V1, V2,…, Vp. Thus, in this approach, the H sub-tables represent independent groups of individuals, and each new sub-table contains the same number (m) of individuals (selected from a stratified random sampling). Therefore, the global data table, Table 1, is a classical three-way data table (each cell
Asian Online Journals (www.ajouronline.com) 20 contains a single value), where each sub-table corresponds to a (mp) data table, and , with i=1,…, m, h=1,…, H, and j=1,…, p is the value of the individual i, belonging to the sub-table Th (abbreviated, h), in the j-th variable.
Table 1:Part of the classical three-way data matrix
1 ... 2 ...
...
h ...
... m ...In this approach, for instance, the value of the global affinity coefficient between sub-tables h and h’, with h≠ h’, is given by: ,
(2) with: ,
where is the local affinity between sub-tables h and h’ on what variable j is concerned,
and . This is a particular case of the weighted generalized affinity coefficient, for complex or symbolic
objects (Bacelar-Nicolau, 2000; Bock and Diday, 2000), which will be addressed in the next section.
2.3.
Clustering of symbolic objects described by modal variables based on the weighted generalized
affinity coefficient
The affinity coefficient given by formula (1) was extended to different types of data, including complex or symbolic and heterogeneous data (Bacelar-Nicolau, 2000; Bacelar-Nicolau et al., 2009, 2010), and a methodology for finding clustering models or adaptive families of clustering models based on (successive) generalizations of that coefficient has been developed (Nicolau, 1983; Nicolau and Bacelar-Nicolau, 1998, 1999). Here, we concentrate on clustering of modal variables in the case of symbolic data.
Given a set of N data units which are complex or symbolic objects described by p modal variables, Y1,...,Yp, a resemblance measure between a pair of symbolic objects k, k’ (k, k’=1,…,N), called weighted generalized affinity coefficient, is given by (Bacelar-Nicolau, 2000, 2002; Bock and Diday, 2000; Nicolau and Bacelar-Nicolau, 1999):
, (3)
where: is the generalized local affinity between and over the j-th variable, mj is the number of modalities of the j-th variable (each variable may have a different number of “modalities”); is the number or the
proportion of individuals (in the unit ) which share category ℓ of variable Yj; , and
and are weights such that , . The weighted generalized affinity coefficient, , takes values in the interval [0,1]. Moreover, the weighted generalized affinity coefficient given by formula (3) is suitable when mixed variables types are present in a database since the same coefficient can work for different variables types (for details, see Bacelar-Nicolau et al., 2009, 2010).
Given a similarity matrix, a dataset can be classified through classical aggregation criteria or probabilistic ones. Each new cluster is represented by a symbolic object, and the weighted generalized affinity coefficient is used for re-evaluate the links of the new symbolic object with each one of the remaining symbolic objects.
The VL methodology (V for Validity, L for Linkage) is a probabilistic approach for clustering methods, based on the cumulative distribution function of basic similarity coefficients, and the probabilistic aggregation criteria under these
Asian Online Journals (www.ajouronline.com) 21 methodology resort essentially to probabilistic notions for the definition of the comparative functions (Lerman 1970, 1981; Nicolau, 1983; Bacelar-Nicolau, 1985, 1987, 1988; Nicolau and Bacelar-Nicolau, 1998).
An essential problem in Cluster Analysis is to determine the best number of clusters. The values of validation indexes obtained from the values of the similarity matrix between elements can be calculated, even in the case of symbolic data matrices (Sousa, 2005; Sousa et al., 2010, 2013b). On what validation of results is concerned, in this paper, we choose to use the global statistics of levels (STAT), as proposed by Lerman (1970, 1981) and Bacelar-Nicolau (1980, 1985), in both paradigms (classical and symbolic data).
3. CASE STUDY: EVALUATION ON THE QUALITY OF THE SERVICES GIVEN TO THE CUSTOMERS BY AN AUTOMOBILE COMPANY
A questionnaire was used to evaluate the quality and satisfaction with the services provided to customers by an automobile company. This questionnaire contains, among others, the following variables: V1- Office hours; V2- Facility of marking of the services; V3-Order and cleanliness at the reception desk; V4-Efficiency of the reception; V5- Explanation of the work to be performed and of the estimated costs associated with the repair; V6-Communication of unexpected problems during the repair; V7-Explanation of the service after the repair; V8- Courtesy of the receptionist; V9-Comfort of the waiting room; V10-Cost of intervention: workmanship; V11-Cost of intervention: substituted parts; V12-Delivery of clean and tidy unused parts; V13-Elimination of the presented deficiency at 1st inspection; V14-Fulfilment of the stated period for repair; V15-State of cleanliness of the vehicle after repair; V16-Understanding of the specific needs of the customer; V17-Personalized reception by the receptionist; V18- Accordance between the service performed and the requested one. The variables (items) referred above are measured in a scale with ordered modalities (1- very dissatisfied, 2- generally dissatisfied, 3- neither satisfied nor dissatisfied, 4- generally satisfied and 5- very satisfied). Other variable is considered in the present study: V19 –Professional occupation, with 11 modalities that are indicated in Table 2:
Table 2: Modalities and number of individuals in each modality of variable V19 Professional Occupations (Modalities)
Modalities Number of individuals
O1- Doctors; architects and engineers 45
O2- Teachers 40
O3-Businessmen 79
O4-Salesmen 42
O5-Employees of banks and insurance companies 38
O6-Military and police 40
O7-Administrative and similar 35
O8- Employees of the civil construction 34
O9- Employees of the commerce and industry 51
O10- Employees of hotels and restaurants 24
O11- Employees of other services 22
Total 450
The measures of comparison between elements (referred in subsections 2.1, 2.2 and 2.3) were combined with two classical aggregation criteria, Single Linkage (SL) and Complete Linkage (CL), and three probabilistic aggregation criteria, AVL, AV1, and AVB.
3.1. Clustering of the variables (V1 to V18)
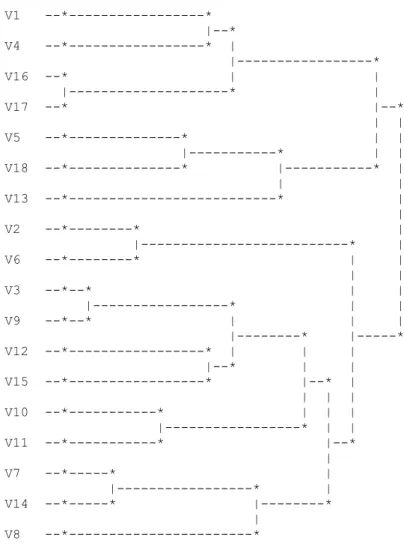
The initial classical data matrix (450 ×19) is composed by 450 customers (individuals) and 19 items. In this subsection, the basic affinity coefficient was used as a similarity measure between the variables (V1 to V18). Figure 1 presents the dendrogram obtained with the AV1 method.
According to the index STAT, the best partition is a partition into three clusters obtained at level 15 by all applied aggregation criteria:
Cluster 1 is formed by the variables 1, 4, 16 and 17, which have to do with the capacity of the organization to give personalized attention to the customer, which is in the base of the development of empathy between the customer and the company.
Asian Online Journals (www.ajouronline.com) 22 the organization to provide a necessary and reliable service.
Cluster 3 is formed by the variables 2, 6, 3, 9, 12, 15, 10, 11, 7, 14 and 8, which are related to the tangibility and reception of the company. The subclass formed by variables 3, 9, 12 and 15 has to do with the physical component of the service rendered, including the conditions of the installations and the equipment. The subclass with variables 2 and 6 has to do with the will to support the customers and give them a fast reply. The subclass formed by the variables 7, 14 and 8 deals with the knowledge, the courtesy of the employees and their capacity to generate confidence.
V1 --*---* |--* V4 --*---* | |---* V16 --* | | |---* | V17 --* |--* | | V5 --*---* | | |---* | | V18 --*---* |---* | | | V13 --*---* | | V2 --*---* | |---* | V6 --*---* | | | | V3 --*--* | | |---* | | V9 --*--* | | | |---* |---* V12 --*---* | | | |--* | | V15 --*---* |--* | | | | V10 --*---* | | | |---* | | V11 --*---* |--* | V7 --*---* | |---* | V14 --*---* |---* | V8 --*---*
Figure 1: Dendrogram obtained with AV1
3.2. Clustering of the professional occupations
The clustering of the 11 professional occupations was made according to two strategies:
A) Approach for the case of a classical three-way data table
In this approach, we compare the professional occupations related with the individuals belonging to each one of the professional occupations in the present dataset. The AHCA of the 11 professional occupations was based on 11 sub-tables containing the same number (m=22) of individuals (independent groups), where (see Section 2.2), and 18 identical variables (V1 to V18).
Let a table as Table 1 (classical three-way data table), where each sub-table corresponds to a (2218) classic data table, and , with i=1,…, 22, h=1,…, 11, and j=1,…, 18 is the response given by the individual i of the sub-table h (professional occupation h) in the variable Vj.
In this approach, according to formula (2), the value of the global affinity coefficient, for instance, between the professional occupations 1 (O1) and 2 (O2), that corresponds to sub-tables 1 (T1) and 2 (T2), respectively, is given by:
Asian Online Journals (www.ajouronline.com) 23 , with: ,
where is the local affinity between sub-tables 1 and 2 on what variable j is concerned, and .
Here we present only the dendrogram from the AVL method (see Figure 2). The option by this dendrogram resulted of the fact that one of the partitions obtained by this aggregation criterion presented the maximal value (3.3387) of STAT.
O1 --*---* |---* O7 --*---* |---* | | O6 --*---* |---* | | O11 --*---* | | O2 --*---* |--* |---* | | O4 --*---* | | | | | | O3 --*--* |--* | |---* | | O8 --* | | | | |--* |---* | O10 --* | | | | O9 --*---* | | O5 --*---*
Figure 2: Dendrogram obtained with AVL
The selected partition is a partition into five clusters:
Cluster 1: O1- Doctors; architects and engineers, O7-Administrative and similar, O6-Military and police;
Cluster 2: O11- Employees of other services;
Cluster 3: O2- Teachers, O4-Salesmen;
Cluster 4: O3-Businessmen, O8- Employees of the civil construction, O10- Employees of hotels and restaurants, O9-
Employees of the commerce and industry;
Cluster 5: O5-Employees of banks and insurance companies.
B) Approach based for the case of a symbolic data table for modal variables
In this approach, we consider the clustering of symbolic data units (professional occupations) described by modal variables. In the dataset (Business Data) under investigation, the individuals were distributed into eleven groups by a SQL query according to their professional occupation (see tables 2 and 3).
Asian Online Journals (www.ajouronline.com) 24
Table 3: Part of the symbolic data matrix
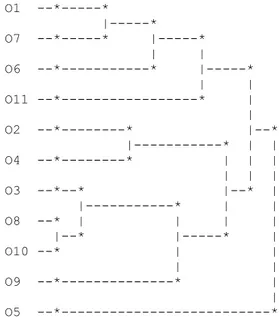
Figure 3 shows the dendrogram associated with the AVL and AV1 methods. According to the value of the STAT index (5.5372), the best partition is a partition into three clusters, which was obtained at level 8 by all aggregation criteria:
Cluster 1: O1- Doctors; architects and engineers, O3-Businessmen, O11- Employees of other services;
Cluster 2: O4-Salesmen, O5-Employees of banks and insurance companies, O9- Employees of the commerce and
industry, O10- Employees of hotels and restaurants;
Cluster 3: O2-Teachers, O6-Military and police, O7-Administrative and similar, O8- Employees of the civil
construction. O1 --* |---* O3 --* |---* | | O11 --*---* | |--* O4 --*---* | | |---* | | O10 --*---* | | | |---* | O5 --*---* | | |---* | O9 --*---* | | O2 --*---* | |---* | O6 --*---* | | |---* O7 --*--* | |---* O8 --*--*
Figure 3: Dendrogram obtained by AVL and AV1 methods
The results provided by both strategies were compared, and the differences found are due to the small number (22) of individuals of each professional occupation when we apply the first approach as a consequence of a sampling process. Although, we might have opted by inquire a largest number of individuals of each professional occupation, during the planning of the investigation.
4. CONCLUDING REMARKS
The application to data from Business allowed us to illustrate the application of the basic affinity coefficient to a classical two-way data table, and its extensions to a classical three-way data table, and to a symbolic data table based on
Asian Online Journals (www.ajouronline.com) 25 the generalized weighted affinity coefficient, as well as the extension of the VL methodology to the AHCA of these types of data. These methods were used to group the variables, and the professional occupations into homogeneous and distinct groups. The differences between groups of individuals (customer segmentation) are useful to develop more efficient marketing strategies.
The clustering of the professional occupations was made according to two strategies: one based on a particular case of the generalized weighted affinity coefficient for the case of a classical three-way data table, and the other one based on the weighted generalized affinity coefficient for modal variables. In the case of the first one, we loss information because we can´t work with the total sample but only with a stratified random sampling. Contrary, in the second approach it is possible to work with the entire sample.
The strategy referred to the case of a classical three-way data table can also be applied when the H sub-tables contain the responses given by the same individuals in different moments of time, for the variables V1, V2,…, Vp. The used measure of validation STAT proved to be useful in the determination of the appropriate number of clusters.
Possible directions of research include the application of the methodology to others datasets in various fields of study, and the development of a more user-friendly software. It is of interest to apply the approach based on the generalized weighted affinity coefficient for symbolic data to the AHCA of very large datasets, which are becoming more frequent.
5. REFERENCES
[1] Bacelar-Nicolau, H., “Contributions to the Study of Comparison Coefficients in Cluster Analysis”, PhD Thesis (in Portuguese), Universidade de Lisboa, 1980.
[2] Bacelar-Nicolau, H., "The affinity coefficient in cluster analysis", Methods of Operations Research, vol. 53, Martin J. Bekmann et al (ed.), Verlag Anton Hain, Munchen, pp. 507-512, 1985.
[3] Bacelar-Nicolau, H., "On the distribution equivalence in cluster analysis”, In Proceedings of the NATO ASI on Pattern Recognition Theory and Applications, Springer - Verlag, New York, pp. 73-79, 1987.
[4] Bacelar-Nicolau, H., “Two Probabilistic Models for Classification of Variables in Frequency Tables”, In: Bock, H.-H. (Eds.), Classification and Related Methods of Data Analysis, North Holland, pp. 181-186, 1988.
[5] Bacelar-Nicolau, H., “The Affinity Coefficient”, In: Analysis of Symbolic Data: Exploratory Methods for Extracting Statistical Information from Complex Data, H.-H. Bock and E. Diday (Eds.), Series: Studies in Classification, Data Analysis, and Knowledge Organization, Springer-Verlag, Berlin, pp. 160-165, 2000.
[6] Bacelar-Nicolau, H., “On the Generalised Affinity Coefficient for Complex Data”, Biocybernetics and Biomedical Engineering, vol. 22, no. 1, pp. 31-42, 2002.
[7] Bacelar-Nicolau, H.; Nicolau, F.C.; Sousa, Á.; Bacelar-Nicolau, L., “Measuring Similarity of Complex and Heterogeneous Data in Clustering of Large Data Sets”, Biocybernetics and Biomedical Engineering, vol. 29, no. 2, pp. 9-18, 2009.
[8] Bacelar-Nicolau, H.; Nicolau, F.C.; Sousa, Á.; Bacelar-Nicolau, L., “Clustering Complex Heterogeneous Data Using a Probabilistic Approach”, In Proceedings of Stochastic Modeling Techniques and Data Analysis International Conference (SMTDA2010), pp. 85-93, 2010 (electronic publication) .
[9] Bock, H.-H. and Diday, E., Analysis of Symbolic Data: Exploratory Methods for Extracting Statistical Information from Complex Data, Series: Studies in Classification, Data Analysis, and Knowledge Organization, Springer-Verlag, Berlin, 2000.
[10] Burns, Robert and Burns, Richard, Business Research Methods and Statistics using SPSS, SAGE Publications Ltd, 2008.
[11] Doria, I.; Sousa, Á; Bacelar-Nicolau, H., Le Calvé; G., “Comparison of Modal Variables Using Multivariate Analysis”, In: Advances in Regression, Survival Analysis, Extreme Values, Markov Processes and Other Statistical Applications, Studies in Theoretical and Applied Statistics, João Lita da Silva, Frederico Caeiro, Isabel Natário and Carlos A. Braumann (Eds.), Springer, Berlin, Heidelberg, pp.363-370, 2013.
[12] Esposito, F., Malerba, D., Tamma, V., “Dissimilarity Measures for Symbolic Objects”, In: Analysis of Symbolic Data: Exploratory Methods for Extracting Statistical Information from Complex Data, H.-H. Bock and E. Diday (Eds.),: Springer-Verlag, Berlin, pp. 165-185, 2000.
[13] Lerman, I. C., “Sur l`Analyse des Données Préalable à une Classification Automatique (Proposition d’une Nouvelle Mesure de Similarité) ”, Rev. Mathématiques et Sciences Humaines, vol. 32, no. 8, pp. 5-15, 1970.
[14] Lerman, I. C., Classification et Analyse Ordinale des Données, Dunod, Paris, 1981.
[15] Matusita, K., “On the Theory of Statistical Decision Functions”, Ann. Instit. Stat. Math, vol. III, pp. 1-30, 1951. [16] Nicolau, F.C., “Cluster Analysis and Distribution Function”, Methods of Operations Research, vol. 45, pp. 431-433,
Asian Online Journals (www.ajouronline.com) 26 [17] Nicolau, F.C. and Bacelar-Nicolau, H., “Some Trends in the Classification of Variables”, In: Hayashi, C., Ohsumi,
N., Yajima, K., Tanaka, Y., Bock, H.-H., Baba, Y. (Eds.), Data Science, Classification, and Related Methods. Springer-Verlag, pp. 89-98, 1998.
[18] Nicolau, F.C. and Bacelar-Nicolau, H., “Clustering Symbolic Objects Associated to Frequency or Probability Laws by the Weighted Affinity Coefficient”, In: Applied Stochastic Models and Data Analysis, Quantitative Methods in Business and Industry Society (ASMDA99), H. Bacelar-Nicolau, F.C. Nicolau and Jacques Janssen (Eds.), INE, Lisboa, Portugal, pp. 155-158, 1999.
[19] Premkanth, P., “Market Segmentation and Its Impact on Customer Satisfaction with Especial Reference to Commercial Bank of Ceylon PLC”, Global Journal of Management and Business Research (GJMBR), vol. 12, no. 17, Version 1.0, 2012.
[20] Sousa, Á., “Contributions to the VL Methodology and Validation Indexes for Data of Complex Nature”, PhD Thesis (in Portuguese), Universidade dos Açores, 2005.
[21] Sousa, Á., Nicolau, F., Bacelar-Nicolau, H., Silva, O., “Weighted Generalised Affinity Coefficient in Cluster Analysis of Complex Data of the Interval Type”, Biometrical Letters, vol. 47, no. 1, pp. 45-56, 2010.
[22] Sousa, Á., Silva, O., Bacelar-Nicolau, H., Nicolau, F.C., “Distribution of the Affinity Coefficient between Variables based on the Monte Carlo Simulation Method”, Asian Journal of Applied Sciences, vol. 1, no. 5, pp. 236-245, 2013a. [23] Sousa, Á., Tomás, L, Silva, O., Bacelar-Nicolau, H., “Symbolic Data Analysis for the Assessment of User
Satisfaction: an Application to Reading Rooms Services”, European Scientific Journal (ESJ), June 2013/Special/Edition no. 3, pp. 39-48, 2013.