Validation of SSR-tetranucleotide multiplex panel for kinship
evaluation in tilapia breeding programs
1Validação de painel multiplex SSR-tetranucleotídeo para avaliação de parentesco em
programas de seleção de tilápias
Suzane Fonseca Freitas2*, Heden Luiz Marques Moreira3, Daiane Machado Souza2, Carla Giovane Ávila
Moreira3, Rafael Aldrighi Tavares2 and Nelson José Laurino Dionello2
ABSTRACT - This study aimed to develop PCR assays, reaction combinations, and validation of tetranucleotide SSR loci
for tilapia, to minimize the impact of erroneous allele inferences on genotype determination of this marker. Microsatellites containing tetranucleotide repeats were obtained from tilapia genome, version 2.1, avoiding loci in the same linking group. Primers were designed for different fragment sizes, and fluorescence added to each locus. A total of 10 loci were amplified, separately and in combination, and loaded into a single capillary sequencer panel. Alleles were amplified without stutters and easily interpreted. PCR amplifications of DNA repeatedly extracted from samples, and genotyping at different PCR rounds were performed to infer allele signaling errors. The panel obtained in this study is currently used in kinship analyses and pedigree corrections in a tilapia breeding program.
Key words: Genetic variability. Genotyping. Microsatellite markers.
RESUMO - O objetivo deste trabalho foi desenvolver ensaios de PCR e combinação de reações e validação de loci SSR de
tetranucleotídeos para tilápias, visando minimizar o impacto de inferências errôneas de alelos na determinação dos genótipos deste tipo de marcador. Os microssatélites contendo repetições de tetranucleotídeos foram obtidos da versão 2.1 do genoma de tilápia, evitando a escolha de locus no mesmo grupo de ligação. Primers foram desenhados para diferentes tamanhos de fragmentos e fluorescências adicionadas a cada locus. Um total de 10 loci foram amplificados em separado e em combinações e carregados conjuntamente em um único painel em sequenciador capilar. Os alelos foram amplificados sem stutter e facilmente interpretados. Amplificações de PCR de DNA extraído de amostras repetidas e genotipagem em diferentes rodadas de PCR foram utilizadas para inferência de erros de assinalamento de alelos. O painel obtido neste estudo está sendo empregado na análise de parentesco e correção de pedigree em um programa de melhoramento genético desta espécie.
Palavras-chave: Genotipagem. Marcadores microssatélites. Variabilidade genética.
DOI: 10.5935/1806-6690.20200068
Editor do artigo: Andrea Pereira Pinto - [email protected] *Author for correspondence
Received for publication in 29/11/2019; approved in 25/05/2020
1Parte da Tese de Doutorado do primeiro autor apresentada ao Programa de Pós-Graduação em Zootecnia da Universidade Federal de Pelotas 2Programa de Pós-Graduação em Zootecnia/PPGZ, Departamento de Zootecnia, Universidade Federal de Pelotas/UFPel, Pelotas-RS, Brasil, suzane.
[email protected] (ORCID ID 0000-0002-1652-8729), [email protected] (ORCID ID 0000-0003-0755-456X), [email protected] (ORCID ID 0000-0003-1094-7794), [email protected] (ORCID ID 0000-0001-9921-3556)
3Departamento de Ecologia, Zoologia e Genética/DEZG, Laboratório de Engenharia Genética Animal/LEGA, Universidade Federal de Pelotas/
UFPel, Pelotas-RS, Brasil, [email protected] (ORCID ID 0000-0002-3974-7545), [email protected] (ORCID ID 0000-0002-9220-4785)
INTRODUCTION
Kinship analysis is influenced by errors in pedigree determination and genotyping. Uncertain estimates of true kinship relationships caused by these errors may contribute to incorrect management decisions in genetic selection programs (POMPANON
et al., 2005; PUTNAN; IVY, 2014). In aquaculture,
especially in tilapia culture, information regarding pedigree, and the evaluation of generational genetic diversity is often difficult, given the large number of offspring per spawning, resulting in many animals per family in selection programs (TIBIHIKA et al., 2019; YANG et al., 2014).
Therefore, molecular markers, like SSR (Simple Sequence Repeat) or microsatellites and SNP (Single Nucleotide Polymorphism), have been widely used to correct possible genealogical registration errors, supporting previous studies based on phenotype alone, as well as reducing endogamic effects and loss of variability of genetically improved strains (PUTNAM; IVY, 2014; TURCHETTO-ZOLAT et al., 2017). Some advantages of SNPs over SSRs have made them more popular over recent years (PUTMAN; CARBONE, 2014). Some of the advantages cited include the greater abundance in genomes, higher number of data obtained, lower rate of genotyping errors, and lower costs per simple genotype (ZHAN et al., 2017). Conversely, SSRs markers are more powerful than SNPs in detecting mixtures, with improved accuracy determination as a higher proportion of errors can be detected in pedigree analysis with many alleles per locus (GUICHOUX et al., 2011). However, when considering cost, improved discrimination power, and the genotyping of microsatellites through next generation sequencing (NGS), this type of marker out-performs SNPs (JOSHI; RAM; LOHANI, 2017; PUCKETT, 2017).
However, for SSRs markers to be effective, a need for dinucleotide substitution with tetranucleotides exists, given the advantage of tetranucleotides in reducing genotyping errors and greater accuracy in genotype inference (JONES et al., 2010).
Based on this, we aimed to develop and validate a multiplex SSR-tetranucleotide panel for tilapia, aimed at reducing genotyping errors and improving the estimation of breeding relationships in tilapia selection programs.
MATERIAL AND METHODS
Sample Collection and DNA Extraction
A total of 70 caudal fin samples from the first and second generation of the genetic bank of Copacol
Cooperative and the Rei da Tilapia Company were used for analyses. Extraction of genomic DNA was performed through organic precipitation by NaCl and TNE1 buffers (5 mL Tris HCl pH 8.0, 10 mL EDTA, 1 mL NaCl, 84 mL ultrapure water), TNE2 (5 mL Tris HCl pH 8.0, 10 mL EDTA, 1 mL NaCl, 10 mL SDS 20%, 74 mL ultrapure water), and Proteinase K (20 mg/mL) for cell- and protein lysis, respectively. DNA concentrations and quality were estimated with 1% agarose gel electrophoresis, in which intact bands absent of any signs of degradation and/or contamination were used (HUYNH et al., 2017) and stained with GelRed (Biotium, USA) for visualization in a UV light transilluminator.
Primer design
Using the Oreochromis niloticus genome from the GenBank database of the National Center for Biotechnology Information - NCBI (assembly accession GCA_001858045.3, ncbi.nlm.nih.gov), matching microsatellite sequences were searched.
After screening the genome for primer designs, the following parameters were established using the Primer3 software: melting temperature (Tm) between the forward and reverse primers of less than 3 °C, GC content lower than 60%, primer size preferably 18 to 24 bases, repetition of the motif sequence at 8 to 12 times, choice of loci microsatellites containing only tetranucleotides, and amplicon size of less than 450 bp. Additionally, for multiplex viability, loci of different molecular sizes were recommended (KORESSAAR; REMM, 2007; UNTERGASSER et al., 2012).
Of the potentially amplifiable loci identified by the software, microsatellites were elected in linkage groups 01, 02, 05, 06, 07, 08, and 10. BLASTn (Basic Local Alignment Search Tool for nucleotide) was used to determine the alignment matching in pairs, in which E values equal to 0 were identified. This way only primers originating from unique sequences of matches in the genome were selected to establish primer specificity. Finally, 10 loci that best fit the established criteria were synthesized for multiplex construction.
Amplification of SSR and validation
PCR were performed on all animals, at a 25 µL volume, with 10-50 ng DNA template, 1 U Red Jumpstart Taq polymerase (Sigma-Aldrich, USA), 200 µM dNTPs (Sigma-Aldrich, USA), and forward and reverse primers at 5 pmoles/µL (IDT DNA, USA). Amplification was performed on a GeneTouch thermal cycler (Bioer, China) with the following conditions: denaturation at 94 °C for 5 min, followed by 30–35 cycles of 94 °C for 30 s, annealing according to Table 1 for 30 s, elongation at 72 °C for 40 s, and final extension at 72 °C for 10 min.
After confirming the amplification by electrophoresis in 2.5% agarose-gel, validation of the SSR sequence was performed by sequencing. Reverse primers of the OniUFPel01, 02, 03 and 06 loci were marked with 6-FAM fluorescence, OniUFPel04, 05, and 07 with HEX fluorescence, and OniUFPel08, 09, and 10 with NED fluorescence.
To establish the validation of the proposed multiplex panel, UNH104, UNH148, UNH160, UNH178, UNH208, UNH222, UNH934, ISP, PRL1, and PRL2 loci SSR dinucleotides were amplified for comparison (DIAS et al., 2016; RUTTEN et al., 2004). For both di- and tetranucleotides, the allele sizes were estimated in capillary electrophoresis in an ABI3730xl System sequencer and compared to the pattern size 400HD (Macrogen, Korea). Allele sizing was performed with the Peakscanner program (Fisher Biotech, USA), publicly available from the internet. The evaluation of polymorphic information content (PIC) per locus for the tetra panel was calculated using the software Cervus 3.0.
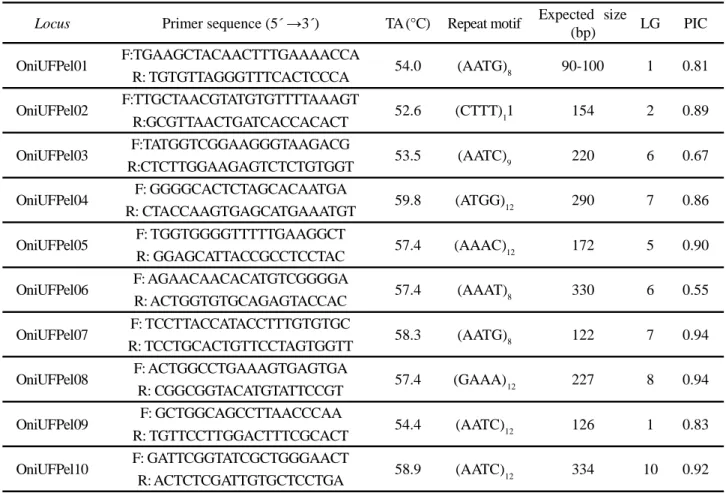
Locus Primer sequence (5´ →3´) TA (°C) Repeat motif Expected size
(bp) LG PIC
OniUFPel01 F:TGAAGCTACAACTTTGAAAACCA 54.0 (AATG)8 90-100 1 0.81
R: TGTGTTAGGGTTTCACTCCCA
OniUFPel02 F:TTGCTAACGTATGTGTTTTAAAGT 52.6 (CTTT)11 154 2 0.89
R:GCGTTAACTGATCACCACACT
OniUFPel03 F:TATGGTCGGAAGGGTAAGACG 53.5 (AATC)9 220 6 0.67
R:CTCTTGGAAGAGTCTCTGTGGT
OniUFPel04 F: GGGGCACTCTAGCACAATGA 59.8 (ATGG)12 290 7 0.86
R: CTACCAAGTGAGCATGAAATGT
OniUFPel05 F: TGGTGGGGTTTTTGAAGGCT 57.4 (AAAC)12 172 5 0.90
R: GGAGCATTACCGCCTCCTAC
OniUFPel06 F: AGAACAACACATGTCGGGGA 57.4 (AAAT)8 330 6 0.55
R: ACTGGTGTGCAGAGTACCAC
OniUFPel07 F: TCCTTACCATACCTTTGTGTGC 58.3 (AATG)8 122 7 0.94
R: TCCTGCACTGTTCCTAGTGGTT
OniUFPel08 F: ACTGGCCTGAAAGTGAGTGA 57.4 (GAAA)12 227 8 0.94
R: CGGCGGTACATGTATTCCGT
OniUFPel09 F: GCTGGCAGCCTTAACCCAA 54.4 (AATC)12 126 1 0.83
R: TGTTCCTTGGACTTTCGCACT
OniUFPel10 F: GATTCGGTATCGCTGGGAACT 58.9 (AATC)12 334 10 0.92
R: ACTCTCGATTGTGCTCCTGA
RESULT AND DISCUSSION
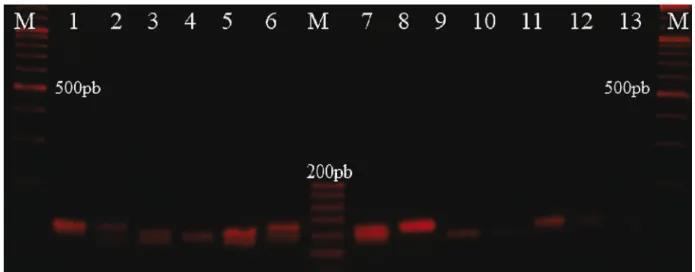
The SSR-tetranucleotide primers designed with Primer3 (Table 1) were effective and produced clear bands with expected in silico analysis size. After confirmation of the amplified sequences (Figure 1), the analysis allowed the establishment of multiplex PCR according to allele size and combining FAM, HEX, and NED fluorescence.
Polymorphic information content (PIC) refers to the power of the molecular marker in determining existing polymorphisms in the study population. The index ranges from 0 to 1, where PIC > 0.5 are considered highly informative, 0.5 to 0.25 as reasonably informative, and PIC < 0.25 as less informative (BOTSTEIN et al., 1980).
As shown by the PIC listed in Table 1, all markers selected for the composition of the multiplex were highly polymorphic, as shown in Figure 2, in which it exemplifies different genotypes observed for a portion of analyzed samples of the OniUFPel09
locus, with similar efficacy as a tool for differentiating
between individuals.
Table 1 - Loci characteristics, including name, primer sequences, annealing temperature (TA), repeat motif, expected size, linkage
SSR markers are characterized by high mutation rates ranging from 10−4 to 10−3 per generation,
leading to the codominant and highly discriminating characteristics (AMOUSSOU et al., 2019; BAGSHAW, 2017).
According to Lee-Montero et al. (2013), marker validation is achieved by evaluating the polymorphism and possible genotyping errors through comparison tests, thus establishing nomenclature patterns and procedures for use.
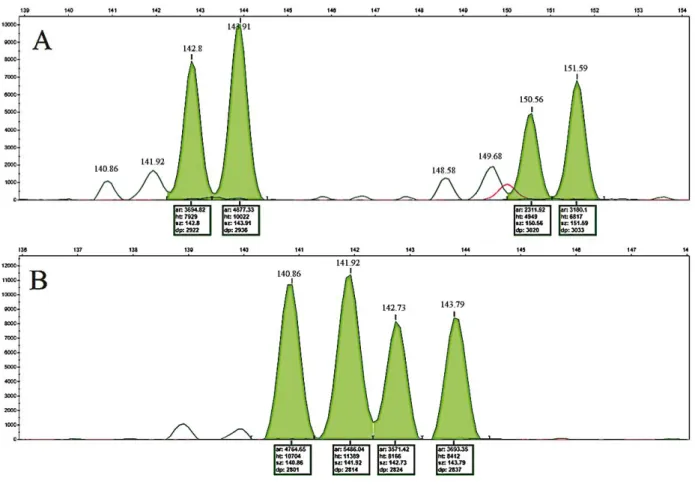
Stutter band patterns for dinucleotides can be observed by capillary electrophoresis in Figure 3A and 3B. From the RFUs (Relative Fluorescence Units), the size peaks of 140.86 and 141.92 indicates minor alleles, while 148.58 and 149.68 peaks can be discarded as alleles, since their values are lower than 15% of that of major peaks (SULLIVAN et al., 1992). Considering this, two peaks with 142.8 and 150.56 on each allele can still be seen. However, by comparing RFUs it can be inferred that the genotype of the reproducer is 144–152 (Figure-3A).
Figure 2 - Electrophoretic profile in 2.5% agarose gel, illustrating the polymorphism observed in the tetranucleotide OniUFPel09
(expected size of 126 base pairs). M = molecular weight marker, 1 to 13 = amplified samples. Samples: 2, 5, 6, 12 were heterozygotes; samples: 4, 8, 9, 10, 11, 13 were homozygotes, and samples: 1, 3, 7 were not susceptible to agarose gel determination (the mentioned electrophoresis contains a sample of the analyzed data for exemplification)
Figure 1 - Electropherogram showing confirmation of SSR sequences of OniUFPel01(A), OniUFPel02(B), and OniUFPel06(C), with
Conversely, the pattern observed in Figure 3B could not be precisely defined, since 4 peaks with values of 140.86, 141.92, 142.73, and 143.79 were observed. Therefore, this reproducer could be classified as both containing the genotypes 140–142, and 142-144, demonstrating the potential confusion in the interpretation of this information.
Recent reports (HAMOY et al., 2011; JONES
et al., 2010; OLAFSSON et al., 2010) highlighted the
complexity of analyzing dinucleotide patterns in the laboratory, given the instability in PCR amplification which commonly promotes the compromise of genotyping results.
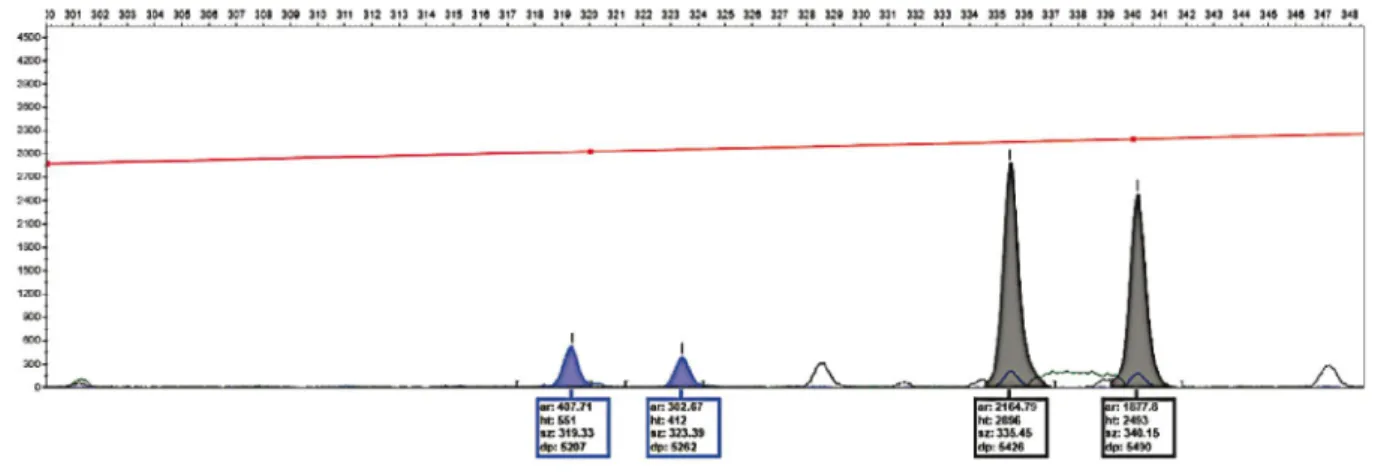
Figure 4 illustrates the electrophoretic patterns of two loci contained in the proposed multiplex, in which it is possible to observe the absence of a stutter pattern for SSR-tetranucleotides. Alleles 319 and 323 are clearly identified at OniUFPel06, and alleles 336 and 340 at OniUFPel10.
Figure 3 - Electropherogram of the dinucleotide UNH178 marked with HEX fluorescence. The column on the left represents
the RFU. The upper line indicates the size in base pairs. A = Heterozygous reproducer, B = Stutter band reproducer with allele confounding
Traditionally, microsatellite studies for population analyses include di-, tri-, or tetra-nucleotides repeats, i.e. two, three, or four base pair repeats. However, the evaluation of tetranucleotide microsatellites in particular has been pursued, since the minimum expected allele differentiation is four base pairs, which favors the visualization and interpretation of these polymorphisms in addition to the lower prevalence of stutter bands compared with dinucleotides (JONES et al., 2010; PIMENTEL et al., 2018).
Zhan et al. (2017) recently developed the MEGASAT software for microsatellite genotyping using NGS. According to the authors, the genotyping of appropriate sets of microsatellite loci results in high quality data generation with reduced genotyping errors and extremely low cost. Therefore, the appropriate marker choice is imperative to obtain accurate and reproducible estimates of population structure, genetic diversity, or individual markers (MILLER et al., 2019).
CONCLUSIONS
1. The 10 microsatellite tetranucleotide loci evaluated proved to be effective for tilapia genotyping, expressed by specific amplification of alleles containing a high rate of polymorphic information, as well as the ability to accurately detect genotypes;
2. The microsatellite panel proposed in this study can be used to obtain kinship estimates and to monitor inbreeding. Therefore, presenting a useful tool in guiding mating in tilapia breeding programs.
ACKNOWLEDGEMENTS
The authors thank UFPel, CNPQ, CAPES and FINEP for their financial support, and the cooperative COPACOL and Rei da Tilápia company for the use of samples for genotyping.
REFERENCES
AMOUSSOU, T. O. et al. An insight into advances in fisheries biology, genetics and genomics of African tilapia species of interest in aquaculture. Aquaculture Reports, v.14, 2019. BAGSHAW, A. T. M. Functional mechanisms of microsatellite DNA in eukaryotic genomes. Genome Biology and Evolution, v. 9, n. 9, p. 2428-2443, 2017.
BOTSTEIN, D. et al. Construction of a genetic linkage map in man using restriction fragment length polymorphisms.
American Journal of Human Genetics, v. 32, n. 3, p. 314,
1980.
DIAS, M. A. D. et al. Evaluation of the genetic diversity of microsatellite markers among four strains of Oreochromis
niloticus. Animal Genetics, v. 47, n. 3, p. 345-353, 2016.
GUICHOUX, E. et al. Current trends in microsatellite genotyping. Molecular Ecology Resources, v. 11, n. 4, p. 591-611, 2011.
HAMOY, I. G. et al. Isolation and characterization of tri and tetranucleotide microsatellite markers for the tambaqui (Colossoma macropomum, Serrasalmidae, Characiformes).
Conservation Genetic Resources, v. 3, n. 1, p. 33-36, 2011.
HUYNH, O. A. et al. Low-cost methods for DNA extraction and quantification. In: JANKONWICZ-CIESLACK, J. et al.
Biotechnologies for Plant Mutation Breeding. Switzerland:
Springer International Publishing, 2017. cap. 14, p. 227-239. JONES, A. G. et al. A practical guide to methods of parentage analysis. Molecular Ecology Resources, v. 10, n. 1, p. 6-30, 2010.
JOSHI, D.; RAM, R. N.; LOHANI, P. Microsatellite markers and their application in fisheries. International Journal of
Advances in Agricultural Science and Technology, v. 4, n. 10,
p. 67-104, 2017.
KORESSAAR, T.; REMM, M. Enhancements and modifications of primer design program Primer3.
Bioinformatics Applications Note, v. 23, n. 10, p.
1289-1291, 2007.
LEE-MONTERO, I. et al. Development of the first
standardised panel of two new microsatellite multiplex PCRs for gilthead seabream (Sparus aurata L.). Animal Genetics, v. 44, n. 1, p. 533-546, 2013.
MILLER, W. L. et al. Identification and evaluation of a core microsatellite panel for use in white-tailed deer (Odocoileus
virginianus). BMC Genetics, v. 20, n. 49, p. 1-20, 2019.
Figure 4 - Electropherogram of the tetranucleotide OniUFPel06 marked with FAM fluorescence (blue) and OniUFPel10 marked with
OLAFSSON, K. et al. Novel set of multiplex assays (SalPrint15) for efficient analysis of 15 microsatellite loci of contemporary samples of the Atlantic salmon (Salmo
salar). Molecular Ecology Resources, v. 10, n. 1, p.
533-537, 2010.
PIMENTEL, J. S. M. et al. High-throughput sequencing strategy for microsatellite genotyping using neotropical fish as a model. Frontiers in Genetics, v. 9, n. 1, 2018.
POMPANON, F. et al. Genotyping erros: causes, consequences and solutions. Nature Reviews: Genetics, v. 6, p. 847-859, 2005.
PUCKETT, E. Variability in total project and per sample genotyping costs under varying study designs including with microsatellites or SNPs to answer conservation genetic questions. Conservation Genetic Resources, v. 9, n. 2, p. 289-304, 2017.
PUTMAN, A. I.; CARBONE, I. Challenges in analysis and interpretation of microsatellite data for population genetic studies. Ecology and Evolution, v. 14, n. 4, p. 4399-4428, 2014.
PUTNAM, A. S.; IVY, J. A. Kinship-based management strategies for captive breeding programs when pedigrees are unknown or uncertain. Journal of Heredity, v. 105, n. 3, p. 303-311, 2014.
RUTTEN, M. J. M. et al. Genetic characterization of four strains of Nile tilápia (Oreochromis niloticus L.) using microsatellite markers. Animal Genetics, v. 35, p. 93-97, 2004.
SULLIVAN, K. M. et al. Automated DNA profiling by fluorescent labeling of PCR products. Genome Research, v. 2, p. 34-40, 1992.
TIBIHIKA, P. D. et al. Application of microsatellite genotyping by sequencing (SSR-GBS) to measure genetic diversity of the East African Oreochromis niloticus. Conservation Genetics, v. 20, n. 1, p. 57-372, 2019.
TURCHETTO-ZOLAT, A. C. et al. Marcadores moleculares
na era genômica: metodologias e aplicações. Ribeirão Preto:
Sociedade Brasileira de Genética, 2017. 181 p.
UNTERGASSER, A. et al. Primer3: new capabilities and interfaces. Nucleic Acids Research, v. 40, n. 15, p. e115, 2012.
YANG, M. et al. Parentage determination in golden mandarin fish (Siniperca scherzeri) based on microsatellite DNA markers. Aquaculture International, v. 23, n. 2, p. 499-507, 2014.
ZHAN, L. et al. MEGASAT: automated inference of microsatellite genotypes from sequence data. Molecular
Ecology Resources, v. 17, p. 247-256, 2017.