Elias Pereira Lopes Júnior1 Samuel Façanha Câmara2 Leonino Gomes Rocha3 Alexander Brasil4
1 Universidade Federal do Cariri / Centro de Ciências Sociais Aplicadas (CCSA), Juazeiro do Norte / CE — Brazil 2 Universidade Estadual do Ceará / Programa de Pós-Graduação em Administração, Fortaleza / CE — Brazil 3 Controladoria Geral da União, Fortaleza / CE — Brazil
4 Centro Universitário Christus (Unichristus) / Departamento de Administração, Fortaleza / CE — Brazil
This study aims to analyze the effect of corruption on state-owned enterprises (SOEs) and how this practice could be harmful to the economy, despite what the grease on the wheels hypothesis suggests. A database built from three other databases was used. It contained only stock market listed enterprises. After the data treatment process, only 96,379 observations remained, from companies from 41 countries between 2002 and 2011. To achieve the expected results this study used the Difference-in-Differences technique in order to measure the effect of political influence on SOEs spending after the 2008 financial crisis. The results confirmed the hypothesis of the study, demonstrating that within environments with high levels of corruption, politicians use their influence for political/private gain purposes.
Keywords: political environment; corruption; state enterprises; public spending.
Influência da corrupção nos gastos das empresas estatais
O presente estudo procura analisar o efeito da corrupção sobre o nível de gastos das empresas estatais (State-Owned Enterprises — SOEs) e como essas práticas podem ser prejudiciais para economia, a despeito do que propõe a hipótese grease on the wheels. Para atender a proposta do estudo foi utilizada uma base de dados construída a partir de outras três bases que continham apenas empresas listadas no mercado de ações. Após o tratamento dos dados restaram 96.379 observações de empresas de 41 países entre 2002 e 2011. Para a consecução dos resultados a pesquisa fez uso da técnica Difference-in-Differences para mensurar o efeito da influência política sobre os gastos das SOEs após a crise financeira de 2008. Os resultados confirmaram a hipótese do estudo, demonstrando que em ambientes com elevada corrupção, os políticos usam a sua influência com o objetivo de obter ganhos políticos/ privados.
Palavras-chave:ambiente político; corrupção; empresas estatais; gastos públicos.
Influencia de la corrupción en los gastos de las empresas estatales
Este trabajo busca analizar el efecto de la corrupción sobre el nivel de gasto de las empresas estatales (State-Owned Enterprises — SOEs) y como estas prácticas pueden ser perjudiciales para la economía, a pesar de lo que propone la hipótesis grease on the wheels. Para este propósito el estudio utiliza una base de datos construida a partir de otras tres bases conteniendo informaciones solo de empresas listadas em el mercado de acciones. Después del tratamiento de los datos, quedaron 96.379 observaciones de empresas de 41 países entre 2002 y 2011. Mediante el uso de la técnica Difference-in-Differences, se midió el efecto de la influencia política sobre los gasto de las SOEs, después de la crisis financiera de 2008. Los resultados confirmaron la hipótesis del estudio, demostrando que en ambientes con elevada corrupción, los políticos usan su influencia con el objetivo de obtener ganancias políticas/privadas. Palabras clave: ambiente político; corrupción; empresas estatales; gastos públicos.
DOI: http://dx.doi.org/10.1590/0034-7612173631
Article received on December 17, 2016 and accepted on January 9, 2018.
1. INTRODUCTION
Corruption is neither a recent nor an exclusive problem of developing countries, but its characteristics and effects become more present in these nations, perhaps because of the systemic character and the social disfigurement of the problem (e.g.: Persson, Rothstein and Teorell, 2013). Indeed, Graeff and Mehlkop (2003) demonstrate empirically that there are stable patterns of corruption in free-market systems that only differ when one looks at the wealth factor, finding that poorer countries are more likely to be more corrupt. Ambraseys and Bilham (2011) also found similar results in the strong correlation between national per capita income and corruption (i.e., the poorer a country is, the more likely it is to be corrupt). This practice has serious impacts on the wellbeing of families, especially poorer families, who more actively need essential public services, as demonstrated by Justesen and Bjørnskov (2014), an implication on people’s livelihood was likewise verified, by Ambraseys and Bilham (2011).
However, despite the belief that corruption may be desirable when facing aspects related to the efficiency of the systems where bureaucracy and poor governance of public institutions prevail, in
order to make institutions work (the concept is known as grease on the wheels — e.g., Dreher and
Grassebner, 2013; Kato and Sato, 2015; Melo, Sampaio and Oliveira, 2015; Goedhuys, Mohnen and Taha, 2016), the concept has not yet been consistently verified in the literature. In fact, even countries like Iceland, considered in 2005 and 2006 the least corrupt country in the world, is known to have used corruption practices that were helpful in the economic development of the country, which later showed a backlash in the financial crisis of 2008 when approximately 85% of the country’s financial system collapsed (Erlingsson, Linde and Öhrvall, 2016).
Several studies reinforce the problem, such as Dutta and Sobel (2016), who verified that corruption never favors entrepreneurship, even in crisis situations (e.g.: 2008 financial crisis). According to these authors, corruption would be always an evil, just reducing its negative effect when the business climate is bad. In turn, Méon and Sekkat (2005) observed that corruption would be detrimental to growth and investment, especially in countries with weak institutional systems. This result corroborates with Mauro’s (1995) findings. Mauro analyzed 58 countries and found evidence that corruption has a negative effect on the relationship between GDP and private investment. Mo (2001), studying 46 countries, has shown that the increase in corruption practices reduces economic growth, indicating political instability as the main mechanism for explaining this result.
In order to meet those purposes, the present study is divided into six sections, including this introduction, which sought to demonstrate the apparent divergence in the literature about the benefits and problems of corruption for the economy. Section two addresses the main issues of corruption and the efforts of nations to combat it. Section three instrumentalizes the hypotheses that will guide the research. Section four presents the methodology and lays out the design of the study and the technique used. In section five, the outputs of the proposed model are analyzed and, finally, section six presents the conclusions and limitations of the proposed study and gives suggestions for future research.
2. CORRUPTION
Corruption is a global problem that affects all of society, including governments and businesses. Public officials and entrepreneurs make the rational decision to incur in corruption when there is an incentive to practice illegal acts, namely, when the sum of the probabilities of being discovered and punished, plus the extent of the punishment, are smaller than the benefits (Rose-Ackerman, 2002:63-64; Ferreira, 2015).
Before 1990, public corruption was treated in the academic literature only by modeling-oriented economists, dedicated to studying the effect of informational imbalance in auctions, brought on by informational asymmetry. Studies of the impact of corruption on the economy were rare, and the phenomenon was considered by many researchers as a “grease” on the wheels of the bureaucracy — at first glance an unintentional and unimportant consequence, that could in fact be beneficial to the economy (Abramo, 2006; Grassebner, 2013; Melo, Sampaio and Oliveira, 2015; Kato and Sato, 2015; Goedhuys, Mohnen and Taha, 2016).
Considering the benefits from corrupt acts, corruption was deemed necessary for dealing with the public administration, considered essential to speed up certain processes. Corruption (from small bribes to major corrupt practices) in less developed countries was accepted and even encouraged by several developed countries, which made corruption in foreign countries by companies tax-deductible (Pietro, 2002; Furtado, 2006). In this regard, researchers believed that corruption could minimize uncertainties and barriers in, for example, an investment project, without seriously affecting the rate of return, and could also be a strong instrument against excessive and inappropriate regulation (Campos, 2002).
However, since the 1990s, the debate about the phenomenon has increased and grown in density, with initiatives aimed at identifying the institutional causes of corruption, alerting society to its social, economic and political costs and suggesting reforms to reduce the incidence of this complex phenomenon (Speck, 2000). That movement led to the decline of the interpretation of corruption as a beneficial “lubricant” for the economy and brought about analyses focusing on the losses that corruption brings to society (Abramo, 2006; Erlingsson, Linde and Öhrvall, 2016; Dutta and Sobel, 2016).
flow of investments, enables organized crime activities, and undermines political legitimacy. It might also impede the consolidation of pro-democracy reforms (Elliott, 2002; Rose-Ackerman 2002:74).
Corruption also represents an unaffordable burden on economies seeking for a competitive edge because it greatly increases the operational costs of several countries. It translates as one of the most detrimental criminal typologies, preventing the termination of poverty cycles, undermining the efforts of national states to produce economic and social development, and condemning large population groups to misery (Ribeiro, 2001). Tanzi and Davoodi (1998) support Ribeiro’s (2001) arguments, having obtained empirical evidence of the negative effects of corruption on economic growth, showing that a high incidence of corruption is associated with high public spending and poor quality of public infrastructure.
Furthermore, with the globalization of the economy, there has been an increase in the circulation of illicit capital and assets, which affects not only the country of origin of the corruption but also the receiving countries, in a process named “globalized corruption” (e.g.: Ambraseys and Bilham, 2011). This process emphasizes the need for international cooperation in order to combat corruption and promote asset recovery (Olmos, 2013). When it comes to tackling globalized corruption, the American government pioneered such efforts with the Foreign Corrupt Practices Act (FCPA), adopted in 1977 and amended in 1988 and 1998 by the United States Congress (Ferreira, 2015).
The FCPA served as a model for other norms that attempt to fight corruption in several countries, as well as for the creation of international conventions. Thereby, came the International Conventions to Fight Corruption, which have the Federative Republic of Brazil as a signatory country. The main conventions are listed in box 1.
BOX 1 MAJOR INTERNATIONAL ANTI-CORRUPTION CONVENTIONS
Convention Organization Date of
approval Promulgation in Brazil
The Combat of Corruption by Foreign Public Officials in International Business Transactions
Organization for Economic Cooperation and Development (OECD)
December 17, 1997
Presidential Decree n. 3.678 of November 30, 2000
Inter-American Convention against Corruption
Organization of American States (OAS)
March 29, 1996
Presidential Decree n. 4.410 of October 7, 2002
UN Convention against Corruption (Merida Convention)
United Nations (UN) December 9, 2003
Presidential Decree n. 5.687 of October January 31, 2006
These Conventions are the basis for the implementation of anti-corruption measures around the world. They address issues such as national and transnational bribery, illicit enrichment, asset recovery, international legal cooperation, company accountability for acts of corruption, among others. Furthermore, according to Jones (1991), public companies should also be evaluated in order to reinforce the following of goals and objectives necessary to improve efficiency and avoid illegitimate actions.
In Brazil, in order to comply with article 173, paragraph 1 of the Federal Constitution, which stated that legislation should be drafted to institute the statute of public and mixed-capital companies, Law 13303/2016 was enacted, receiving the name of “Law of the State-Owned Companies”. This enactment brought a series of innovations seeking to modernize and adapt to present times the management of public and mixed-economy companies. These changes also attempt to change the culture in which state-owned enterprises are immersed. In Brazil, they are frequently treated as mechanisms for exchanging political favors, where ethical concepts are often ignored, and corruption is seen as normal (Gomes, 2017).
In this context of globally organized efforts against corruption, since the 1990s, concerns are strongly focused on developing countries, which deal with corruption as a persistent problem that pervades state-market relations and impacts several productive sectors, through several mechanisms, such as the deviation in behavior and administrative trajectory of the so called State-owned companies — and that is the central object of the present article.
3. FORMULATION OF THE HYPOTHESIS
Corruption can be seen as a practice that hinders the development of commerce, since it wastes resources that could be invested in a more profitable way and, moreover, as argued by Dutta and Sobel (2016), always causes damages, regardless of whether the market is up or down, only reducing its negative effects in times of crisis. Gray and Kaufmann (1998) had already highlighted this problem, arguing that corruption constitutes the greatest obstacle to the economic development and the growth of nations. Ancillary, Bai and colleagues (2013) carried out a study that verified the hypothesis that economic growth could reduce state corruption (especially bribery); resulting in the conclusion that economic growth, in fact, reduces bribery. However, this type of corruption analyzed by Bai and
colleagues (2013), could be considered what the literature calls petty bribe, something quite different
from what happens when political agents participate in the process, where values and the complexity
of the relations tends to develop grand corruption.
society, since this act shows the need to make additional and irregular payments in order to receive a public service (Kaufmann, Kraay and Mastruzzi, 2004).
Since politicians are more likely to make private gains in more corrupt environments, the government can use SOEs to gain political support. This demonstrates that corruption enables the exchange of benefits, something that would not take place in other settings (Aidt, 2009). For that matter, politicians can direct spending by state-owned companies not only to further their chances of reelection, but also to get the support they need to pass bills to promote political changes that benefit dubious motives. This type of influence is possible because, according to Shleifer and Vishny (1994), SOEs are inefficient companies because of the pressures that the politicians exert on them. These pressures may take place to reach political goals, such as the allocation of production in politically desirable regions to the detriment of economically attractive regions, which tends not to happen when the government holds a minority stake in SOEs (Inoue, Musacchio and Lazzarini, 2013)
However, it is not uncommon to see the problematic use of SOEs by politicians as means of rent seeking, especially in countries in which inequality is high (Avsar, Karayalcin and Ulubasoglu, 2013). Additionally, there also is the inefficiency of the short-term expenditures of SOEs, which are often used by politicians for personal gain (Campos and Pereira, 2016), given the state’s majority control over SOEs (Musacchio and Lazzarini, 2012). It adds up to pathological corruption. The problem worsens when these SOEs deal with investors in the capital market, as chronic interferences hinder the capitalization process of these companies, especially because of the difficulty of protecting the minority shareholders.
According to La Porta and collaborators (2000), the protection rights of minority shareholders are not considered when there is little or no transparency and this becomes an “agency problem” between managers and external shareholders. Thus, in an environment with weak corporate governance, SOEs are not transparent about their actions, allowing government influences to affect the decisions about how money will be spent. Therefore, in a more corrupt environment, there is greater ease of ownership from the government, which can influence the decisions regarding the investments of the SOEs, granting the necessary support for the approval of their bills. With this in mind, we present four hypotheses:
H1: In more corrupt environments, SOEs spend more than private companies
Four sub-hypotheses derive from this main hypothesis, associated with the types of expenses involved. They are:
H1.1: In more corrupt environments, SOEs spend more on total investments than private companies; H1.2: In more corrupt environments, SOEs spend more on employee wages than private companies; H1.3: In more corrupt environments, SOEs spend more on short-term investments than private companies;
H1.4: In more corrupt environments, SOEs have less efficient asset management than private companies.
For the present study, the definition of “more corrupt environments” was made based on the
rating of two indicators related to corruption (Corruption and Control of Corruption), which will be
4. METHODOLOGY
This is an exploratory-descriptive research, with a quantitative approach. It is exploratory in that it seeks a better understanding of the relationship between corruption and spending by state-owned enterprises. According to Gil (2006), exploratory research has the improvement of ideas or the discovery of intuitions as its main goals. The descriptive phase occurred with the attainment of databases and statistical analysis. The quantitative nature is justified by the methods used to achieve the results obtained.
Secondary data available from a recognized and reliable database were used for this study (box 2).
106,765 observations from companies from 41 countries were initially obtained from the Compustat
Global database between 2002 and 2011. Secondary data from four databases were used: Compustat Global, Mergers & Acquisitions (M & A), Worldwide Governance Indicators and International Country Risk Guide.
Compustat Global offers financial and market data from more than 13,000 companies in more than 80 countries. The data are collected by Standard & Poor’s based on the companies’ financial statements. Data are standardized according to local accounting principles, methods of disclosure and definitions of data items (Brito and Vasconcelos, 2005). As a measure of investments, the
variables Increase in Investments, Short-Term Investments, Employees and Return of Investments
were used.
For the identification of SOEs, the M & A database, developed by Thomson Reuters. M & A presents
data about the activity of public and private companies, since the late 1970s, in all major types of businesses. The database tracks changes in economic ownership to the level of the parent company. All bids involving the purchase of at least a 5% stake (or a 3% stake for publicized promotions of at least $ 1 million) are tracked, including transactions that started as rumors. Thus, the information covers rumor operations or official announcement until completion or cancellation. Furthermore, in order to identify state-owned enterprises, the company’s official websites and their activity reports were also consulted.
The first indicator on corruption was collected from the World Bank database: Worldwide
Governance Indicators (WGI). WGI is composed of six large composite indicators, covering more
than 200 countries since 1996: Voice and Accountability, Political Stability and Absence of Violence,
Government Effectiveness, Regulatory Quality, Rule of Law and Control of Corruption. This database has aggregate and individual information on governance indicators from 213 countries from 1966 to 2012 (World Bank, 2017).
These indicators are based on hundreds of variables obtained from 31 different data sources, capturing perceptions of governance as reported by individual interviewees, nongovernmental organizations, business information providers, corporations, and public-sector organizations around
the world. The values of these indicators range from -2.5 to 2.5. In the case of the Control of Corruption
measure, for instance, a lower the value means greater the use of public power for private gain. Higher values, on the other hand, mean less corruption.
The other indicator related to corruption was obtained in the Country Risk Guide database, which
presents twelve indicators. For this research, only the indicator Corruption was used. The variable
economic and financial circumstances and reduces government efficiency by allowing people to take positions of power through patronage rather than meritocracy. The indicator ranges from zero (most corrupt environments) to six (less corrupt environments).
The present study can be considered a non-experimental research, since there was no possibility of
manipulation of the data. We used a quasi-experiment using the Difference-in-Differences technique.
The quasi-experiment occurs when an exogenous event affects the explanatory variable.
The technique was used to analyze the relationship between corruption and expenses incurred by companies after the 2008 crisis. This crisis was chosen as a cut-off point because it was an exogenous event outside of the companies’ control. For this study, control companies (private companies) and treatment companies (state-owned companies) were used.
BOX 2 VARIABLES OF THE STUDY
Dependent Variables
Variable Formula/Description
Increase in Investments Represents the funds used to increase a company’s long-term investments.
Short-Term Investments – Total
Represents the investments currently tradable, as presented in the Current Assets section of the Balance Sheet. Such assets are supposed to be converted into cash within a relatively short period of time.
Employees Represents the actual number of people employed by the company and its subsidiaries.
Sale of Investments This item represents the receiving of long-term investments.
Independent Variables
Variable Formula/Description
Corruption
This is an assessment of corruption within the political system. Corruption is a threat to foreign investment for several reasons: it distorts the economic and financial environment; reduces government and business efficiency by allowing people to take positions of power through other means than their capacity; and introduces an inherent instability into the political process.
Control of Corruption Perceptions about the extent to which public power is exercised for private gain, including forms of corruption, as well as “capture” of the state by elites and private interests.
Control Variables
Variable Formula/Description
Country Series of dummy variables, each one related to a country, in which 1 indicates that the company operates in the country and zero if not.
Year Series of dummy variables, each related to one year.
Company Series of dummy variables, each related to a company
Type Dummy variable related to a type of company, in which 1 indicates that the company is a
state company and zero in case it is a private company.
Crisis Dummy variable related to the 2008 international crisis, in which it was assigned the value 1 for the years 2008 onwards and zero for the years prior to 2008.
Type x Crisis
Dummy variable in which the interaction between the two previous dummies captures the companies (i) in the year (t) that are SOEs and go through the crisis receiving the value 1 and the other companies are assigned the value 0
Crisis (2006) Dummy variable related to the placebo effect for the crisis, in which the value 1 was assigned for the years 2006 onwards and zero for the years prior to that.
Type x Crisis (2006)
Dummy variable in which the interaction between the dummies Type and Crisis (2006 will capture the companies (i) in year (t) that are SOEs that from the period of 2006 onwards receiving the value 1 and other companies receive 0
Source: Research data.
Meyer (1995), in his seminal work, describes the Diff-in-Diff method as suitable to conduct
experiments, in which it is possible to identify the influence of an exogenous source on the explanatory
variables, induced by a change in the policy or similar event. In order to implement the Diff-in-Diff
model, a double-effect double-regression panel regression was used, since it is the one that best adapts to longitudinal studies with multiple variables whose units repeat across the various cross-sections.
The model for hypothesis 1 can be written as follows:
Yit=αi+Ψt+β1Tipo+β2Crise+β3TipoxCrise+β4Ano+β5País+εit (Equation 1)
In which:
Yit = dependent variables: Increase in Investments, Short-Term Investments, Employees and Sale of Investments.
αi = Fixed effect of firms. Ψt = Fixed effect of time.
Type = dummy variable which receives the value 1 if the company is an SOE and 0 if it is a private
company.
Crisis = dummy variable which receives the value 1 if the company (i) in the quarter (t) is present
Type X Crisis = dummy variable that captures the effect of Diff-in-Diff, that is, the difference of the groups in periods of crisis. It is represented by the interaction between the two previous dummies.
Year = dummy variable for year.
Country = dummy variable for country.
εit = stochastic error term of the regression.
For the technical application of Diff-in-Diff, the general sample was subdivided. The median was
used to characterize the environment with high corruption. For the Control of Corruption variable,
for example, the first database contained all companies that were in countries where the corruption indicator was greater than or equal to 0.58.
The second database was composed of all companies that were in countries where the indicator
was below 0.58. The same procedure was done for the variable Corruption. Therefore, two databases
were generated: one with companies in environments with low corruption (less corrupt environments) and another with companies in environments with high corruption (more corrupt environments).
For data treatment and adequacy of the sample verification, regarding the normality of the data, the sample was winsorized, as prescribed by Kállas (2014). Tests of multivariate normality, with the parameters of asymmetry and kurtosis, as well as the tests of normality Doornik-Hansen and Henze-Zikler, as proposed by Xavier (2011), were carried out.
5. RESULTS
The original database came from Compustat Global and contained 106,765 observations between 2002
and 2011. Corporate governance-related issues, gathered at the national level, also come from 2002 to 2011. Following the treatment of the duplicate observations, the final sample resulted in 96,379 company
observations from 41 countries. In addition, the variable Increase in Investments was treated in relation
to the missing values, since it was greater than 10%, filling the values with the average of that variable.
Next, we analyzed the occurrence of atypical observations (outliers), which are observations that
present different characteristics from the others. Traditionally, observations are considered to have very high or very low values. Atypical observations deviate so much from the others to the point of generating suspicions that they were generated by different mechanisms. Because of this, they can influence the results of statistical analyzes and eventually lead researchers to wrong conclusions (Kallás, 2014).
For this study, the model followed by Kallás (2014) was adopted, using the Winsorization technique. This is a technique developed by Charles P. Winsor in 1941 which suggests that when encountering an atypical observation, one should not simply reject it. Instead, you must replace its value by the nearest value of an unsuspected observation. For normal distributions, the means of the winsorized samples are more stable than the means of the samples where the atypical observations are eliminated. The winsorized samples are, therefore, inevitably the same size as the original samples collected (Kallás, 2014:93). Through the analysis and judgment of the researcher, we chose to use the winsorized variables at 1%.
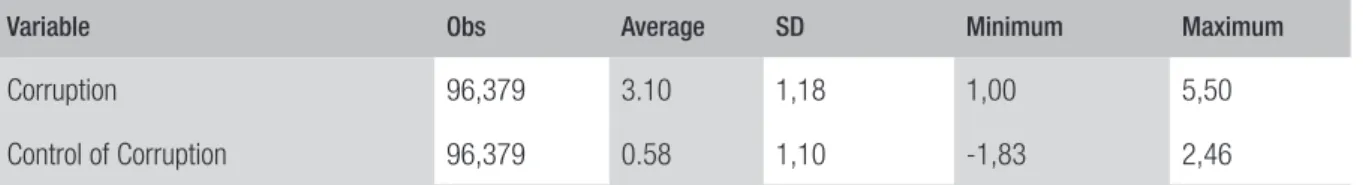
Table 1 shows the descriptive statistics of the independent variables. The possible values for the
sample the average was 3.10. The values for the Control of Corruption variable, captured from the Worldwide Governance Indicators database, could range from -2.5 to 2.5 and its mean for this sample was 0.58.
TABLE 1 DESCRIPTIVE STATISTICS OF INDEPENDENT VARIABLES
Variable Obs Average SD Minimum Maximum
Corruption 96,379 3.10 1,18 1,00 5,50
Control of Corruption 96,379 0.58 1,10 -1,83 2,46
Source: Research data.
Table 2 presents the results of the tests referring to multivariate normality. According to Xavier (2011), these tests are crucial to verify if the assumptions of statistical tests are partially met. All four tests performed refuted the null hypothesis of multivariate normality. The univariate normality test also refuted the assumptions of lack of asymmetry, kurtosis, and normal distribution. The tests were
done from the command mvtest normality of the Stata program, with the option all.
TABLE 2 MULTIVARIATE TESTS OF NORMALITY
Asymmetry = 9.303.455 chi2(816) = 1.45e+08 Prob>chi2 = 0.0000
Curtose = 11692.07 chi2(1) = 5.26e+09 Prob>chi2 = 0.0000
Henze-Zirkler = 1.325.681 chi2(1) = 9.15e+08 Prob>chi2 = 0.0000
Doornik-Hansen chi2(32) = 3.84e+08 Prob>chi2 = 0.0000
Source: Research data.
5.1 COMPANIES IN ENVIRONMENTS WITH HIGH CORRUPTION
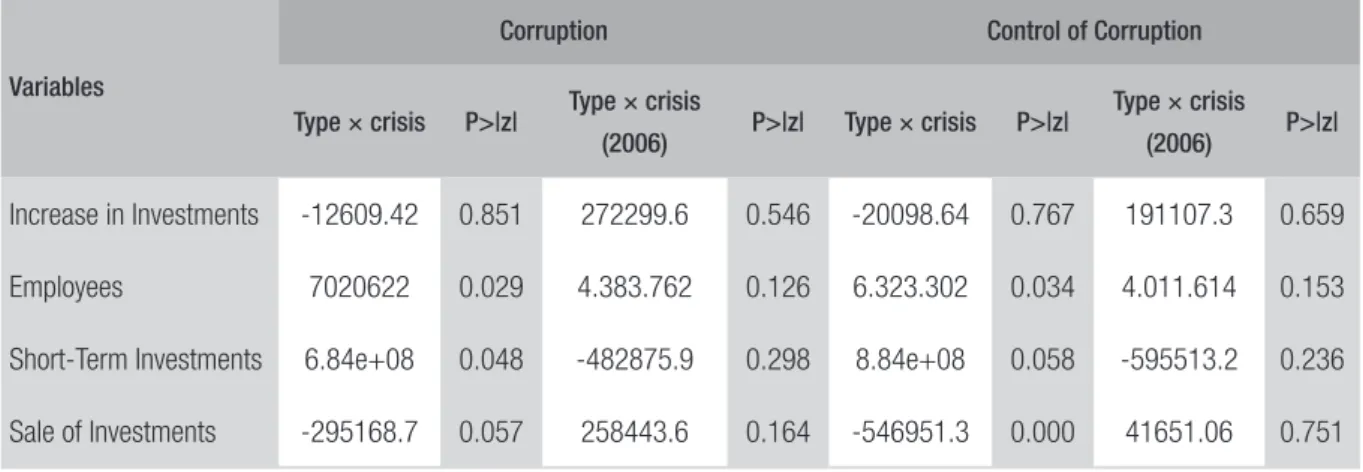
In the analysis, the Diff-in-Diff technique was applied for each dependent variable. Table 3 contains only companies that are located in environments (countries) with high corruption. With the variable “type x crisis”, it was first analyzed if there are differences regarding the behavior of the public and private companies’ expenses in the period from 2008 to 2011. As a comparison, the same procedure was performed using the 2006 to 2011 (variable “type × crisis (2006)”). This measure was taken to
verify if the Diff-in-Diff results are specific to the 2008 crisis period, so the period from 2006 to 2011
TABLE 3 DIFF-IN-DIFF RESULTS FOR HIGH CORRUPTION
Variables
Corruption Control of Corruption
Type × crisis P>|z| Type × crisis
(2006) P>|z| Type × crisis P>|z|
Type × crisis
(2006) P>|z|
Increase in Investments -12609.42 0.851 272299.6 0.546 -20098.64 0.767 191107.3 0.659
Employees 7020622 0.029 4.383.762 0.126 6.323.302 0.034 4.011.614 0.153
Short-Term Investments 6.84e+08 0.048 -482875.9 0.298 8.84e+08 0.058 -595513.2 0.236
Sale of Investments -295168.7 0.057 258443.6 0.164 -546951.3 0.000 41651.06 0.751
Source: Research data.
With the exception of the Increase in Investments variable (P value above 10%), hypothesis
H1.1, for all other variables, state-owned companies invested more than private companies in
highly corrupt environments after the 2008 crisis (the value of the variable “type x crisis” was positive). As the significance of the variables in the placebo period was above 10%, that is, there were no differences, then it can be stated that there was an increase in the expenses of state-owned companies after the 2008 crisis. Additionally, according to table 3, SOEs invested more
in employees after the 2008 crisis (H1.2). This result may be an indication that politicians, in fact,
use their influence over state-owned companies to signal the hiring of employees in return for political favors. This idea has already been debated in other studies, such as Gomes (2017), who verified that state-owned companies can be recognized as excellent mechanisms for bargaining and exchange of favors.
It is also possible to say that, in more corrupt environments, SOEs that have the government as
majority shareholder spend more on short-term investments in relation to private companies (H1.3).
In this case, corruption can facilitate the exchange of political favors, and short-term investment can be helpful by having a faster return. According to Campos and Pereira (2016), the short-term investments of state-owned companies are generally higher than necessary due to inefficiencies. Therefore, politicians take advantage of this inefficiency to steal and obtain personal gains.
Another important result is that in more corrupt environments, SOEs that have the government
as a majority shareholder invest less than private firms (H1.4). Therefore, the lower revenue obtained
by state-owned enterprises may be due to their own inefficiency. For Shleifer and Vishny (1994), the inefficiencies of state-owned enterprises can be very damaging to the company and to society.
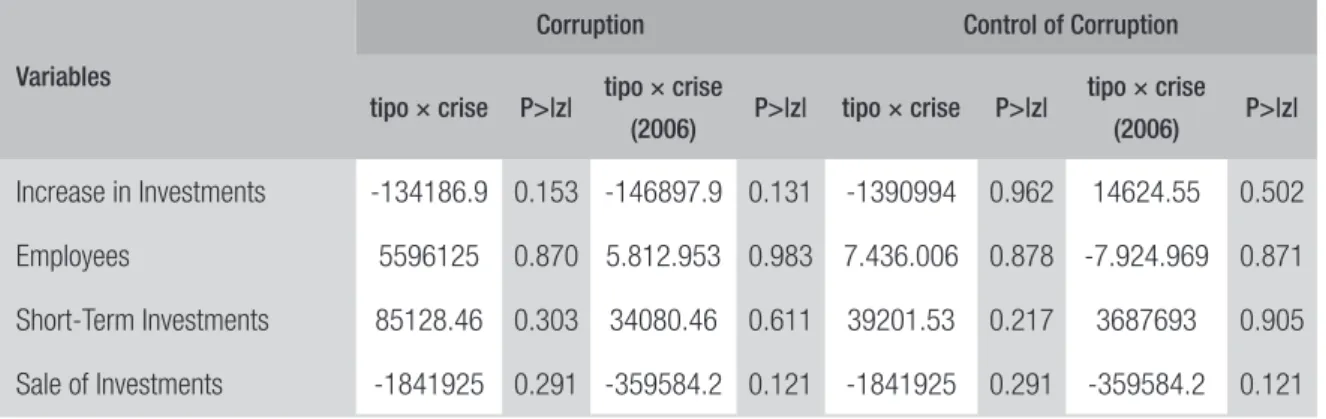
5.2 COMPANIES IN ENVIRONMENTS WITH LOW CORRUPTION
The results for the database for companies that were in low corruption environments, shown in table 4, showed no differences either before or after the placebo (2006) and neither before nor after the crisis (2008). The analysis was based on the P value (all above 10%). Thus, it becomes clear that the influence of politics on SOEs is most evident in more corrupt environments.
TABLE 4 DIFF-IN-DIFF RESULTS FOR LOW CORRUPTION
Variables
Corruption Control of Corruption
tipo × crise P>|z| tipo × crise
(2006) P>|z| tipo × crise P>|z|
tipo × crise
(2006) P>|z|
Increase in Investments -134186.9 0.153 -146897.9 0.131 -1390994 0.962 14624.55 0.502
Employees 5596125 0.870 5.812.953 0.983 7.436.006 0.878 -7.924.969 0.871
Short-Term Investments 85128.46 0.303 34080.46 0.611 39201.53 0.217 3687693 0.905
Sale of Investments -1841925 0.291 -359584.2 0.121 -1841925 0.291 -359584.2 0.121
Source: Research data.
6. CONCLUSIONS
Overall, corruption indicators may be related to the expenditures made by state-owned enterprises.
With regard to corruption (Corruption), governments use SOEs to try to reduce inequality in their
country by paying higher wages or hiring more employees than necessary (Avsar, Karayalcin and Ulubasoglu, 2013). Therefore, in more corrupt environments, politicians use their influence on SOEs to increase spending and raise private gains, since corruption is one of the ways to circumvent institutions and engage in opportunistic acts. Once there is the feeling that it is controlled, opportunism falls.
Regarding the Control of Corruption variable, in environments with greater use of public power for private gain, SOEs that have the government as a majority shareholder can invest more than private companies. Following Svensson’s (2005) argument, which states that political corruption can be considered an abuse of power, position or resources by politicians, for personal gain, this fact is justified by the use of the influence of politicians on state-owned enterprises to achieve political and private advantages.
also explain SOEs’ decision to spend. Another important contribution is the attempt to elucidate the efficiency of investments made by state-owned companies.
The study has some limitations. The indicators of corporate governance used are measures of perception and, although widely used in academic research, are subject to distortions. As a suggestion for future research, there is a classification proposed by Musacchio and Lazzarini (2012) for minority SOEs, in which the authors proposed the following possibilities: partially privatized companies, participation in state holdings, loans by state-owned companies and or development banks, pension funds controlled by the government etc. In this case, it would be necessary to search for other databases, since we have attempted to develop a ranking, but only two types of state-owned enterprises were present, both having the government as the minority shareholder: partially privatized companies and state holdings. Another suggestion would be to use other investment measures, as well as other measures of corruption. Regarding corruption, in particular, an alternative indicator would
be the Corruption Perception Index, developed by the nongovernmental organization Transparency
REFERENCES
ABRAMO, Cláudio W. Percepções pantanosas.
Revista da Controladoria-Geral da União, Brasília,
v. 1, n. 1, p. 117-121, Dec. 2006.
AIDT, Toke S. Corruption, institutions, and economic development. Oxford Review of Economic
Policy, v. 25, n. 2, p. 271-291, 2009.
AVS A R , Ve y s e l ; K A R AYA L C I N , C e m ; ULUBASOGLU, Mehmet Ali. State‐owned enterprises, inequality, and political ideology.
Economics & Politics, v. 25, n. 3, p. 387-410, 2013.
AMBRASEYS, Nicholas; BILHAM, Roger. Corruption kills. Nature, v. 469, n. 7329, p. 153-155, 2011.
BAI, Jie et al. Does economic growth reduce corruption? Theory and evidence from Vietnam.
National Bureau of Economic Research Working Paper
Series, Working Paper n. 19483, p. 1-56, 2013.
BRITO, Luiz A. L.; VASCONCELOS, Flávio C. de. A influência do país de origem no desempenho das empresas. Revista de Administração Contemporânea, v. 9, n. 4, p. 97-118, 2005.
CAMPOS, Francisco. Corrupção: aspectos econômicos e institucionais. Revista de Economia
Aplicada, v. 6, n. 4, p. 767-791, 2002.
CAMPOS, Francisco A. O.; PEREIRA, Ricardo A. Corrupção e ineficiência no Brasil: uma análise de equilíbrio geral. Estudos Econômicos, São Paulo, v. 46, n. 2, p. 373-408, 2016.
CGU. Controladoria-Geral da União. Convenções internacionais. 2014. Available at: <www.cgu.gov. br/assuntos/articulacao-internacional/convencoes-internacionais>. Accessed on: 10 Dec. 2016.
DEL MONTE, Alfredo; PAPAGNI, Erasmo. Public expenditure, corruption, and economic growth: the case of Italy. European Journal of Political Economy, v. 17, n. 1, p. 1-16, 2001.
DREHER, Axel; GASSEBNER, Martin. Greasing the wheels? The impact of regulations and corruption on firm entry. Public Choice, v. 155, n. 3-4, p. 1-20, 2013.
DUTTA, Nabamita; SOBEL, Russell. Does corruption ever help entrepreneurship?. Small
Business Economics, v. 47, n. 1, p. 179-199, 2016.
EIGEN, Peter. A ascensão do tema corrupção. In: SPECK, Bruno Wilhelm (Org.). Caminhos
da transparência. Campinas: Unicamp, 2002.
p. 335-354.
ELLIOTT, Kimberly A. A corrupção e a economia
global. Brasília: Editora UnB, 2002.
ERLINGSSON, Gissur Ó.; LINDE, Jonas; ÖHRVALL, Richard. Distrust in utopia? Public perceptions of corruption and political support in Iceland before and after the financial crisis of 2008. Government
and Opposition, v. 51, n. 4, p. 553-579, 2016.
FCPA. A resource guide to the U.S. Foreign Corrupt
Practices Act. Criminal Division of the U.S.
Department of Justice and Enforcement Division of the U.S. Securities and Exchange Commission. Washington, 2012. Available at: <www.sec.gov/ spotlight/fcpa/fcpa-resource-guide.pdf>. Accessed on: 5 Jan. 2016.
FERREIRA, Luciano V. A construção do regime jurídico internacional antissuborno e seus impactos
no Brasil: como o Brasil pode controlar o suborno
praticado por empresas transnacionais.2015. Thesis (doctor degree) — Universidade Federal do Rio Grande do Sul, Porto Alegre, 2015.
FURTADO, Lucas R. A comunidade internacional e a corrupção transnacional: raízes para combater a corrupção. Revista da Controladoria-Geral da União, Brasília, v. 1, n. 1, p. 43-60, Dec. 2006.
GIL, Antônio. C. Como elaborar projetos de pesquisa. 4. ed. São Paulo: Atlas, 2006.
GOEDHUYS, Micheline; MOHNEN, Pierre; TAHA, Tamer. Corruption, innovation and firm growth: firm-level evidence from Egypt and Tunisia.
Eurasian Business Review, v. 6, n. 3, p. 299-322, 2016.
GOMES, Camila P. B. A nomeação de dirigentes de estatais a partir da Lei 13.303/16. Revista Juris
UniToledo, v. 2, n. 2, p. 27-38, 2017.
GRAEFF, Peter; MEHLKOP, Guido. The impact of economic freedom on corruption: different patterns for rich and poor countries. European Journal of
Political Economy, v. 19, n. 3, p. 605-620, 2003.
GRAY, Cheryl; KAUFMANN, Daniel. Corruption and development. Finance and Development, v. 35, n. 1, p. 7-10, 1998.
purchases. Academy of Management Journal, v. 56, n. 6, p. 1775-1801, 2013.
JONES, Leroy P. Performance evaluation for state owned enterprise. In: RAMAMURTI, Ravi; VERNON, Raymond (Ed.). Privatization and control
of state owned enterprise. Washington, DC: The
World Bank, 1991. p. 179-205.
JUSTESEN, Mogens K.; BJØRNSKOV, Christian. Exploiting the poor: bureaucratic corruption and poverty in Africa. World Development, v. 58, n. 6, p. 106-115, 2014.
KALLÁS, David. A moderação da concentração setorial no efeito do ambiente institucional na
performance empresarial. 2014. Thesis (doctor
degree) — Fundação Getulio Vargas, São Paulo, 2014.
KATO, Atsushi; SATO, Takahiro. Greasing the wheels? The effect of corruption in regulated manufacturing sectors of India. Canadian Journal of Development Studies/Revue Canadienne d’Études du
Développement, v. 36, n. 4, p. 459-483, 2015.
KAUFMANN, Daniel; KRAAY, Aart; MASTRUZZI, Massimo. Governance matters III: governance indicators 1996, 1998, 2000 and 2002. The World
Bank Economic Review, v. 18, n. 2, p. 253-287, 2004.
LA PORTA, Rafael et al. Investor protection and corporate governance. Journal of Financial
Economics, v. 58, n. 1, p. 3-27, 2000.
MAURO, Paolo. Corruption and growth. The
Quarterly Journal of Economics, v. 110, n. 3, p.
681-712, 1995.
MELO, Felipe Luiz Neves Bezerra de; SAMPAIO, Luciano Menezes Bezerra; OLIVEIRA, Renato Lima de. Bureaucratic corruption and entrepreneurship: an empirical analysis of Brazilian states/Corrupcao burocratica e empreendedorismo: uma análise empírica dos estados brasileiros. RAC — Revista de
Administração Contemporânea, v. 19, n. 3, p.
374-398, 2015.
MÉON, Piérre G.; SEKKAT, Khalid. Does corruption grease or sand the wheels of growth? Public Choice, v. 122, n. 1-2, p. 69-97, 2005.
MEYER, Breed D. Natural and quasi-experiments in economics. Journal of Business & Economic Statistics, v. 13, n. 2, p. 151-161, 1995.
MO, Pak Hung. Corruption and economic growth.
Journal of Comparative Economics, v. 29, n. 1,
p. 66-79, 2001.
MUSACCHIO, Aldo; LAZZARINI, Sergio G. Leviathan in business: varieties of state capitalism and their implications for economic performance.
Har vard Business School, Working Paper,
n. 12-108, 2012.
OLMOS, Eduardo A. Recuperación de activos en
casos de corrupción: cooperación civil internacional.
2013. 193 f. Thesis (master degree) — Universidad de Salamanca, Salamanca, 2013.
OVASKA, Tomi; SOBEL, Russel S. Entrepreneurship in post-socialist economies. Journal of Private
Enterprise, v. 27, n. 1, p. 8-28, 2005.
PERSSON, Anna; ROTHSTEIN, Bo; TEORELL, Jan. Why anticorruption reforms fail—systemic corruption as a collective action problem.
Governance, v. 26, n. 3, p. 449-471, 2013.
PIETH, Mark. Cooperação internacional de combate à corrupção. In: ELLIOTT, Kimberly Ann (Org.). A Corrupção e a economia global. Brasília: Universidade de Brasília, 2002. p. 183-200.
RIBEIRO, Renato J. B. Possibilidades de combate à corrupção pelo estado burocrático/patrimonialista na América Latina em um contexto de cenário de sociedade informacional. Revista do TCU, Brasília, v. 32, n. 88, p. 75-85, Apr./June 2001.
ROSE-ACKERMAN, Susan. A economia política da corrupção. In: ELLIOTT, Kimberly Ann (Org.).
A corrupção e a economia global. Brasília:
Universidade de Brasília, 2002. p. 59-96.
SHLEIFER, Andrei; VISHNY, Robert W. Politicians and firms. The Quarterly Journal of Economics, v. 109, n. 4, p. 995-1025, 1994.
SPECK, Bruno. W. Caminhos da transparência. Campinas: Unicamp, 2002.
SPECK, Bruno W. Mensurando a corrupção: uma revisão de dados provenientes de pesquisas empíricas. Cadernos Adenauer, v. 10, p. 9-45, 2000.
TANZI, Vito; DAVOODI, Hamid. Corruption, public investment, and growth. In: SHIBATA, Hirofumi; IHORI, Toshihiro. The welfare state, public investment,
and growth. Berlin: Springer, 1998. p. 41-60.
WORLD BANK. Worldwide governance indicators. 2017. Available at: <http://info.worldbank.org/
governance/wgi/index.aspx#home>. Accessed on: 6 May 2017.
XAVIER, Wlamir G. O efeito das mudanças
institucionais em Business Groups no Brasil. Thesis
(doctor degree) — Universidade do Vale do Itajaí, Biguaçu, 2011.
Elias Pereira Lopes Júnior
PhD in Business Administration from the School of Business Administration of São Paulo (FGV EAESP). Pro-fessor of Business Administration at the Federal University of Cariri (UFCA). E-mail: elias.junior@ufca.edu.br.
Samuel Façanha Câmara
PhD in Economic Sciences from the Federal University of Pernambuco (UFPE). Post-doctorate in Innovation at FGV EBAPE. Professor of the Graduate Program in Administration of the State University of Ceará (Uece). E-mail: samuel.camara@uece.br.
Leonino Gomes Rocha
Master in Business Administration from the State University of Ceará (Uece). PhD in Law and Global Go-vernance from the University of Salamanca, Spain. Federal Auditor of Finance and Control with the Federal Comptroller General’s Office. E-mail: leoninor@hotmail.com.
Alexander Brasil