Departamento de Inform´atica
Catarina Cardoso
Learning Frequent Behaviours
Patterns in Intelligent Environments
for Attentiveness Level
Universidade do Minho Escola de Engenharia
Departamento de Inform´atica
Catarina Cardoso
Learning Frequent Behaviours
Patterns in Intelligent Environments
for Attentiveness Level
Master dissertation
Master Degree in Computer Science
Dissertation supervised by
Paulo Jorge Oliveira de Freitas Novais Dalila Alves Dur ˜aes
Firstly, I would like to thank to my supervisors, Professor Paulo Novais and Professor Dalila Dur˜aes, for the opportunity to work with them, for all the support, for all the guidance and for always been available to help me during this journey. My many thanks.
To my friends, for always being present, for the support and for the friendship. To my family, for helping me grow during my life and give me all the needed sup-port.
Finally, to my parents, for offer me the best education possible. For letting me chase my dreams and have my backs always. For all the advices. For all the support and guidance. For giving me the best role model to follow. For all the love. Thank you very much.
To all, thank you.
A B S T R A C T
Nowadays, when it comes to achieving goals in business environments or educational environments, the successful on a person performing a task has an important role.
However, this performance can be affected by several factors. One of the most com-mon is the lack of attention. The individual’s attention in performing a task can be determinant for the final quality or even at the task’s conclusion.
In this project is intended to design a solution that can help on the reduce or even eliminate the lack of attention on performing a task. The idea consists on develop a software that capture the user behaviour through the mouse and keyboard usage. Furthermore, the system will analyse how the devices are used. It will be quantified the attention level and, after several captures for each user, it will be defined for each user an user profile. Through standardization of user’s behaviour it will be possible to determine the learning style of each user.
Keywords: Ambient Intelligent System, Decision Support System, Attention, and User Be-haviour.
Atualmente quando se fala sobre atingir objetivos em ambiente de neg ´ocio ou educa-cional fala-se sobre o desempenho com sucesso, que determinado individuo teve para a realizac¸˜ao dos mesmos.
Contudo, esse desempenho pode ser afetado por diversos fatores, mas um dos mais frequentes, ´e a falta de atenc¸˜ao. A atenc¸˜ao que um individuo despende para a realizac¸˜ao de uma tarefa pode ser determinante para o n´ıvel de qualidade que a mesma vai possuir no final, ou mesmo de conseguir que esta seja finalizada.
O que se pretende neste projeto ´e a concec¸˜ao de uma soluc¸˜ao que consiga reduzir ou mesmo eliminar a falta de atenc¸˜ao existente na realizac¸˜ao de tarefas. A ideia con-siste na criac¸˜ao de um software que ir´a captar comportamentos dos utilizadores a partir da utilizac¸˜ao de um computador ou port´atil, atrav´es da utilizac¸˜ao do rato e do teclado. Para al´em disso, o sistema ir´a analisar a forma como estes perif´ericos s˜ao utilizados. Ser´a tamb´em quantificada o n´ıvel de atenc¸˜ao dos alunos e, ap ´os diversas captac¸ ˜oes dos dados dos alunos, ser´a definido um perfil para cada utilizador, atrav´es da padronizac¸˜ao dos seus comportamentos e, poder-se-´a determinar o estilo de apren-dizagem mais prop´ıcio a cada utilizador.
Palavras-chave: Sistemas de Ambientes Inteligentes, Sistema de Apoio `a Decis˜ao, Atenc¸˜ao, e Comportamento do Utilizador.
C O N T E N T S
1 i n t r o d u c t i o n 4
1.1 Motivation 4
1.2 Contributions 5
1.3 Theme and Objectives 6
1.4 Research Methodology 7 1.5 Thesis Structure 8 2 s tat e o f t h e a r t 9 2.1 Attention 9 2.2 User Behaviour 15 2.3 Learning Style 18 2.3.1 Learning 18
2.3.2 Learning Styles Theories 18
2.3.3 Learning Style Conclusion 23
3 p r o p o s e d a r c h i t e c t u r e 25 3.1 Project planning 25 3.2 System’s Architecture 26 3.3 Technologies 27 3.3.1 Java 28 3.3.2 Spring 28 3.3.3 Maven 28 3.3.4 SQL 29 3.3.5 HTTP Protocol 29 3.4 Database 30 3.4.1 MongoDB 30 3.4.2 MySQL 34 3.5 HTTP Request Specification 38 3.6 Features 41 3.6.1 Classification of Attention 42
3.6.2 Learning Style’s Identification 46
3.7 Proposed Architecture Conclusion 50 iv
4 c a s e o f s t u d y 51
4.1 Context 51
4.2 Results 52
4.3 Case of Study Conclusions 57
5 c o n c l u s i o n 58
5.1 Accomplishment of objectives and contributions 58
5.2 Dissemination of Results 59
L I S T O F F I G U R E S
Figure 1 Factors that influence attention 10
Figure 2 BroadBent’s filter theory 12
Figure 3 Saliency map example 14
Figure 4 Visibility output example 14
Figure 5 Kolb Learning Cycle 19
Figure 6 Kolb’s Learning Style 20
Figure 7 Honey and Mumford Learning Styles 21
Figure 8 Felder-Silverman Learning Styles and Teaching Style 23
Figure 9 Project Planning 26
Figure 10 System’s architecture 26
Figure 11 ”User” collection example 31
Figure 12 “TaskRecords” collection example 32
Figure 13 “MouseRecords” collection example 33
Figure 14 “KeyboardRecords” collection example 34
Figure 15 Database schema 35
Figure 16 Session Request specifications 39
Figure 17 Evaluation Request specification 40
Figure 18 Learning Request specification 40
Figure 19 Historic Global Request specification 41
Figure 20 Historic Days Request specification 41
Figure 21 Attention Classification Process Workflow. 42
Figure 22 Request Response. 43
Figure 23 Learning Style identification Process Workflow 46
Figure 24 Data set example 47
Figure 25 K-means algorithm process example 48
Figure 26 Level of attention of the Student 12P512. 54
Figure 27 Mouse behaviour evaluation from a student 55
Figure 28 Keyboard behaviour evaluation from a student 55
Figure 29 Weka Tool Configuration and Results. 56
Table 1 Honey and Mumford Learning Styles coincide with Kolb
Learn-ing Styles 20
Table 2 Relation between CRUD operations and HTTP methods 29
Table 3 User Table Details 36
Table 4 Session Table Details 36
Table 5 Measures Table Details 37
Table 6 Row Data Table Details 37
Table 7 Task Table Details 38
Table 8 Learning Style Table Details 38
Table 9 Experience Results from the attention classification process 53
Table 10 Student 12p512 results from the four lessons 56
Table 11 Learning Style Results. 57
N O TAT I O N A N D T E R M I N O L O G Y
Notation
Throughout the document acronyms related to the representation of names of models are used. In order to best understand them, this section was created in order for the reader to understand their interpretation
Acronyms A
AI Artificial Intelligence
ANSI American National Standards Institute API Application Programming Interface
C
CRUD Create, Read, Update and Delete CSV Comma-Separated Values
D
DB Database
DBMS Database Management System DDL Data Definition Language DML Data Manipulation Language DSS Decision Support Systems
E
EEG Electroencephalography
F
fMRI functional Magnetic Resonance Imaging
H
HB Human Behaviour
HTTP Hypertext Transfer Protocol
I
IBM International Business Machines ISO International Organization for Standardization
J
JSON Javascript Object Notation JVM Java Virtual Machine
M
Mac OS Macintosh Operating Systems MEG Magnetoencephalography Test
MMN Mismatch Negativity
P
PET Positron Emission Tomography POM Project Object Model
List of Tables 3
S
SQL Structure Query Language
W
1
I N T R O D U C T I O NThis thesis was carried out for the dissertation of the 2nd year of the Master Degree in Informatics Engineering of the Department of Informatics, School of Engineering from University of Minho.
The work covers areas of computer science such as Artificial Intelligence (AI), Hu-man Behaviour (HB), Attentiveness and Decision Support Systems (DSS). In this chap-ter, the motivation and background of this work will be presented, followed by a short explanation of the theme and objectives to accomplish, the research method used, and the structure of the document.
1.1 m o t i vat i o n
Attention is a very complex process through which one individual is able to continu-ously analysis a spectrum of stimuli and, in a sufficiently short amount of time, chose one to focus on [1]. In most of us, who can only focus on a very reduced group of stimuli at a time, this implies ignoring other perceivable stimuli and information.
Currently, one of the major problems related to work is the quantity of attention that people spend on performing a propose task[2]. The level of attention of each person is increasingly affected by the evolution of Internet usage and introduction of social networks. These two factors had a high impact in attention because offers many information of general interest and might cause inattention. This will provide the necessary information to the leadership, which help the user to improve his level of attention [3].
Therefore, the challenge for this project is to be able to classify the level of attention of each user. This can be achieved through the development of an architecture that will use data, which was previously captured in business and educational environments.
1.2. Contributions 5
Subsequently the data will be processed and the system will be able to classify the level of attention of each user.
The data collected come from the mouse and keyboard usage and from the informa-tion of the active applicainforma-tion. Both of mouse data and keyboard data are related to the movement duration, click duration, distance between clicks and the time and velocity that key was pressed. Concerning the active application, it will be calculated the time that each user spends on the task-related defined as task. With this data, it will be possible to classify the attention level. The time spent on task will be one of the main factors of influence.
This application will also provide the user profile relative to the level of attention and his/her learning style. This will help the leadership to change the approach for each user. In order to obtain these results, it will be necessary a constant monitoring of the data of each user.
For the development of this project, it was counted with the help of the Intelligent System Lab, ISLab, from University of Minho. This laboratory was chosen because of his research work in Ambient Intelligent and there are some work about the learning subject. Furthermore, to achieve the expected results, they give all the support with artificial intelligent system and the needed expertise.
1.2 c o n t r i b u t i o n s
We live in a global and hyper connected world where technology is present in all spheres of life and is the backbone for the transformation of our society, which is in permanent change and requires continuous adaptation of the human being to the surrounding environment [4, 5].
The development of new learning environments, supported by technology, may al-low improving the learning process but it is also necessary to mitigate problems that may occur in an environment with learning technologies [6]. Learning theories provide insights into the very complex processes and factors that influence learning and give precious information to be used in designing instruction that will produce optimum results. The learning models are designed in order to supply to the students with practice, evaluation and improvement procedures, which will adjust the model [7].
1.3 t h e m e a n d o b j e c t i v e s
The theme of this work is Frequent Behaviours Patterns in Intelligent Environments for Attentiveness Level. Taking as starting point the user attention the objective of this work lies in the study of the main aspects of the creation and editing tools of intelligent system that monitored attention and create a user behaviour pattern.
For this we identify central research questions that consist of: • How to classify attention?
• What is Learning Style?
• How many categories exist in Learning Styles? • How to create a user profile?
• What is necessary to store all this information?
The research questions previously specified allowed us to state the following objectives to be achieved:
• Definition of the capture method of the monitored data. The method must be the most efficient as possible;
• Definition of the formula to classify the level of attention. The formula must use the largest possible amount of data;
• Definition of the standardization model of user behaviour; • Definition of the storage method for the user profile;
• Development of an application to classify attention, detect the learning style and create an user profile for each user.
1.4. Research Methodology 7
1.4 r e s e a r c h m e t h o d o l o g y
Regarding the research methodology we adopted the action-research methodology [8]. Initially a crucial collection of the information was gathered for the construction of a solution design process. Then the research of relevant concepts and designs for the job began. The assimilation of concepts and projects were subject to constant renewal, as new ideas and information arose. The last part of the work was the development of a functional model and prototype that allowed the achievement of the set of goals. This research methodology has five iterated identifiable phases:
1. Diagnosing - Definition of the problem and its characteristics;
2. Action planning - Constant updating of state of the art and objectives of the work;
3. Action taking - Development of a prototype in order to achieve the defined ob-jectives;
4. Evaluation - Analysis and prototype correction based on the results obtained; 5. Specifying learning - The diffusion of knowledge and results obtained in the
scientific community.
As for the development of software solutions the methodology used will be adapted from SCRUM. As such, all previously explained steps will be applied in software de-velopment.
The first steps are diagnosing the problem and updating the state of art and objec-tives of the work. Next is the software development of the proposed objecobjec-tives. With these tasks completed, an evaluation of the work will be done, whose results are re-ported in the paper. Through these results, new problems arise which leads to a new cycle.
Scrum development is a simple methodology intended to solve long product de-velopment, which allows the developer to focus in the set of goals proposed. This methodology also solves the mismatch problem between a product’s business require-ment and the actual resulting implerequire-mentation (which normally occurs when develop-ing big products).
1.5 t h e s i s s t r u c t u r e
This thesis can be divided into five main blocks: Introduction (Chapter 1), State of Art (Chapter 2), Project (Chapter 3), Case Study (Chapter 4), and Conclusions (Chapter 5). At the end of the thesis, the Bibliography used is presented:
1. Introduction - In the first chapter there is a brief description of the current sit-uation, an introduction to key concepts and a presentation of motivation, theme, objectives and research methodology. Also, a brief description of the document is performed;
2. State of Art - Chapter two starts by giving an overview of the background re-search developed under the aim of this project. Some important related concepts are exposed, the concept of attention and factors that affects attention and its re-lationship with user behaviour. Also, describes learning style theories and their importance in the increased of performance.
3. Proposed Architecture – The third chapter outlines the project and system archi-tecture developed, where are specifies the technologies used and their implemen-tation details.
4. Case Study – Chapter four describe a case study based on the research objec-tives, the participants and data collection method. It’s also including all the data analysis and results obtained.
5. Conclusions – Finally, in chapter five some conclusions are made, that includes a critical overview of the performed work, limitations, recommendations for future work and final remarks.
2
S TAT E O F T H E A R T2.1 at t e n t i o n
Nowadays the world is getting increasingly competitive and the quality and quantity of the work presented is one of the decision factors in choosing a collaborator. It is no longer necessary to only perform, but from that performance should result a product with quality, in time, at the lowest possible cost, and with the minimum resources. It is essential that the factors that influence performance match the ideal values.
Attention is one of the factors that influence the performance of a human being when performing a task. If the attention of an individual is not at its best when performing the proposed task, its performance will be negatively affected, causing several problems.
In an enterprise environment, if an employee has lack of attention in his work, that behaviour can cause production delays. Consequently, a delay in delivery to costumers in extreme situations causes monetary losses. In some situations, such as, flight con-trollers or bus drivers, if the person is not 100% focused, an error can cause a tragic accident.
In educational environments, attention is considered a fundamental factor in the evolution and success of the student. If the student is not concentrating and paying attention to what is being taught, he will not capture information that is being provided and consequently the academic course will be compromised.
Attention is a resource that allows the human being to be focused on a situation and to be able to ignore non-priority information. As happens with performance, several factors can influence attention, like, stress, mental fatigue, anxiety, emotion, new en-vironments, and human health. Besides these factors, the advancement of technology has been a real problem that has increased the lack of attention. With the emergence
of the smartphone that provides new and varied information in real time and the new ways of communication, people’s attention is easily captured and the task that was meant is left out. [9][10]
Stress may have a positive or negative influence. On the one hand it is generally accepted that stressful events increase the level of attention [11–14]. On the other hand, there are cases in which stressful events cause depression or aging [15,16].
When some activities are prolonged for a long period of time, our brain may feel overloaded with such amount of information, and this leads to a potential emergence of mental fatigue, which decreases the level of students’ attention.
A substantial literature shows that anxiety affects perceptual and related processes of attention [17]. Anxiety has an impact on cognition and attention because it is often associated with adverse effects on attention of cognitive tasks [18].
Finally, health problems, mood, and the surrounding environment can also influence the level of attentiveness. Figure 1 [19], presents a design of factors that influence at-tention.
Figure 1: Factors that influence attention
As attention has great importance for the development and perception of the human being, several areas, such as, psychology, cognitive psychology, cognitive neuroscience, and computer science, have studied it over the years.
2.1. Attention 11
Attention in psychology
The study of attention by psychologists goes back to the beginnings of modern psy-chology. One of the most famous psychologists who dealt with the subject at that time was William James. According to his book, Principle of Psychology [20], the percep-tion of the existence of selective attenpercep-tion was not easy because many psychologists of that time believed that everything that occurred in the human mind was derived from experiences.
To William James, the breakthrough in his line of thought was when he was pre-sented with several objects and only a few caught his attention. He concluded then that what makes the human being experience this stimulus is the interest that they cause in the person.
William James’s definition for attention is ”Everyone knows what attention is. It is the taking possession by the mind in clear and vivid form, of one out of what seem several simultaneously possible objects or trains of thought...It implies withdrawal from some things in order to deal effectively with others, and is a condition which has a real opposite in the confused, dazed, scatter brained state.” [20](p. 403). It also says that the essence of attention is the focus, concentration, and awareness. [21]
Attention in cognitive psychology
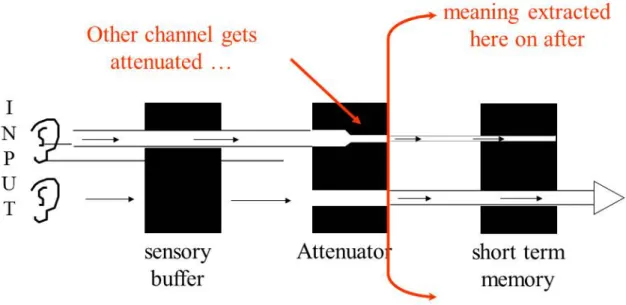
Within psychology, attention was also studied based on the branch of cognitive psychol-ogy. The psychologists who contributed to the study of attention were Colin Cherry with the “Cocktail Party Effect” theory [22, 23], Donald BroadBent with BroadBent’s filter theory [24] and Anne Treisman with Treisman’s Attenuation Model [25].
These psychologists based their studies on the sensory ability of humans and con-cluded that it is not possible to meet all inputs that one receives at the same time in a conscious way. These models try to explain that because there is such a limitation in the amount of information that a person can be attentive to, when the information gets to the person, it has already been selected. In the case of BroadBent’s theory, this information filtering is based on the physical characteristics of the information.
Figure 2: BroadBent’s filter theory
In Figure 2[25], two inputs are received, at same time, by the ears and are allocated in the sensory buffer. In the sensory buffer, the new information is maintained, for a short period of time, to be processed or forgotten. An initial input is chosen based on its physical characteristics and passes through the BroadBent’s filter. Then, the new information is saved in the short-term memory. The other initial information is maintained in the sensory buffer until processed or forgotten.
Attention in cognitive neuroscience
In the field of cognitive neuroscience attention was studied by Robert Desimone, John Duncan, and David Laberge [26].
Desimone and Duncan studied the neural mechanisms of visual selective attention. For them, the phenomena that may explain the problem of visual attention are the limited ability to process information and selectivity. To solve this problem, they de-veloped a model based on competitiveness. This model differs from the other models that define attention as a mental spotlight. To both, attention is “an emergent property of many neural mechanisms working to resolve competition for visual processing and control of behaviour”. The model is centred on the idea that at any moment the number of existing information will be bigger than the number of possible information to process. Also, important information will always have to compete with the irrelevant one. The
2.1. Attention 13
role of attention in this model is important because it has the function to make the important information more relevant than the less important one.
Regarding Laberge [27], his model is based on neuropsychological and neuroimag-ing studies and infer that there are at least 3 areas of the brain that are involved in controlling attention: frontal areas, thalamic nuclei, the posterior parietal cortex, and the interparietal sulcus. For him, these areas are necessary for attention and all com-bined control attention. [28,29]
Attention in Computer Science
After being studied by psychology, cognitive psychology, and many other areas, atten-tion is being studied by the field of computer science, because the number of people using new technologies to perform tasks is increasing. So it is necessary to study how to increase the attention of people on their task while not being distracted by the amount of information that is provided by these same technologies [30]
Koch and Ullman are two authors who have studied attention in the computing world. They propose the “saliency map” [31]. “Saliency map” is a combination be-tween different visual features that contribute to the selection of stimuli and a single type of topographic map. This proposal can offer the probability that each area of the visual field has to be captured. Later on, Laurent Itti developed the proposal model. For him, the first system had as input an image and the result was an initial image “saliency map”. This was the starting point for many developed models not only for
Figure 3: Saliency map example
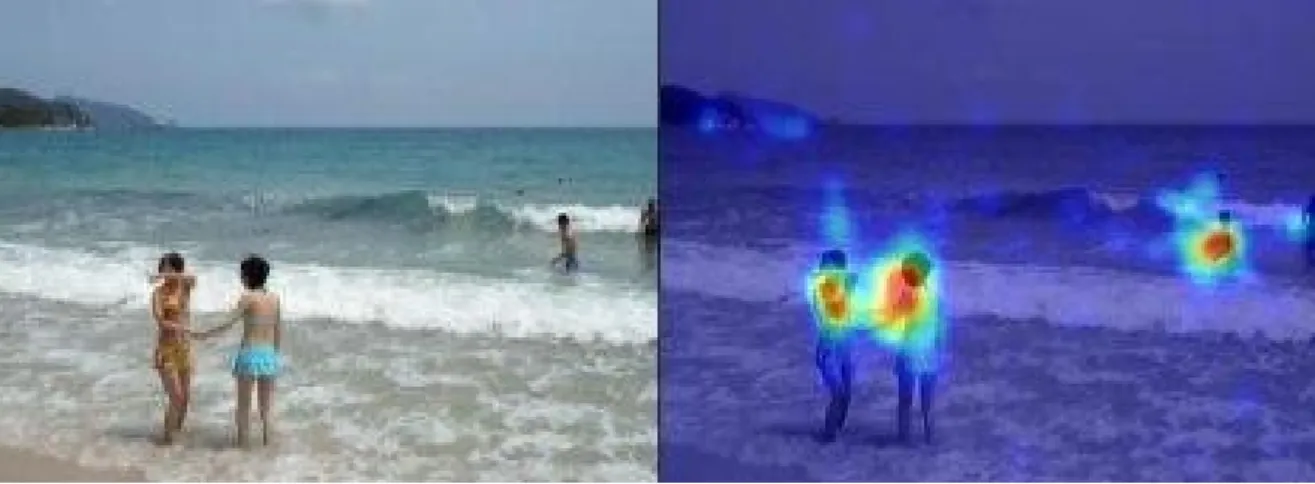
Another author who was interested in this branch is Matei Mancas [30, 32]. Accord-ing to Mancas, attention may have two approaches: the first approach is based on the two theories described above, saliency; the second approach is the visibility. In this model, it is assumed that an individual, when needing help to perform a task, looks for places where the information has good visibility. In this approach, the eye’s move-ment gives an automatic output of the focus area.
Figure 4: Visibility output example
The Figure 4 [30] presented an example of this second approach, where it is possible to visualize the same picture with the attention’s focus aimed at two different areas.
2.2. User Behaviour 15
On the left, the observer’s visual attention is directed at the flower, but on the right, the butterfly is the focus. These are two examples of image’s output obtained using this approach.
Attention Conclusion
To conclude, attention is high studied subject by several areas. Therefore, these studies lead to a lot of definitions and all of them are different and use characteristics and thought specific to them.
One important challenge is how to classify attention and what attention features are relevant for a particular situation.
In the next section, it will be explained how we can use human behaviour while using a computer to classify attention and how that behaviour influences attention [33].
2.2 u s e r b e h av i o u r
In the last years, task resolution using new technologies is increasing. Therefore, one of the biggest concerns is to find ways to make this use as efficient and effective as possible.
All the users do not do the task resolution similarly. Each person has its own be-haviour. This behaviour can be derived from several factors, such as: biological charac-teristics of the user, task’s characcharac-teristics, and environmental factors.
The recognition of these behaviours is already used in new technologies; an example is the recognition of users as a form of authentication on a device or software. This recognition is made by tracking of behavioural biometrics, such as, fingerprints, face recognition or iris recognition. [34, 35]
According to Roman Yampolskiy and Venu Govindaraju [36], this behavioural bio-metrics can be classified in five categories based on information type:
• Behavioural Biometric based on the analysis of text extracts or drawings made by the user;
• Behavioural Biometric based on computer interaction;
– Device usage, such as, mouse and keyboard. Devices that can capture the muscles’ actions;
– Software interaction: strategy, and knowledge.
• Behavioural Biometric based in monitoring data coming from low level action in software, such as, access log, storage activity, and calls systems.
• Behavioural Biometric based on data from motor skills.
The Behavioural Biometric based on strategy, skills in performing mentally demand-ing tasks in order to obtain the data. These monitored behaviours can be used to measure several variables that can influence the task development. There are already some studies that focus on recognition of some of these variables in the user behaviour [19, 34, 36,37].
One of the variables is attention. To recognize the lack of attention on user be-haviour, different ways of capture and classify attention were discovered. One of the first ways to try to quantify the attention level was a questionnaire. This questionnaire is presented to the user. After the user answers the questionnaire, the study’s author analyses the answers and presents the conclusions. However, this approach is more qualitative and depends on the author’s interpretation.[38]
The approach more quantitative is the one that use biometrics behavioural. It is an approach more focused on the perception stimuli. Eye-tracking is one of the most used techniques. Using this technology when performing a task on a computer, it is possible to know the screen area where the eyes are directed and, consequently, where is the focus of attention. So, it is possible to conclude if the user was with the visual attention directed to the screen area where the task is positioned. [38, 39]
Other approach is the neural activity caption. The most used technique is EEG, where through electrodes located in the scalp catch the brain waves and with the data acquired, it is possible to analyse the brain activity during a task. In many studies, the most important component is MMN (mismatch negativity). This component is the indicator of a brain reaction to a pre-attention process. Other techniques used are: functional imaging, fMRI, functional imaging, MEG, and functional imaging, PET scan. [38] Finally, the mouse tracking and keyboard tracking are techniques used to measure and classify attention. These techniques have already been used to measure other variables, like, stress [40] and mental fatigue [9,41, 42].
In the case of the stress study [40], the data was captured during an online exam of medical students. The captured data was related to mouse movement and keyboard usage. After the data were collected, the data were analysed in two phases.
2.2. User Behaviour 17
In the first phase, it was used statistic methods and the first conclusions were ob-tained. This data was analysed in two ways:
• To find common behaviour in groups of students; • Individual data was analysed for each student.
In the second phase, it was used a machine learning method to model the student’s response to a stress event. There were used two classifiers: one to classify the all students’ data and other to classify data from an individual student.
This study [40] concluded that stress affected the student’s performance on an exam, mostly negatively, but raised some doubts about the reason for which some students can improve their performance even with stress.
Behaviour Conclusion
It is important to be able to monitor user’s behaviours and understand how these behaviours influence and interconnect with the user level attention. And so, it should continue to be studied to give the necessary condition for user to progress and to improve the performance.
Relatively to the measure attention techniques, the first two techniques described are intrusive approaches.[43, 44] In the case of brain activity measure, it is necessary put some devices on user body to capture the data. This need can be annoying and the user cannot be comfortable. Although it is not necessary the use of devices on body, the eye-tracking technique is an approach that it’s necessary capture the user face and, if the user is under age, authorization is required.
The mouse tracking and keyboard tracking technique is a non-invasive approach because the data captured is made by a background software and the user does not have the perception that it is being monitored. This is an advantage over the two previous approaches because the users have no idea that they are being monitored and do not change their behaviour [45].
The project approach will be the non-invasive and non-intrusive approach [46]. Us-ing this approach and managUs-ing to capture and storage the user behaviour, it will be possible classify the attention and, also identify the user’s learning style [47].
2.3 l e a r n i n g s t y l e 2.3.1 Learning
With the constant changes of the world, the ability to learn is important and must be enhanced. Attention is defined in the dictionary as “knowledge or skill acquired by instruction or study” [48].
Learning has been increasingly studied because of its importance, as well as because of the need to know how it is influenced and how to increase the levels of knowledge in an individual [49].
The importance of learning is the development that brings to an individual. Through-out their life, humans acquire knowledge through learning. Learning is acquired by experiences, stories and observations of what is going on around them. Learning brings knowledge and it’s possible to influence the way this knowledge is transmitted. One of the ways to acquire knowledge is through teaching
In class, students capture diverse information transmitted by the teacher/instructor. The way this information is transmitted should be suitable for being interpreted cor-rectly. For this reason, several authors have created theories about the learning process and have defined several learning styles.[50,51]
2.3.2 Learning Styles Theories Kolb’s Learning Theory
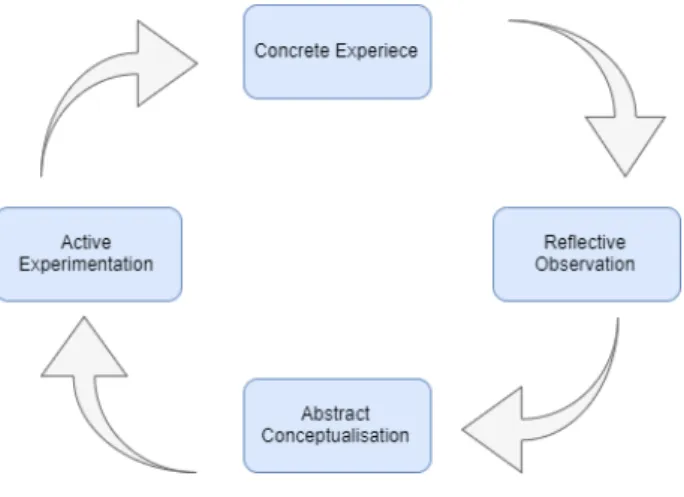
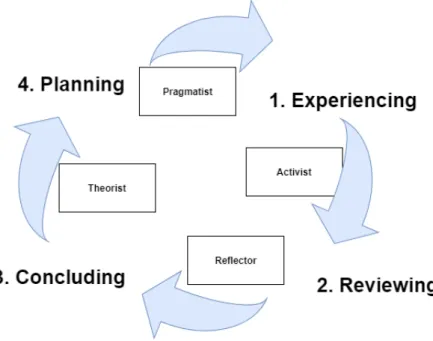
Kolb expressed his principle that a person learns from discovery and experience. [52] To Kolb, an individual does not learn by reading or seeing, it is necessary to experience. His theory proposes four distinct learning styles that are based on four stages of the learning cycle. In the Figure 5 [53] it’s presented the result of this theory was a set of learning styles that satisfy the human’s preferences and a learning style cycle. The learning cycle is divided into four phases: Concrete Experience, Reflective Observation, Abstract Conceptualization, and Active Experimentation. The cycle begins with Con-crete Experience. This phase matches with the beginning of a task. Then, the Reflective Observation stage is the moment to stop the task and think about what was done and what was experienced. The third phase is Abstract Conceptualization. In this phase, the individual interprets what happened and the relations between the situations. The
2.3. Learning Style 19
final phase is Active Experimentation. This phase is considered the way to put into practice what has been learned.[54]
Figure 5: Kolb Learning Cycle
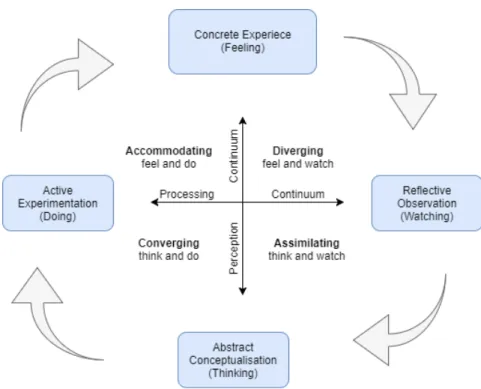
After defining the learning cycle, Kolb defined four learning styles based on the cycle described above. To Kolb each person is different in the way of learning and several factors, such as: social environment, basic cognitive structure, and educational experience influence his/her learning style. The learning style is a product from two variables: Processing Continuum, responsible for the way to approach a task, and Perception Continuum, which relates to the feelings towards a task and the assumed about the same task.
The four learning styles as we see in Figure 6 [55] are diverging, assimilating, con-verging, and accommodating.
Figure 6: Kolb’s Learning Style
• Diverging : people who perform better when it comes to creating a new idea; • Assimilating : concise and logical approach. People who prefer good
explana-tions to a practical activity;
• Converging : people who prefer techniques tasks where they can use what they have learned;
• Accommodating : people who prefer intuition to logic. They use analyses done by other people and prefer a practical and experimental approach.
In Table 1, it’s present the Peter Honey and Alan Mumford developed a theory about learning styles based on Kolb’s theory [56, 57].
Honey and Munford Kolb
Activist Accommodating Reflector Diverging
Theorist Assimilating Pragmatics Converging
2.3. Learning Style 21
Honey and Mumford Learning Theory
As presented in Figure 7, for Honey and Mumford, the learning styles can be classified in activist, reflector, theorist, and pragmatics.
The activist style corresponds to people who learn with practical activity and have an open-mind to learn. They prefer activities like competitions, brainstorming and group discussion.
Another style is pragmatics. The people of this learning style are interested in real facts instead of abstract theories. These people prefer activities like case studies, dis-cussion, and time to think how to apply what they learn.
The reflector style portrays people who prefer to observe and think about what they saw. They prefer activities like observations, interviews, and coaching.
And finally, the theorist is the learning style for people who like to understand where the new knowledge will fit in what they already know. [56, 57]
Felder-Silverman Learning Theory
Felder and Silverman propose a theory about learning styles. This theory does not have only the function to help the students understand how they can improve their learning but also, to give some teaching techniques for each learning style proposed.
The learning styles were based on other theories from different authors, such as, Jung and Kolb [58]. The styles were also based on student preferences about the way they enjoy receiving and process the new information. The dimensions used to characterize the learning styles were:
• Processing: Active or Reflective • Perception: Sensing or Intuitive • Input: Visual or verbal
• Organization: Inductive or Deductive • Understanding: Sequential or Global
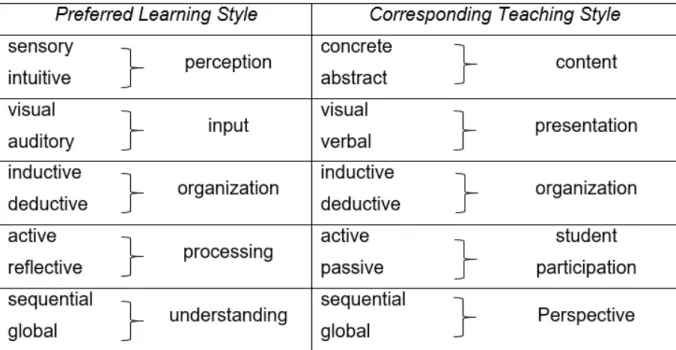
According to this approach, there are 32 learning styles. This happens because each style was described for an option from each dimension. One style, for example, is the active/intuitive/verbal/deductive/sequential. If this approach was used in an ed-ucational context, the teacher had to teach a subject in 32 possible ways, which was incompatible with the available time. To remove this problem, the engineering edu-cation modified the approach and named 5 different categories: intuitive, auditory, deductive, reflective e sequential as we can see in Figure 8.[58]
2.3. Learning Style 23
Figure 8: Felder-Silverman Learning Styles and Teaching Style
Learning Style Discussion
The learning style study is very controversial because some authors think that the many existing theories are very closed and their scientific support is lacking. For these au-thors, the learning style is not a straight concept, which means, that if a person prefers or feels more comfortable with the perception style, this not means that tomorrow the same person will not prefer an understanding style to learn.
For the authors Daniel Willingham, Elizabeth Hughes and David Dobolyi, this ob-session with the learning style and the student as an individual will bring paralysis because how the teacher will deal and meet the needs of each student at the same time and find the best practices to correspond to all.[59]
2.3.3 Learning Style Conclusion
Learning is a process where the human being captures and processes information and creates knowledge. This process may take place in a more formal way like school, or through personal experience. All situations can lead to knowledge but some
situa-tions are more propitious for learning. One of the reasons is the possibility to create strategies in order to facilitate the learning.
In education, the definitions of learning styles and teacher’s techniques have been the main factors in promoting interest in school and in improving the student’ school achievement [60].
Learning styles have been much studied by several authors, such as, Kolb, Honey, Mumford, Felder, and Silverman. And they will be very important for the develop-ment of this project. The theory of learning styles that will be followed is the Felder-Silverman theory because it is a theory based on all the previous ones and it is more complete and flexible.
3
P R O P O S E D A R C H I T E C T U R EThe goal of this project is to be able to measure the attention level and identify the more profitable learning style from an user behaviour.
The main themes for the planned work were presented in the previous chapter. At-tention, user behaviour and learning styles will be fundamental throughout the pro-posed work and resolve the propose problem.
This chapter is about the planning of the remaining project and its architecture.
3.1 p r o j e c t p l a n n i n g
The next step will be the development of the proposed application. First, a formula will be created that will indicate the student’s learning style. An algorithm must be chosen and it will be the basis formula. It will also be necessary to define the parameters that will influence the learning style.
Secondly, a formula must be defined to classify attention. The formula will use the largest number of data available.
Then, a database will be created and defined to store the user’s profile.
Finally, a service will be created to receive the data to be processed and send back the results: the attention classification and learning style of each user.
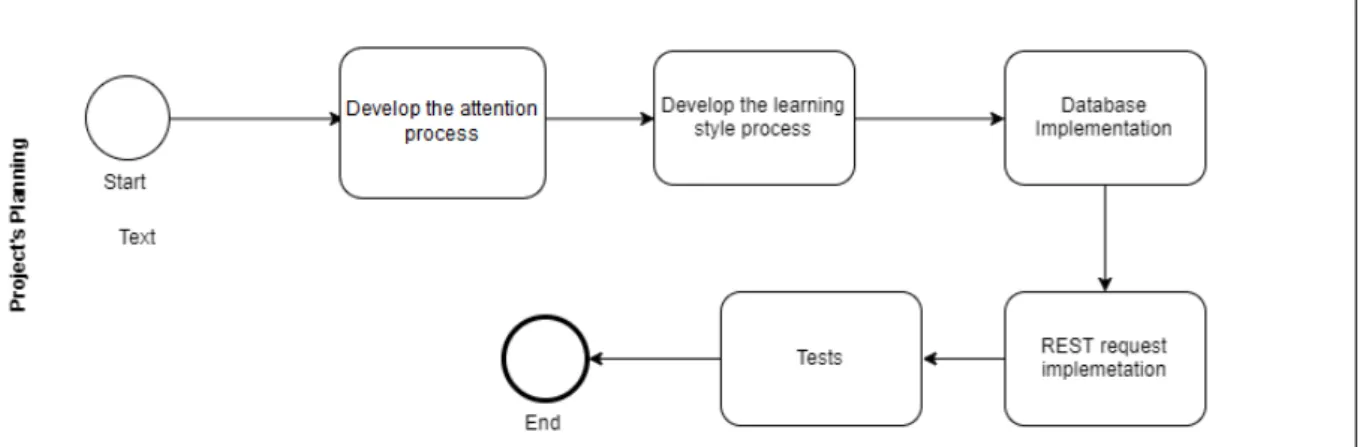
After the application’s development is finished, the system will be tested and the results will be analysed and discussed. In Figure 9, it’s present the project planning.
Figure 9: Project Planning
3.2 s y s t e m’s architecture
In Figure 10, the system’s architecture is presented. The system is divided by three el-ements. These elements ensure all the functionalities to resolve the proposed problem. The system also has two databases that provide and save all the necessary data.
3.3. Technologies 27
Classifier Module
The classifier module is the core element of the project. In this module are developed the main features to measure and classify the attention level and identify the learning style of each user. For this, it is necessary that the others system’s elements are in constant interaction to provide the needed data and allow it the return of the results obtained.
Three parts compose the module’s architecture. The first part is responsible for all database connections, with the needed configuration to access to the MySQL database and the DB Module feature to access to the Mongo DB, and the needed transactions with it. The second part is features implementation, such as, attention classification and learning style identification. All the data analysis and processing were developed in this part. The last part is the REST connection implementation. Here were built all the necessary connection the access to the system.
DB Module
The DB Module is an application which the goal is searching a specific data in a Mongo database and exporting it to a csv file. This module uses a mongo Driver, which make the connection between the database and the software. For that is needed to give a specific info to restrict the collected data. After collect the request data, it is given an opportunity to the user to export the data to a csv file.
On this project, the DB Module is used as library because it is necessary to access a mongo database to extract all the information about the user behaviour.
HTTP Service
For other software to connect to this software and get the information about the users it was necessary created multiple requests. These requests had to obey specifics rules for the functionalities’ results to be correct. Later in the chapter (section 3.5), it will be presented the projects requests and the rules behind it.
3.3 t e c h n o l o g i e s
3.3.1 Java
The main language used on the system is Java. Java is a high-level language and derivative from C-language that is based on object-oriented paradigm. It was released by Sun Microsystems in 1995. The Sun Microsystems was acquired by Oracle in 2010 [61, 62].
The Java virtual machine (JVM) is available on several operating systems, such as, MacOS, UNIX and Windows, which allows running an application on any system without the need to rewrite or adapt the code for each operating system.
Therefore, exist about 15 billion of electronic devices that use Java and about 10 million of developers worldwide.
The choice of this technology was based on this to be multi-platform technology and the many library and frameworks available.
3.3.2 Spring
To help on the develop of the project, it was decided to use a Java framework, Spring.[63] Spring is an open-source Java platform that provides infrastructure support to de-velop an application with Java language. It is one the most popular frameworks for developing enterprise applications.
The benefits to use this framework are [64], for example:
• To connect a database, spring will make a method to make the transaction with-out the problem with the transaction API
• To use HTTP request, the spring will make a method with a HTTP endpoint without having to be worried about the Servlet API.
3.3.3 Maven
Maven is a management software project and builds automation, which manage and build projects easily and was developed by Apache Software Foundation [65].
The maven build process is based on the concept of POM, Project Object Model. The POM file is used to describe the project, to define all the dependencies, the compile
3.3. Technologies 29
process and the needed plug-ins. Java libraries and plug-ins can be dynamically down-loaded from global repositories, like, Maven 2 Central Repository and storage it on the local repository to be used as dependencies on the projects.
3.3.4 SQL
SQL (Structured Query Language) is a standardized programming language with the goal of managing relational databases. [66]
It was created in the late 1970s by IBM and became standard to relational database by ANSI and ISO.
Database administrators and developers used this language to write data scripts and data analysts and run analytical queries use SQL.
Exist several SQL commands that are divided by types, such as data manipulation language (DML) and data definition language (DDL) statements, transaction controls and security measures
3.3.5 HTTP Protocol
To establish the communication with other software that want to benefit from the sys-tem’s functionalities, it is decided to use the HTTP protocol to manage all the connec-tions through messages.
HTTP [67] is an application-level protocol, which allows the exchange of data be-tween a client and a server. This client-server protocol was designed in the early 1990s. The messages that are exchange between both parts are called as request on client side and as responses on the server side.
This protocol defines several methods, which goal is to designate the action to be executed. The principle methods follow CRUD methodology (See Table 2).
CRUD operations HTTP method Create a new resource POST Read/Retrieve a resource GET
Update a resource PUT Delete a resource DELETE
3.4 d ata b a s e
In this section, it is presented the databases that support the system’s operation.
3.4.1 MongoDB
MongoDB is a document-oriented database created by MongoDB Inc. at 2009. It is classified as a non-relational database. The storage is made by JSON-like documents, means that fields can be different from document to document and the structure can change any time. The access and analyse data, MongoDB use powerful ways, such as, ad hoc queries, indexing and real-time aggregation.
In the project, the MongoDB is the database where the data from the user’s behaviour is storage. It is an external database and the way of storage it’s not controlled by this system.
The necessary data come from these collections: User, TaskRecords, MouseRecords and KeyboardRecords. In these collections, it’s storage the important data from the behaviour from a user at a certain date and time.
Users
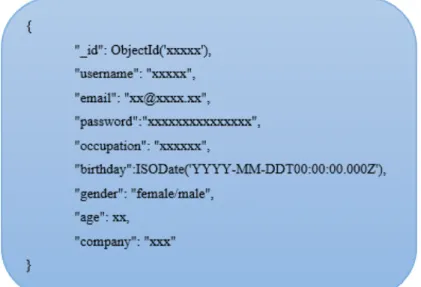
In this collection, it’s storage the data from a user. On Figure 11, it’s possible to see an example of a “User” collection. From this collection, it’s collected information about a user, such as, username, age, and gender. Also give us the necessary information to differentiate users.
3.4. Database 31
Figure 11: ”User” collection example
TaskRecords
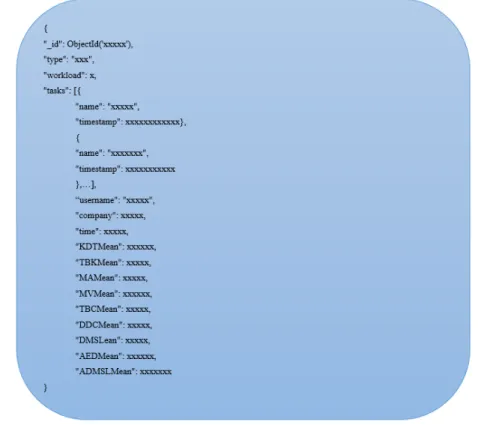
In this TaskRecords collection, it’s storage the data from a task. On Figure 12, it’s pos-sible to see an example of the collection. From this collection, it’s collected information a specific task. As a property of this collection, it has a set of user’s tasks at a specific time.
Figure 12: “TaskRecords” collection example
MouseRecords
In this collection, it’s storage the data from the mouse records detected from a user usage. On Figure 13, it’s possible to see an example of the collection.
From this collection, its collected data from a record, like, mouse velocity, mouse acceleration, click duration and time between clicks.
3.4. Database 33
Figure 13: “MouseRecords” collection example
KeyboardRecords
In this collection, it’s storage the data from the keyboard records detected from a user usage. On Figure 14, it’s possible to see an example of the collection.
From this collection, it’s collected data from a keyboard record: the key down time and time between key.
Figure 14: “KeyboardRecords” collection example
3.4.2 MySQL
MySQL is one of the most popular open-source database. It is considered as a database management system (DBMS). The support interface is SQL. [67]
In the project, it was created a MySQL database to store all the information about the obtained results from the several systems’ features. The database was created to support all the measured data from the users. The Figure 15 display the database’s logical schema.
3.4. Database 35
Figure 15: Database schema
In view of the presented schema, it is described the tables and the table’s attributes. Start with the table “User” (see in Table 3) this table store all the information about the users that will be monitored. For example, if the system is used in a school, the users will be the students. The user table is composed by an id, to identify the user in the database; the identifier is the username that the user has. The attentionTotalScore represent the sum of all measured attention and the measuresCount the number of
measures that exist from each user. Finally, the learningStyle identify the user learning style until the moment.
Row Type Key
Id INT PK
Identifier VARCHAR(45)
attentionTotalScore DECIMAL() measuresCount INT
learningStyle INT
Table 3: User Table Details
The table “Session” (see in Table 4) store all the information from a set of measures; the data represent the general information about the related measures. It is composed by an id, to identify the session in the database. The id user is a foreign key that is related with a data from the User table. This attribute is one of the most important, because with that is possible to group all the data about session and all related data by user.
The score represents the measured attention from that session. The type identifies the task that this session is from. The token represents the session between this system and other application that will communicate with. The timestampStart and timestamp-Final identify at temporal level between begin and end of the session.
Row Type Key
Id INT PK
id user INT FK(”User”)
Score INT
Type INT
Token VARCHAR(45)
timestampStart LONG timestampFinal LONG
Table 4: Session Table Details
The table “Measures” (see in Table 5) store all the information from a measure from a session. This represents data from the user’s behaviour on a specific time.
It is composed by an id, to identify the measure in the database. The id session is a foreign key that is related with a data from the Session table. This attribute connects the measure to a specific session from a user.
3.4. Database 37
The time represents the all the total of time that the user was monitored. The use-fulTime represent the amount the time that is count as good time to the attention measure.
The attribute attention is the measure attention from a user on that measure. The timestamp identifies the time of the measure.
Row Type Key
Id INT PK
id session INT FK(”Session”) Time Decimal()
usefulTime Decimal() Attention Decimal() timestamp LONG
Table 5: Measures Table Details
The table “RowData” (see in Table 6) store all the information from the mouse and keyboard usage from a measure.
It is composed by an id, to identify the rowdata in the database. The id measure is a foreign key that is related with a data from the Measure table. This attribute connects the rowData to a specific measure.
The other attributes represent the behaviour from the keyboard and mouse usage.
Row Type Key
id INT PK
id measure INT FK(“Measures”)
ma DECIMAL mv DECIMAL cd DECIMAL tbc DECIMAL ddc DECIMAL dbc DECIMAL tdc DECIMAL dplbc DECIMAL kdt DECIMAL Tbk DECIMAL
Table 6: Row Data Table Details
It is composed by an id, to identify the task in the database. The type is the name of that task. The name is enough to understand the task.
Row Type Key
Id INT PK
type VARCHAR(45) Table 7: Task Table Details
The table “LearningStyle” (see in Table 8) store all the information from the learning style of the user. This table exist to give meaning to the value used in the user table
It is composed by an id, to identify the learning style in the database. The name is to identify the learning style.
Row Type Key
Id INT PK
Name VARCHAR(45)
Table 8: Learning Style Table Details
3.5 h t t p r e q u e s t s p e c i f i c at i o n
All the communication from the system with external application is made by HTTP requests. In this sub-chapter, it will be presented the entire request that the system implement.
The requests are divided by theirs action: attention, historic and learning style. The most important is the request to start the attention measure and classification, named Session Request. Without the data that this request will generate, the others request will be useless because they need the generate data.
3.5. HTTP Request Specification 39
Figure 16: Session Request specifications
The session request is a POST request that will be receiving as parameters two dates, the initial and final date to collect data. These dates need to be on timestamp form. The other parameter is a JSON object that will contain the information about the rules to filter the generate data. It will include also the token to identify which session the request belongs to. The object can contain the information about the users that the client wants to receive as result. The figure 16 present the request specification
Relatively about the learning style requests, it exist two requests. The first request is to receive information about the evaluation of the users on a specific session (see in Figure 17). For that, it receives as parameters the token of the session, the same used on session request, and the list of users and the respectively evaluation. The response will be true or false, if the save of the data happened correctly.
Figure 17: Evaluation Request specification
The other request is to request (see in Figure 18) the learning style from a specific user. For that it is necessary receive the user identifier. The response is the type of learning style identified.
Figure 18: Learning Request specification
The other requests are to collect information that was generated before and the client want information about a specific time space or the data aggregate on general values.
First it is available a request to get the total attention level from the beginning (see in Figure 19). For that it is needed to receive an identifier and the return will be the value.
3.6. Features 41
Figure 19: Historic Global Request specification
Lastly its necessary the request to get the historic data from a user, but with the data grouped by day (see in Figure 20). Like the other request, it is necessary to send the user’s identifier as parameter.
Figure 20: Historic Days Request specification
3.6 f e at u r e s
On this sub-chapter, it will be presented the features from this project. It will be explained the feature workflow, the feature goal and some of the taken decisions for the implementation.
3.6.1 Classification of Attention
The goal of this feature is to classify the level of the user’s attention when perform a task at the computer. The performance is achieved with the user’s behaviour using the mouse and the keyboard and the several applications that were accessed.
Figure 21: Attention Classification Process Workflow.
The Figure 21 presents the workflow of the feature, since receive the request until the request reply. First, it’s necessary to receive a post request with three parameters, two dates and a JSON object. The JSON object has data related with the task rules, which means, a group of applications allowed in the current task. It founded there the task’s type, the request token and finally, a list of the users that the recipient wants information. The list of the users is an optional data.
After receiving the request, it’s used the DbModule and with the two dates initial and final. The software collects the data from that time space. Then start the analysis and then the classification process. When the classification is finished, it is built a JSONObject response (see in Figure 22) and sent to the sender of the original request.
3.6. Features 43
Figure 22: Request Response.
Data Analysis
The data collected is divided into three types: related to the task, interaction with the mouse and interaction with the keyboard. In this project, the task data is the most crucial because from it derives most part of the attention level.
To obtain the task results, the task rules received in the request are used to have a perception of how much time the user has spent on the applications related with the task rules.
As far as the mouse and keyboard results are concerned, their role is present on how the user interaction is occurring and help the coordinator/teacher understand if any student, who has the application active, is really working on it or not. To do that many values, such as mouse acceleration, mouse velocity, distance between clicks, duration of clicks, time between keys, key down time velocity are taken into account.
Classification Process
Data: d – list of users’ application t – task name
r – list of index and task’s rules
Result: list of users’ application with defined task Algorithm : t¡-0 for(i¡-0;i¡Size(d);i++) t¡-0; foreach(HashMap.Entry e:r) switch (e.key) case 0:
if(d[i] contain e.value) t++
case 1:
if(d[i] start with e.value) t++
case 2:
if(d[i] end with e.value) t++
case 3:
if(d[i] not contain e.value) t++ end switch if(t == Size(r)) d[i].task.add(t) end if end foreach end for
Algorithm 1: Compute task’s user data with task’s rules
As described in Algorithm 1, when the software receives the data, it groups it per student. In the next step, it goes through the list of users and classifies the attention
3.6. Features 45
per student. First, it computes the task data where it analyses if the applications used on the specific time match the defined task rules.
Then, with the applications already classified as work related or not, it is necessary to measure the amount of time that the user spent with each type of application and if at the time that the user was in a work related application exists any use of the peripherals, mouse and keyboard (see in Algorithm 2).
To classify the level of attention, the previous measure is used and calculates the percentage of each time comparatively with the total interaction time. The percentage of time spent on the work application classifies the level of attention.
Data:
d – UserData e – final date
Result: AttentionTask (interaction time, work applica- tion time, other application time, percentage work, percentage other)
Algorithm: time = 0
totalTime = e – d.getListTask[0].getTime() for(i=0; i¡d.getListTask; i++)
Boolean peripheral =
peripheralUsage(d.getListTask[i].initialDate,d.getListTask[i].finalDate)) if(Empty(d.getListTask[i].tasksRules) —— !peripheral)
time = time + (d.getListTask [i+1].time- d.getListTask [i].time) end if
end for
timeTask = totalTime – time
userAttention = (timeTask * 100) / totalTime Algorithm 2: User’s task time and attention level measure
The other data of mouse and keyboard is fundamental to give an idea of the user interaction. So, it measures the average of the values collected, like, mouse velocity, time between key and pace between clicks, etc.
3.6.2 Learning Style’s Identification
The main goal of this task is to identify the user’s learning style. This information will give to the people in charge what is the best approach that they have to take to increase the performance succeed.
To this project, the learning style identification will be influence by the task type, the level of the attention on that task and a qualitative evaluation given by the responsible to the user’s performance. To the task’s results be the most correct possible, it is necessary that the needed info be constantly collected to the learning style be the most correct for the user.
Therefore, this feature is not usable if the previous feature, attention classification, has not been used and the information about the task and about the performance has not been given to the system.
Figure 23: Learning Style identification Process Workflow
The Figure 23 describes the workflow of this feature. First, there needs to be a request to get the learning style for a specific student. Then, it’s necessary to collect all the available data that it is needed to identify the learning style.
3.6. Features 47
After the data from the user is collected, it is built the dataset that will be used on the identification algorithm. With the dataset ready, the next step is running the dataset on the algorithm and then analyse the results.
The last step is returning the data about the learning style to the recipient. Dataset
After the data is collected the database, the data is manipulated and it is built a set of required data to identify the learning style.
The user attention level, the type of the task, and the task evaluation, will constitute it. That means that all set of data that built the dataset are related with a specific user measure (See in Figure 24).
Figure 24: Data set example
The property task’s type is identified by the nominal data video, text, image and audio. Each number represent a task’s type and. The property attention level is a numeric data and consequently more related with a learning style.
The property attention level is reached by the classification of attention feature. Fi-nally, the property evaluation has to be given by a request for the specific session, where this evaluation drifts between 1 and 10. The 10 is the higher evaluation and the 1 the lower evaluation. This data is given by the responsible and represent the perception that the person has about the user performance.
k-means algorithm
K-means (see in Figure 25) is an unsupervised learning algorithm that can be used to solve clustering problems made by MacQueen in 1967. [67, 68] Clustering is a data mining technique that divides the data in different groups. The data in each group is related.
Figure 25: K-means algorithm process example
The algorithm procedure tries to classify the data over a number of clusters defined at begin of the process. The goal is to define the central point of each cluster and then associate each instance of the dataset to the nearest central point. Then it is recalculating a new cluster central point and the entire instance is again associated to a new central point. When any instance is associated with a new central point the algorithm stops.
Identification Process
After the creation of the dataset it will be used a cluster algorithm to group the in-formation on the dataset. The cluster algorithm that it will be used is the k-means algorithm. To use this algorithm, it will be add to the project a WEKA dependency. Weka was developed by University of Waikato and it is a machine learning software that is used for data mining tasks.[69]
3.6. Features 49
Data:
u = user’s identifier
Result: learning style code Algorithm:
d = database (Select * from Session where user = u) dataset = datasetCreation (d)
SimplekMeans algorithm; algorithm.clusterNumber = 4 algorithm.buildCluster(dataset)
result = algorithm.clusters / learningStyle best = 0
foreach(results = >r)
value = (r.evalution * 0.5) + (r.attetion * 0.5) if(value>best)
learningStyle = r.learning end if
foreach end for Algorithm 3: Learning Style process
To use this algorithm (See Algorithm 3), it’s necessary to define the number of the clusters that the algorithm needs to look. On this case, it is easy to find the number because the number of the task’s types is four, so the algorithm will search for four clusters.
When the cluster algorithm is finished, the results are analysed. The results can be too similar, so it was understood the need to give height to the value from the attention and the evaluation. The both values are worth 50% of the value from the learning style identification.
The result from the learning style came with the style with the higher value with the relation between attention and evaluation.
3.7 p r o p o s e d a r c h i t e c t u r e c o n c l u s i o n
To conclude, the system’s features begin with HTTP request that brings the required information for the evolution of the process. Then, the data can be collected from two databases: a MongoDB and a MYSQL database.
The data is processed in Classifier. In Classifier, the analysed data uses the new information and compares it with data from the saved profile.
The data’s analysis is done in two parts: user’s attention classification and user’s learning style definition. To classify it, it will be necessary to group the data per stu-dent, then analyse if the application used on the specific time matches the defined task rules and measures the amount of time that the user spent on each type of application. The level of attention will be calculated by the percentage of time spent on the appli-cation comparatively with the total time. To define the user’s learning style, it used a cluster algorithm to find groups of data related by the task’s type and then with results identify the better learning style for the user.
After the Classifier process is finished, the results of the user’s attention level and the user’s learning style will be sent back to the request’s origin, with a response type JSON.
4
C A S E O F S T U D YIn this chapter, it will be presented a case of study which it was used to tested and validate the results of the application.
It will be described the context of the experience and the experience’s outcomes
4.1 c o n t e x t
This project was applied, to be tested and check the results’ quality, on a student class while the students were performing a task based on design software, like, Adobe Pho-toshop. This class is from the High School of Caldas das Taipas, Guimar˜aes, Portugal.
To participate in this experience were selected a group of 22 students, 9 girls and 13 boys, with an average age of 17.6 years old. The experiment took place in four lessons from the class with different types of activities. In these activities, the students have a computer and the lesson duration to solve the activity. To solve the activity, all the information about the lesson goal was given to the students.
In different days, they have a lesson, where they have access to an individual com-puter and two hours to complete a task and the lessons contained tasks to be completed using Photoshop. All the participants thus have computer proficiency. The room was equipped with similar computers. Each participant was randomly assigned to one computer. The class students have IDs between 12P501 and 12P522.
The main goals of this experience were to understand the student behaviour when face off with different type of activities and how the project results can help the teacher to act in order to step in if necessary to improve the student performance.
About the attention classification process, the experience ran with regular request to the system with five minutes apart, then he students’ behaviour was collected and with