ESCOLA BRASILEIRA DE ADMINISTRAÇÃO PÚBLICA E DE EMPRESAS MESTRADO EXECUTIVO EM GESTÃO EMPRESARIAL
IMPACT OF EMAIL MARKETING CAMPAIGNS ON E-COMMERCE: A CASE STUDY IN THE FASHION
INDUSTRY
CARLOTA ALVIM XAVIER KELLY
Rio de Janeiro - 2018
DISSERTAÇÃO APRESENTADA À ESCOLA BRASILEIRA DE ADMINISTRAÇÃO
Ficha catalográfica elaborada pela Biblioteca Mario Henrique Simonsen/FGV
Kelly, Carlota Alvim Xavier
Impact of email marketing campaigns on e-commerce : a case study in the fashion industry / Carlota Alvim Xavier Kelly. – 2018.
64 f.
Dissertação (mestrado) - Escola Brasileira de Administração Pública e de Empresas, Centro de Formação Acadêmica e Pesquisa.
Orientador: Fabio Caldieraro. Inclui bibliografia.
1. Marketing na Internet. 2. Comércio eletrônico. 3. Campanhas
publicitárias. 4. Comércio varejista. 5. Merchandising de moda. I. Caldieraro, Fabio. II. Escola Brasileira de Administração Pública e de Empresas. Centro de Formação Acadêmica e Pesquisa. III. Título.
This dissertation closes an important chapter of my life, my academic years. It would not be possible to thank individually to each one of those who I had the chance to work with, surpassing challenges and celebrating the small achievements over these years.
First of all, I would like to thank my family who is my foundation who continuously supported and motivated me in every decision, challenges and accomplishments that I proposed myself. In particular, I would like to acknowledge my mother that is my role model as an individual and who taught me to be confident in my own decisions and to chase my dreams. But also, to my grandfather, that is an example of a great professional, truly passionate and dedicated to his work and makes me proud to see that his accomplishments are still reflected and admired by those who had the chance to work with him.
Secondly, I would like to thank Professor Fábio Caldieraro that provided the guidance and the help throughout this dissertation. Furthermore, I would also like to express my gratitude to all my close friends and for my Double Degree colleagues for their support and dedication. Lastly, I must thank Lanidor, and everyone enrolled in this process, for their help and availability for the elaboration of this thesis.
PURPOSE: The purpose of this study is to evaluate the impact of two type of email campaigns
on e-commerce revenues, in the context of a fashion retailer. This retailer´s e-commerce platform englobes three concepts: LA Woman, LA Kids and LA Loft. Given these circumstances, the study aims to understand under the guidance of the disposable metrics, the response from the different email campaigns to traffic driven and sales conversion on the website.
DESIGN/METHODOLOGY: A case study research approach was employed with the support
of data obtained from two platforms: in-house email marketing database and Google Analytics. Furthermore, some descriptive and explanatory research was conducted to address the proposed research questions.
FINDINGS: The key findings display that informative email campaigns are well succeeded
concerning sales conversion, while price reduction email campaigns generate a higher amount of traffic into the website. Moreover, this was reconfirmed as returning visitors to the site come mainly through informative email campaigns generated higher revenues and transactions.
RESEARCH LIMITATIONS: The study presented any limitations associated with the nature
of the research approach and the organisation of the data provided by the company. Future research can evaluate the results from other companies’ scope and have a more complete overview.
PRATICAL IMPLICATIONS: From these results, the fashion brand used to conduct this
analysis, Lanidor, can adapt its digital strategy to better address and engage their mailing list. Besides it can adapt the type of email campaigns and content to the different aims beyond their digital marketing strategy.
KEYWORDS: Email Marketing; Email Campaigns; Drive Traffic; Performance; Sales
Conversion; Returning Visitors; Fashion Retailer; Online Metrics; E-Commerce
OBJETIVO: Esta tese propõe – se a avaliar a influência de dois tipos de campanhas de e-mail
nas vendas online, no contexto de um retalhista na área de moda. A plataforma online do retalhista engloba três conceitos diferentes: LA Woman, LA Kids e LA Loft. Deste modo, o estudo ambiciona entender recorrendo às ferramentas disponíveis, a resposta dos diferentes tipos de campanhas de email ao tráfico gerado e transações no website da marca.
METODOLOGIA: Relativamente à abordagem de pesquisa, um estudo de caso foi o método
selecionado com ajuda dos dados obtidos das duas plataformas: base de dados interno de email marketing e Google Analytics. Consequentemente, práticas de pesquisa descritiva e explicativa foram conduzidas de modo abordar as perguntas propostas no âmbito desta dissertação.
RESULTADOS: As principais conclusões demonstram que campanhas de email de natureza
informativa são mais bem-sucedidas atendendo as vendas, enquanto que as campanhas de email com reduções de preço associadas geram um maior número de tráfico no website. Esta primeira descoberta foi reconfirmada, visto que os utilizadores que regressam ao site veem sobretudo através de campanhas de email de origem informativa, que geram maior número de receitas e transações
LIMITAÇÕES: A dissertação apresenta algumas limitações associadas à natureza da sua
abordagem de pesquisa, bem como aos dados fornecidos pela marca. Desde modo, seria interessante para estudos futuros considerar – se a avaliação os resultados obtidos no ponto de vista de outras empresas do sector da moda, de forma a obter um cenário mais completo.
APLICABILIDADE DO TRABALHO: Atendendo aos resultados desta dissertação, a
empresa da área da moda, Lanidor, poderá adaptar a sua estratégia digital, de modo a estabelecer e obter uma maior aprovação da sua lista de subscritores. Adicionalmente, este estudo concede a oportunidade de adaptar o tipo de campanhas de email usadas, bem como, o seu conteúdo consoante os seus objetivos e a sua estratégia digital.
PALAVRAS-CHAVE: Email Marketing; Campanhas de Email; Tráfico Gerado;
Performance; Conversão de Vendas; Utilizadores Repetidos; Retalhista da Área de Moda; Métricas Online; E-Commerce
List of Figures List of Tables List of Abbreviations 1 Introduction ... 10 1.1 Background ... 10 1.2 Problem Statement ... 13 1.3 Purpose of Research ... 14 1.4 Scope ... 14 2 Literature review ... 16 2.1 E-Commerce ... 16 2.2 Customer Journey ... 17 2.3 Email Marketing ... 18 2.3.1 SPAM Emails ... 20
2.3.2 Types of Email Marketing Promotional Campaign Messages ... 20
2.4 Metrics Used to Evaluate Email Marketing Performance ... 21
2.5 Summary and Main Hypotheses ... 25
3 METHODOLOGY ... 28
3.1 Research Approach ... 28
3.2 Data Collection ... 29
3.3 Data Analysis ... 31
4 ANALYSIS OF RESULTS ... 33
4.1 RQ1: What is the relationship between the type of email campaign and the different response metrics?... 33
4.1.1 Descriptive Statistics Analyses ... 33
revenues? ... 37
4.2.1 Multivariate Linear Regression Analysis... 38
4.2.2 Cross - Tabs Analyses... 39
4.2.3 Univariate Descriptive Statistics ... 41
4.2.4 Welch - Satterthwaite Correction ... 41
4.3 Summary and discussion of the statistical analyses results ... 43
5 CONCLUSIONS, LIMITATIONS AND FUTURE RESEARCH ... 46
5.1 Conclusions ... 46
5.2 Limitations of the Study ... 48
5.3 Future Research ... 49
References ... 50
Figure 1 - Retail e-commerce sales as a share of retail trade in selected countries from 2014 to
2017 (Statista, 2018) ... 12
Figure 2 - Success rates based on offer types of email subject line (Yes Lifecycle Marketing, 2018) ... 12
Figure 3 - Reasons to sign up for email (Email Tracking Report 2014)... 19
Figure 4 - Email marketing funnel (Jennings, 2015) ... 21
Table 1 - E-commerce channels: percentage of users, transactions, percentage of revenues in
2017 (Lanidor - Google Analytics, 2018) ... 15
Table 2 - Advantages and disadvantages of email marketing (Vasudevan, 2010) ... 19
Table 3 - Types of email marketing messages (Priyanka, 2012 & Kennedy, 2015) ... 20
Table 4 - Benchmarks results from 2017 (SignUpTo, 2017 & Coleman, 2017)... 24
Table 5 - Type of email campaigns ... 29
Table 6 – Online metrics formulas ... 31
Table 7 - Description of the dummy variables ... 32
Table 8 - Dependent and independent variables for regression model ... 32
Table 9 - Emails sent x Week ... 34
Table 10 – Number and Percentage of emails open and open rate in the studied period ... 34
Table 11 – Number and Percentage of email clicked and click – through – rate in the studied period ... 35
Table 12 – Number of Transactions and Conversion rate during the studied period ... 35
Table 13 – Revenues and Revenue per Email Sent during the studied period ... 36
Table 14 - Welch – Satterthwaite correction ... 36
Table 15 - Main indicators of the regression model´s quality and unstandardized betas and significance of independent variables on the dependent variable ... 39
Table 16: Cross – Tabs analysis of price reduction email campaigns and returning visitors .. 40
Table 17 - Cross – Tabs analysis of returning visitors and transactions ... 40
Table 18 - Univariate descriptive statistics results ... 41
§ BOGO – Buy one, get one free § B2B – Business to business § B2C – Business to commerce § CTR – Click – through – rate § C2C – Consumer to consumer § E-commerce – Electronic commerce § ESP – External service provider
§ ICT – Information and communications technology § OLS – Ordinary least squares
§ TV - Television
§ ROI - Return on investment § RPES – Revenue per email sent § RQ1 – Research question one § RQ2 – Research question two
§ SME – Small and medium – sized enterprises § SPSS – Statistical package for the social sciences § URL – Uniform Resource Locator
1 INTRODUCTION
This chapter presents the topic discussed in this dissertation with context overview and explanation of its relevance. It starts by delivering background information about email marketing, followed by the identification of the problems along with the purpose of this research. Afterwards, it addresses the scope providing more information about the company chosen to conduct this study. This chapter ends with the structure followed in this dissertation.
1.1 Background
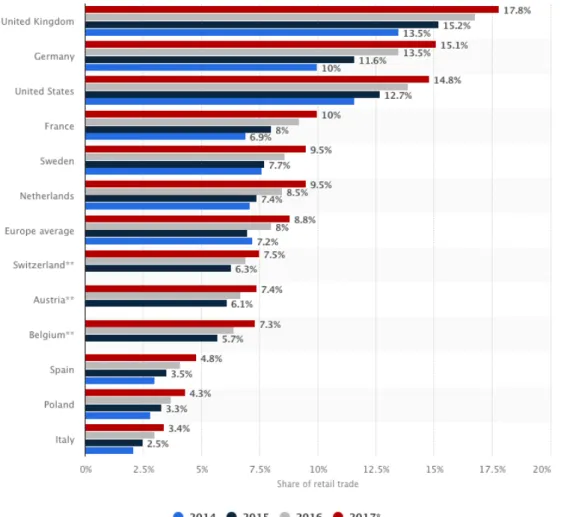
The Internet changed people´s daily lives influencing the way how people communicate to how they shop (Dertrouzos, 1997). Its future is very optimistic and promising as it is continually innovating the world, in particular in the retailing sector (Klein, 1998). Besides, it transformed the era that people live in into an electronic age since the form how companies and consumers communicate and interact is entirely changed (Darley, Luethge, & Blankson, 2010). According to Kim and Lennon, by 2010 internet retail was expected to reach 13% of the total sales. In 2017, internet sales value only accounted for 8,8%, on average in Europe (figure 1) (Statista, 2018). The majority of businesses developed a web presence. As a result, marketers identified a vast potential on the internet and on the new e-marketing tools available as a mean to communicate with the customers (Salehi, Mirzaei, & Aghaei, 2012). E-marketing is much more than a selling tool as it is also a way to attain brand value and deliver customer satisfaction (Strauss & Frost, 2006).
Despite the fact that these new marketing communication channels seem very attractive, they are also challenging especially for marketers due to the high variety of options, and there is not a formula for the best way to apply them, as each case is a case. In fact, according to Duke University survey (2013), traditional channels presence was impacted by this new reality, and their budget was reduced to increase the investment in online advertising spending. Nevertheless, in Danaher and Dagger´s words, some traditional media channels as television maintained its influence over companies´ sales and profits. Similarly, new media email and sponsored search also impacted revenues positively. While social media and online media seemed to be more effective in increasing traffic to the website (Danaher & Dagger, 2013).
Among the new media channels formats, email marketing become one of the favourite channels used by businesses to contact with clients, but also to increase companies´ profit due
to high return on investment when compared with other marketing methods. Email marketing allows companies "to keep in touch, to interact, to tell a story, to introduce an idea, (…) to build loyalty with your brand".
A significant advantage offered by email is linked with the trackability characteristic as it enables to experiment what works better, about offers and subject lines (Baggott, 2007). Another high point of this channel is the permission-based feature, implying that subscribers have the option to decide if they want or not to be reached by email (Fariborzi & Zahedifard, 2012). In 2017 “Yes Lifecycle Marketing” stated that 23% of the analysed emails included an offer in the subject line whereas more than half advertised a percentage reduction message. Moreover, loyalty offers produced highest scores in some metrics such as open rates, unique click rates, and conversion rates. Thus, having an established relationship with a selected audience who already engaged with the brand increases the success of the email marketing campaigns (figure 2).
Nevertheless, there are some drawbacks, as an example, response decay since it is challenging to maintain subscribers actively engaged. The reason behind this disadvantage is linked to the overload of emails, making it tricky for individuals to distinguish between requested and unsolicited email (Fariborzi & Zahedifard, 2012).
Broadcast email type is regularly used by brands since companies usually possess their group of receivers, also known as mailing lists. Within this type of email, there are various formats such as newsletters and direct emails, whereas the first type aims at building a relationship with customers, while the second seeks to communicate a promotional message as a special offer, for example (Priyanka, 2012).
Figure 1 - Retail e-commerce sales as a share of retail trade in selected countries from 2014 to 2017 (Statista, 2018)
1.2 Problem Statement
“Email Marketing: email messages with the purpose of enhancing the relationship of a merchant with its current or previous customers, to encourage customer loyalty and repeat business, sending email messages with the purpose of acquiring new customers or convincing current customers to purchase something immediately, adding advertisements to email messages sent by other companies to their customer”
Priyanka S., 2012
The number of subscribers from the companies´ mailing lists declined, despite the increasing number of emails sent related to the growth of email marketing channel by businesses, that reached 30 billion during the year of 2017 (Marketing Land , 2018). As stated in the Background topic, email marketing channel overloaded, and it became harder for brands to communicate with customers. Nevertheless, this channel still holds a lot of unexplored potentials to offer as it is an excellent tool to build and sustain close relationships with consumers.
For the following reasons, to maximise email marketing channel performance and stand out from the remaining promotional emails sent, it is essential to consider the type of content used. For this end, a brand has to be able to identify and predict its customers´ needs and requests, as well as anticipate their reaction to different types of email campaigns: informative and price reduction offer messages (Wang, et al., 2016).
Consequently, the response from consumers to the different type of content present on emails may provide knowledge for companies to adjust and improve their e-marketing strategy and maximise their results.
Accordingly, so far there is very little research regarding the influence of the different types of email campaigns sent by firms on subscribers´ response. Email marketing is considered by some as dead, but is it? Businesses have to be willing to change and be evolved on the new tactics completely because subscribers are becoming more demanding and therefore are more unlikely to open an email unless there is a clear benefit assign to it (Samson, 2016). This dissertation attempts to fulfil this existing knowledge gap in the light of a single fashion retailer.
1.3 Purpose of Research
Online retailing increases rapidly and become globally more competitive than ever before. Hence, it is more challenging to retain customers and find the better way to engage with them (Fang, Qureshi, McCole, Ramsey, & Lim, 2014).
The purpose of the research to be carried is to evaluate the impact of the different type of email campaigns on online sales metrics, in the context of a fashion retailer.
Under those circumstances, this study provides the opportunity for this fashion retailer to better understand and adapt its e-commerce strategies, particularly in the email marketing context. By maximising its promotional activities impact and generate a higher return, to drive traffic to the website and accomplish sales.
Consequently, throughout this dissertation, two research questions should be answered, in the context of a fashion retailer:
RQ1: What is the relationship between the type of email campaign and the different response metrics?
RQ2: How do the different type of visitors to the website affect e-commerce revenues?
1.4 Scope
In the scope of this thesis, it was established contact with a fashion retailer brand, to collect data.
Lanidor is the largest Portuguese brand of women´s ready – to – wear retailer, holding three different concepts: LA Woman, LA Kids, and LA Loft. At the moment has a total of 156 stores spread over 11 different countries, even though it operates mainly in the Portuguese market. Additionally, the e-commerce platform of the brand accounted for 7,8% of the total volume of sales in 2017.
For this dissertation, the brand kindly provided access to its Google Analytics database, a web analytics service that gives the digital analytics tools needed to analyse data and get a deeper understanding of the customer experience (Google , 2018). This tool conceded a better understanding of the source of the traffic from website and detail information regarding visitors’ behaviour. Additionally, Lanidor also granted access to its email marketing database that stores more specific details on email campaigns.
In 2017, Lanidor accounted for a total of 1.197.618 visitors into their website. A vast majority of these users were women (87%), and 35,67% of the total number of visitors were between 35 and 44 years old. Besides, 86,49% of the traffic originated in Portugal and almost a quarter of this traffic begun in the region of Lisbon (23,06%) (appendix 1).
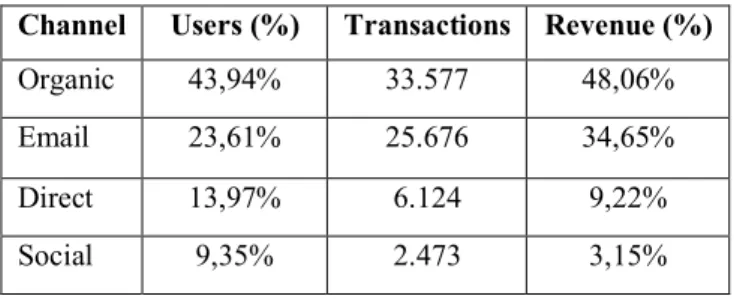
During the same period, the four main channels that generated higher traffic into the website were: organic (43,94%), email (23,61%), direct (13,97%) and social (9,35%). Indeed, almost half of the number of transactions during this year were originated through the organic channel (47,44%), while the email channel accounted for 36,24%. Together, these two channels were responsible for 82,71% of the total revenues from the website in 2017. In other words, it is notable that these two channels own an essential role in Lanidor´s e-commerce overall performance.
Despite the importance of the organic channel, email was chosen to conduct this analysis, mainly due to its relevance for the brand. Furthermore, email alongside with the social channel was the only from the "big four" that linked with the different kind of promotional campaigns. Nevertheless, as it was possible to observe, the social channel is not critical, as it did not generate a significant number of transactions and revenues (table 1). For this reason, the choice to pursue the analysis centred only on the email channel was conducted, to have a more accurate study.
It is important to highlight that all the decisions were made taking into consideration that the study aimed to analyse the effect of the different type of email campaigns on online sales. Accordingly, it was essential to do some screening work with the selected data, in order to keep the study consistent.
Table 1 - E-commerce channels: percentage of users, transactions, percentage of revenues in 2017 (Lanidor - Google Analytics, 2018)
Channel Users (%) Transactions Revenue (%)
Organic 43,94% 33.577 48,06%
Email 23,61% 25.676 34,65%
Direct 13,97% 6.124 9,22%
2 LITERATURE REVIEW
2.1 E-Commerce
Electronic commerce is an exchange that happens between two parties over some electronic medium, commonly the internet. These exchanges usually take the form of transactions that can be between companies and consumers (B2C), one company and another (B2B) or among individual consumers (C2C) (Electronic Commerce, n.d.).
E-commerce is an outgrowth of the internet that completely revolutionised the way of doing transactions and how businesses are handled in these days. Some positive points raised from this activity such as the opportunity to make a global choice, obtain more knowledge and compare offers from different suppliers, independently of their locations without taking a significant financial investment. On the other hand, it led to a higher dependence on ICT, culture and lack of legislation (Fernandes, 2014).
Some critical factors that might determine the success of e-commerce in a business context are the following:
Firstly, compelling design and content are fundamental to guarantee that the website is practical, usable and interactive (Lapoule, 2012). Identically, users highly appreciate quality signals such as providing realistic information concerning product (Lim, 2009) and it impacts the final decision to pursue a purchase (Xiaobing Yu, 2011). On the other hand, a monotonous online buying experience portrays a negative association with the brand (Robinson, 2007) and breaks the possibility to conclude a purchase.
Trust is another factor as the lack of confidence on the internet is one of the principal causes that might mislead consumers from buying online. The reason behind this is mainly due to issues linked to online payments security and companies´ reliability (Gefen, 2000).
Privacy is another concern as companies collect and aggregate customer data by tracking. Even though firms claim to do this process anonymously, the method is unclear (Economist, 2017). Furthermore, the lack of an existing privacy policy also pushes people away from buying online (Gefen, 2000).
In Michel Mandel´s own words, "Retail is going through an evolution, rather than a revolution (...)". As mentioned in the previous chapter, in the first quarter of 2017 e-commerce accounted for less than 9% of retail sales and it is relatively increasing one percentage point
annually (Mandel, 2017). In developed countries, outcomes arise from digitalisation phenomenon as some stable and well - known brands started to close some stores, is the case of Macy´s and Gap (Economist, 2017).
Nevertheless, good things also happen considering that the internet keeps pulling down trade barriers, envisioning a higher number of international e-commerce trades by gradually reducing distance-related trade costs. In fact, the gains behind this shift will happen first in developed countries and only in the long run, will extend for developing countries. Although this may be true, it is important to highlight that there is no correlation between the countries with the highest percentage of firms with websites and high engagement in e-commerce (Martin Falk, 2015).
2.2 Customer Journey
E-commerce is continuously changing and challenging marketers as the customers' mindset is constantly evolving. As an outcome, the marketing channel that represents buyers´ journey from the moment that awareness takes place to the actual purchase of the product changed dramatically. This model (appendix 3) used to be previously organised by awareness, interest, consideration, intent, evaluation, and purchase. Nevertheless, marketers divide this same model into three parts: lead generation, lead nurture and sales. Further detailed information regarding each stage is available on appendix 2 (Singh, 2017).
The significant difference from the old model to the new one, it that this new model evolved due to the relationship established between the customer and the firm, as it does not end with sales. This new model (appendix 4) is the improvement from the old one by "opening" the funnel after the conclusion of the purchase, creating new stages that focus on customer retention. Consequently, evidences the opportunity for brands to develop a relationship with the customer. Indeed, according to Harvard Business Review, this new segment is crucial as "profits rise as customers´ relationship with company lengthens (...)". The stages of this latest model are the following: awareness, consideration, conversion, loyalty, and advocacy (Willits, 2016).
2.3 Email Marketing
For this dissertation, the focus centres on email marketing that is one of the forms of direct marketing that resources electronic tools (Salehi M. , Mirzaei, Aghaei, & Abyari, 2012), with the purpose of communicating a commercial message to an audience. In an extended sense, it covers every email sent to a potential or existing customer (Vasudevan, 2010).
Indeed, email marketing is an excellent source of internet traffic ever since the beginning of e-commerce as well as an efficient tool commonly used by organisations (Vasudevan, 2010). Digital ad spending passed traditional TV in 2017 as expenditures reached $209 billion worldwide, which represents 41% of the market while TV advertisement felt short by 35% of the market. This growth happened since big TV advertisers shifted part of their budget over to digital. Nevertheless, TV ad spending still remains partially untouched (Recode, 2017).
In a business context, this tool holds different finalities such as enhance relationships with current customers, to encourage customer loyalty and repeat purchases. Moreover, it can aim to raise awareness, brand building, gain traffic to the website or to acquire new customers (Vasudevan, 2010).
This form of communication tends to succeed better in cases of permission-based emails belonging to a mailing list, as subscribers shown interest in receiving brand information. In fact, brand loyal users increase their volume of purchases when exposed to increasing advertisement. When organisations establish regular communication through email reinforces the loyalty of their email database since learning and settling positive experiences with a brand decreases the search for alternative options (Newman & Staelin, 1972). Therefore, it is imperative to keep in touch with clients on a regular basis, preferentially at a low-level cost (Merisavo & Raulas, 2004).
Furthermore, a study conducted by Email Tracking Report 2014 examined the reasons behind the customers signing up for email alerts (figure 3). Bellow, it is possible to see the most common causes:
• Discounts ($ off) • Like the brand
Figure 3 - Reasons to sign up for email (Email Tracking Report 2014)
Despite the fact that email marketing is one of the oldest digital media still in use, it is indeed a very influential tool for brands to reach out clients and engage with them. According to The Direct Marketing Association, in 2015 for every $1 spent on email marketing the average return was $38. This communication channel endured for being useful and capable of reaching target audiences. Table 2 presents the main strengths and weaknesses associated with email marketing channel.
Table 2 - Advantages and disadvantages of email marketing (Vasudevan, 2010)
Advantages Disadvantages • Easy – to – Track • Cost Effective • Scalable • SPAM • Undelivered Emails • Design Problems
2.3.1 SPAM Emails
Email is a cheap communication form (table 2) that encourages businesses to generate more contacts, but at the same time leads to an explosion of undesired communication, also known as SPAM emails. Indeed, unsolicited bunk emails reproduce a significant risk of lousy advertisement for companies as users start mistaking legitimate commercial email from SPAM, due to similar appearance between them both (Vasudevan, 2010). In a long-term perspective, SPAM emails threaten future acceptance by consumers to permission-based email marketing (Merisavo & Raulas, 2004).
2.3.2 Types of Email Marketing Promotional Campaign Messages
Email marketing campaigns intend to maintain a close relationship with current clients, encourage buyers´ loyalty, enrich the bond between the buyer and the seller, announce special offers and sales and invite clients for private events (Carmen & Nicolae, 2010).
Seven distinctive phases compose email marketing campaigns: determine the objectives of the campaign, develop a mailing list, the content, the landing page, test the content and the technology, sent the emails and the results obtained (Charlesworth, 2009).
Table 3 presents the different type of email marketing messages alongside with what differentiated them from one another.
Table 3 - Types of email marketing messages (Priyanka, 2012 & Kennedy, 2015)
Type Description
Press Release Focus on one message and is designed to inform readers about and entice them to visit the business online or in person.
Catalog Email Focus on images and short description with pricing. This form is similar to the content of hard copies catalogs.
Newsletter Email Inform customers about current promotions, sales, and newest offerings. It helps organisations to reach awareness.
Broadcasting Email
This type of email intends to communicate a promotional message. Transactional
Email newsletter model is a periodic message meant to develop a long-term relationship between the customer and the brand, in fact, accomplishes higher results when sent to loyal subscribers (Merisavo & Raulas, 2004). This kind of email is generally carried on permission-based to a group of people who share the common interest on product and business news (Sathish, et al., 2011). It proposes to engage subscribers by offering added – value to readers and are usually more personal and informative (Kennedy, 2015). Differently, broadcasting email intends to communicate a promotional message as an announcement of a special offer aiming to drive sales. The main difference between these two formats is that newsletter is meant to develop a relationship while broadcasting email is an immediate call-to-action from the subscribers (Carmen & Nicolae, 2010).
Altogether, it is important to highlight that companies should provide high – value content alongside with regular promotions to trigger subscribers interest and loyalty (Kennedy, 2015).
2.4 Metrics Used to Evaluate Email Marketing Performance
Indeed, email marketing is a powerful channel to produce revenue, this belief is shared by more than half of the marketers, according to BtoB Magazine. In like manner, it is also an impressively excellent tool to communicate with the customers and streamlines the path between sales and the marketing funnel (Hubspot, 2018).
Associated metrics compose email marketing funnel at each stage: delivery, Open Rate,
Click–to–Open Rate and Conversion Rate that will be further discussed (figure 4).
Additionally, marketing analytics is crucial as it helps companies to identify which tactics they should be addressing. It has several benefits associated such as:
• Identify what is working or not. • Find room for improvement.
• Improve marketing performance by implementing tactics that work.
ESP is an excellent example as it is an engine behind the email delivery machine by providing a platform that manages and segments a business mailing lists and sends and tracks campaigns on a larger scale (Total Send, s.d.). There are two methods adopted by organisations to handle the mailing list, the first option one is an in-house system and the second option is an outside provider. Both of them have pros and cons associated (appendix 5).
According to Vaughan, the company´s website is a crucial component as it is the hub for the digital marketing efforts. With this in mind, the designed content used has the objective of driving traffic to the website considering that is the smartest approach to convert visitors into leads and later on, advocates. In order to better assess email marketing performance, it is essential to consider the ongoing trend analysis of several key metrics. In other words, when comparing a campaign´s performance, an own internal benchmark should be carried, to better understand and evaluate the performance of the campaign itself within the company´s scope (Vaughan, 2012).
Delivery Rate is an instrument to verify when an email campaign succeeds or fails, since to
trigger engagement from the subscribers, the message needs to enter the inbox. Usually, for a campaign delivery rate to be considered successful, the rate should be superior to 95%. Hence, a decrease of this rate might reflect problems with the existing mailing list, for instance, invalid addresses and flagged subject lines will make the contents of the message to be confused with SPAM emails that consequently obstructs the emails from being delivered. (Vaughan, 2012).
Open Rate is another example of a metric used by marketers to measure the performance of
the campaigns. In reality, it is an inaccurate parameter as an email is only counted as "open" if the recipient receives the images embedded in the message and the majority of the email users have an image – blocking on their email client. The circumstances described above justify the classification of this metric as a weak one (Vaughan, 2012). Nevertheless, it can be used as a comparative metric, in case the two campaigns belong to the same mailing list since variables are reasonably controlled (Kolowich, 2018).
The Click – Through Rate (CTR) is the number of times any recipient clicks on any trackable link within the email (Todor, 2017). There are different ways to estimate this parameter: primarily, regarding the number of clicks done by the same recipient that can be classified as unique clicks or multiple clicks. Secondly, the denominator of the fraction, can be the total number of emails sent or the total number of emails open. It is important to emphasize that this is a commonly acceptable way to calculate the parameter. Under those circumstances, there might be different denomination for this parameter, for instance click – to – open rate or click rate.
Indeed, CTR is considered by some as a foundation piece for email marketing analytics since it specifies whether or not the message was compelling, and if the offer was attractive enough to encourage clicking. As a matter of fact, email newsletters usually have higher CTR when confronted with promotional messages and transactional messages. Thus, CTR is an excellent measure to benchmark through the different emails sent by a business (Vaughan, 2012).
Conversion Rate measures the campaigns´ effectiveness. When a campaign displays a
higher conversion rate, it suggests that there was a more relevant and appealing offer to the recipients. Accordingly, this measure is dependent on factors that go beyond the email message. The landing page is an example of this external factor. Thereupon, it highly suggests an excellent integration between the email platform and the web analytics. As an example, companies should create a single tracking URL´s for their email links to identify the source of the click from a specific email campaign (Vaughan, 2012).
Revenue Per Email Sent is a measure of the ROI of a particular email campaign. It is suited
for e-commerce marketers who generate some substantial direct sales from email campaigns. Similarly, this metric demands integration between ESP and web analytics (Vaughan, 2012). This parameter is the ideal measurement for e-commerce marketers who aim to generate direct sales from their email marketing campaigns. Usually revenue per email sent attains higher results when it includes some sort of discount or benefit for the email recipient, but also through triggered emails, that corresponds to email send based on a subscriber´s actions or information (Pitts & Brokaw, 2017).
Delivery Rate, Open Rate and CTR benchmark values were retrieved from a report
developed by Sign-Up.to platform that analysed billions of emails sent between the January 1st and December 31th from a range of SME and enterprise organisations and public-sector departments. Given the scope of this study, the value used as benchmark addresses fashion
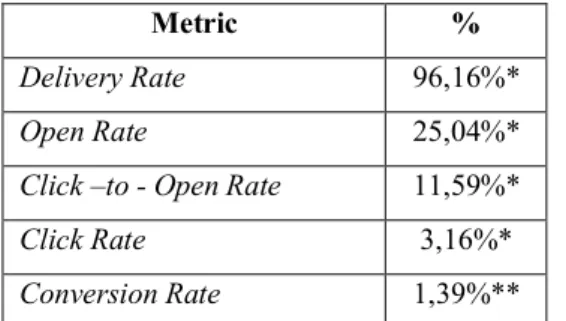
sector category. A second benchmark report was used to cover the Conversion Rate parameter, since the first one did not provide this information. The report belongs to Wolfgang´s Digital and considers the statistics from e-commerce website during the preceding twelve months of 2017. Moreover, given the scope of this thesis, retail sector benchmark value is the one that better addresses the topic covered in this dissertation. Table 4 illustrates the benchmarks values for previously mentioned metrics. Unfortunately, it was not possible to find a reliable benchmark value for Revenue Per Email Sent since it is not as used metric as the remaining parameters.
Table 4 - Benchmarks results from 2017 (SignUpTo, 2017 & Coleman, 2017)
Metric %
Delivery Rate 96,16%*
Open Rate 25,04%*
Click –to - Open Rate 11,59%*
Click Rate 3,16%*
Conversion Rate 1,39%**
* Benchmark results from fashion sector 2017 (SignUpTo, 2017) ** Benchmark result from retail sector 2017 (Coleman, 2017)
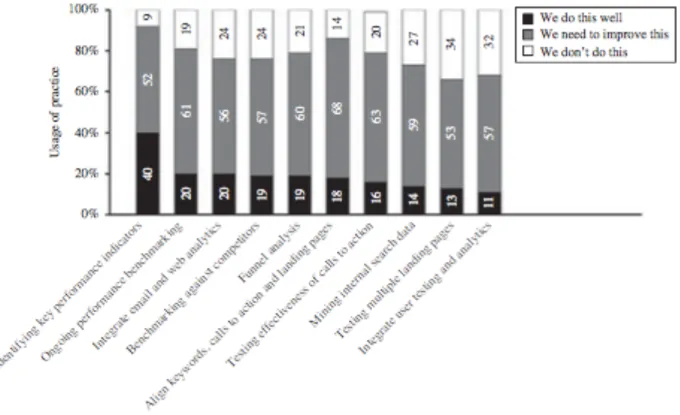
Econsultancy – RedEye report analyses how companies rated the way they conducted web analytics. Given figure 5, the majority of the companies felt that there was still room for improvement regarding their analytical activities (Chaffey & Patron, 2012).
Figure 5 - Usage of alternative digital analytics practices (Chaffey & Patron, 2012)
2.5 Summary and Main Hypotheses
The B2C online shopping is one of the fastest sectors growing in the world´s economy, hence the development of a robust digital marketing presence is essential for business, despite the fact that if companies are only present in offline channels. Indeed, customers feel encouraged to purchase when exposed to several channels (online and offline).
Given that, new opportunities arise giving a chance for businesses to be creative and engage their audience. At the same time, it also makes it more challenging to stand out from the competition (Big Commerce, 2018).
For Lanidor, the online shopping became a complementary platform to their store network ever since 2007. According to the brand, in the beginning, Lanidor´s website started to appeal to the busier loyal customers (LA Card holders) and in 2013 more than 50% of their customer base had completed a purchase in their website. The e-commerce platform represents the best option for the brand to internationalise as it does not require the massive investment when compared with a physical store (Pago, 2013). Moreover, LA Card holders´ benefit from exclusive online discounts and customers tend to enjoy the online experience. Namely, the ones
who were already clients buy more often, particularly online and the ones who are buying for the first time tend to repeat the experience (Pago, 2013).
Email marketing is an excellent tool for companies to communicate with their customer base, in particular, Lanidor recognised that opportunity and nowadays holds a mailing list over of 240000 active clients. The brand sends different types of emails from broadcast emails to newsletters to their audience, the latter usually is more common and is sent twice a week.
It is important to highlight that segmenting the mailing lists helps businesses to attain higher results (Mail Chimp, s.d.). Lanidor already adopted in the past this practice and it confirms the improvement of results.
In the context of this analysis, several points need further clarification: the brand uses an in-house system since it is more useful as the company belongs to a larger group that owns other brands and can create some synergies. Secondly, despite the downsides associated with Open
Rate metric, it makes sense to use it in the context of this dissertation as email campaigns will
be compared given the different time frames. Lastly, regarding the CTR metric, the multiple click approach method is the chosen one given the data provided for the study.
Furthermore, this analysis considered two types of email campaigns: price reduction and informative, that belong to the category of a newsletter, earlier explained. Appendixes 6 and 7 illustrate an example from each type from campaigns taken into consideration for this study.
In chapter 1, two research questions were formulated: “What is the relationship between
the type of email campaign and the different response metrics?” and “How do the different type of visitors to the website affect e-commerce revenues?”. Concerning the first research question,
as seen in this same chapter, past studies in the field suggested that email campaigns with a price reduction associated generate higher amount of transactions, while email campaigns with informative content are more likely of driving more traffic (Merisavo & Raulas, 2004). Since this generalization is very subjective and may not portrait the reality of every single firm, the following hypotheses were developed to test if the same happens in Lanidor´s context.
The primary purpose of these two hypotheses is to provide the brand with reliable and useful information about its email marketing channel performance. By assessing the response from the website users´ to the different type of content - informative or price reduction - used in the email campaigns, attending the different communication goals set by Lanidor as increase sales and raise awareness. Under those circumstances, Lanidor has the opportunity to better understand and adapt its strategies, but also the type of content released through the email
channel, in order to maximise its performance, by adjusting the content delivered to its mailing list. The hypotheses are the following:
o Hypothesis 1: Informative email campaigns drive more traffic than price reduction email campaigns.
o Hypothesis 2: Informative email campaigns generate a higher amount of conversions than price reduction email campaigns.
Regarding the second research question, the information provided by the e-commerce Director and the literature indicated that loyal customers or customers who already interacted with the brand are more likely to attain higher results (Merisavo & Raulas, 2004 & Pago, 2013). Consequently, the following two hypotheses were drawn to attest if the same happened with Lanidor, by assessing how users who already interacted with the brand in the past respond to the different type of email campaigns – price reduction and informative. Additionally, it expects to provide a greater insight for the company about the returning visitors into the website and how these last ones are affected by the type of content delivered through the email marketing channel. By assessing the website users’ sensitiveness to the different kind of email campaigns the brand has the opportunity to adapt the type of content released through the email channel to its different objectives. The hypotheses are the following:
o Hypothesis 3: Returning visitors attracted to the website by price reduction email campaigns generate a higher volume of revenues than returning visitors attracted to the website by informative email campaigns, and new visitors attracted to the website by either price reduction or informative email campaigns.
o Hypothesis 4: Returning visitors generate a higher volume of revenues when compared to new visitors to the website.
3 METHODOLOGY
3.1 Research Approach
This thesis relies mainly on the analysis of primary data that can be described as data collected for a specific research problem, by selecting the procedures that better suit to the research problem (Hox & Boeiji, 2005). This classification befitted as the company is the one responsible for collecting data. Moreover, this study also depends on some secondary data that includes data obtained by other researchers or for other purposes than the studied research (Hox & Boeiji, 2005). In this case, benchmark studies used for comparison purposes addressed in the previous chapter.
This dissertation follows a quantitative case study research method primarily due to its strategic way of collecting data and information. It seems the natural selection as it enables the researcher to examine the data within a specific context closely. Besides, since the subject of study of this thesis has a limited number of individuals and small geographical areas and "investigate real-life phenomenon through detailed contextual analysis of a limited number of events or conditions and their relationships" (Zainal, 2007).
The research design supports two distinctive classifications. On the one hand, can be as single – case or multiple – case. On the other hand, can be holistic or embedded (Yin, 1984), appendix 8 provides further detailed information regarding these classifications. However, in the context of this analysis, a single – case and holistic design are the classifications that suit better since the study relies on the results of a single company and examines only the global nature of an organisation.
Moreover, a case study research approach can fall into three distinct categories: descriptive, explanatory and exploratory (Yin, 1984). With this in mind, to answer the proposed research questions in chapter 1 and to accomplish the propose of this study a descriptive and explanatory research approach suited the best given the data available. The descriptive approach consists of examining a situation and its current state, but also in identifying the attributes of a particular phenomenon based on an observational basis (Williams, 2007). In what concerns the explanatory approach, it attempts to establish some causal relationships among variables usually by resorting to quantitative data analysis (Saunders, Lewis, & Thornhill, 2009).
3.2 Data Collection
Starting by defining the population of this dissertation, one may say that it includes all customers from Lanidor present in its email database and who has visited its website.
As mention earlier Lanidor is a fashion retailer that operates both in online and offline channels. For this analysis, only online channels were taken into consideration, particularly email channel. The company gently provided the data for the study of this dissertation, more specifically to two of its platforms: Google Analytics and in-house email database. Additionally, it showed availability to provide further information to complement this study.
After presenting the idea of this thesis to the person responsible for Lanidor´s e-commerce, he advised that it would be a good decision to consider the month of October because of its neutrality. This month is considered neutral due to the absence of special events such as the launching of the new collection or Black Friday sales that might influence the outcome, since customers tend to change their behaviour in these situations.
As explained in chapter 1, the purpose of this dissertation is to study the influence of the two different types of email campaigns, informative and price reduction. For this end, it was possible to notice that email campaigns with a price reduction content associated were frequent for the brand. Consequently, to proceed with the analysis, some mutual weekdays were found (Tuesdays and Wednesdays) during the first two weeks of October, where the emails sent to the clients were not price reduction email campaigns.
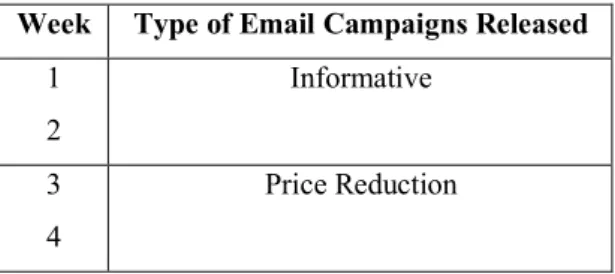
For the stated motives, the four weeks of October were elected to conduct this study with data obtained from the same days of the week. Hereafter, the following classification took place: considering the month of October, the first two weeks of the month would represent the email campaigns with informative content, and the last two would have a price reduction content associated. Table 5 helps to conceive this classification better.
Table 5 - Type of email campaigns
Week Type of Email Campaigns Released
1 2 Informative 3 4 Price Reduction
For simplicity reasons of writing and understanding, the weeks with price reduction email campaigns will be designated only by price reduction email campaigns and the weeks with informative email campaigns over informative email campaigns.
Moreover, it is also important to remark that the company is continuously segmenting the email campaigns released to its mailing list. According to the e-commerce Director there is not a specific rule nor a pattern for segmenting neither for the type of emails released. In fact, most of the times those type of decisions rely on instructions released by the administration, depending on the company´s needs and strategy.
The Director mentioned as well that some of the visits to the website were generated by past emails, which later on was verified by the data extracted in Google Analytics platform. Only the observations from email campaigns sent within those same days were considered aiming to isolate the effect from the considered email campaigns during the earlier explained study period.
The two platforms used to collect data were: Google Analytics and email marketing database. As indicated in chapter 1, Google Analytics is a web analytics platform that tracks and reports website traffic (Google , 2018). It specifies a diverse type of information such as users source, campaigns, revenues, user type and some demographic information such as geographical position. As mentioned in the literature review chapter, Lanidor uses an in-house email base system that provides detailed information of the email campaigns released and uses different metrics to measure performance.
This last platform presented a limitation for the study as it only allowed to extract the overall impact of the email campaigns considering the given metrics. This constraint might create a noise in the study as the data retrieved in Google Analytics platform measures the effect of the email campaigns in the stated days and not as a whole. However, as the majority of the conversions take place during the days that the emails were released, as it is possible to confirm on appendix 9, the decision to continue the study as it is, was taken since it did not affect the results meaningfully.
As mentioned earlier two different platforms were used for this analyse Google Analytics and an email marketing database. For the first platform, the following information was extracted: revenues, user type and campaigns. While to support the analyse the information extracted from the second platform was: emails sent, emails open, emails clicked, transactions
and revenues. Additionally, some of these variables needed additional adjustment to better fit within the context of the study as it will be posterior explained in detail.
3.3 Data Analysis
Considering the literature along with the information provided by the Director, some hypotheses were developed in order to shape the analysis of data collected.
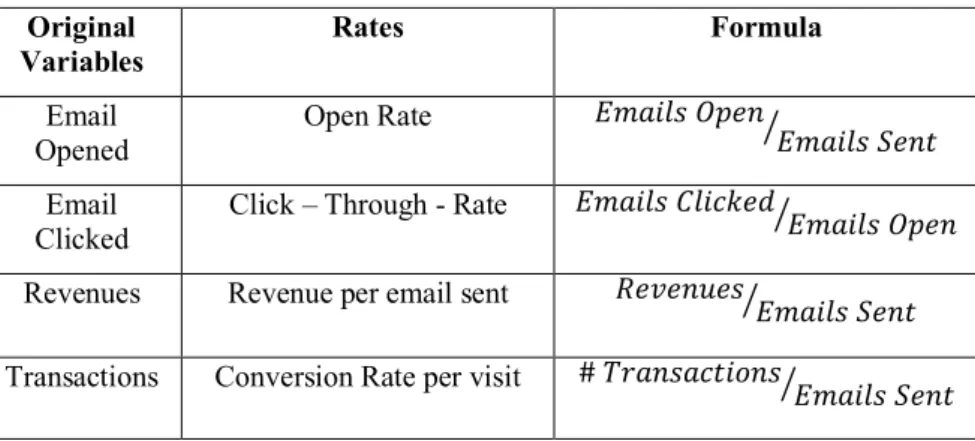
In what concerns the first research question, descriptive statistical analyses with data extracted from the email marketing database took place. For this purpose, some rates were estimated, to perceive the impact on the different kind of email campaigns. Table 6 illustrates the formulas used to calculate the distinct parameters. Lastly, some Welch - Satterthwaite correction were employed to examine if the means difference between the unrelated groups were statistically significant.
Table 6 – Online metrics formulas
Original
Variables Rates Formula
Email Opened
Open Rate !"#$%& ()*+
!"#$%& ,*+-.
Clicked Click – Through - Rate
!"#$%& /%$01*2
!"#$%& ()*+ .
Revenues Revenue per email sent 3*4*+5*&
!"#$%& ,*+-.
Transactions Conversion Rate per visit # 78#+�-$9+&.
!"#$%& ,*+-Regarding the second research question, the data from the Google Analytics was extracted to an Excel file with input from the study days from October. Straightaway, it was necessary to clean the dataset to assure that the purpose of the study maintain its accuracy, clarified earlier in Data Collection subchapter. New variables were created based on the pre-existent variables from Google Analytics, as it is possible to confirm through table 7, and converted into dummies to better address this research question.
Table 7 - Description of the dummy variables
Variables Dummy
User Type Returning Visitors 1 New Visitors 0 Campaigns Price Reduction Email Campaigns 1
Informative Email Campaigns 0 Transaction Yes 1 No 0
Later on, after computing the data into SPSS (which is a platform that offers advanced statistical analysis (IBM, 2018)) some crosstabs analyses were performed to understand the variables better. Subsequently, an interaction between returning visitors and week with price reduction campaigns was created to measure the effect of this new independent variable on revenues.
With this in mind, an OLS multivariate linear regression analysis was conducted to calculate the effect on revenues of the created dummies: returning visitors, price reduction email campaigns and the interaction between these two preceding variables (table 8). Ultimately, Welch - Satterthwaite corrections were employed to check the individual effect of the independent variables on revenues.
Table 8 - Dependent and independent variables for regression model
Regression Analysis
Dependent Variable
Independent Variables
Revenues (€) Returning Visitors
Price Reduction Email Campaigns
Returning Visitors * Price Reduction Email Campaigns
All in all, it is important to highlight that all the statistical tests conducted assumed a 10% significance level.
4 ANALYSIS OF RESULTS
4.1 RQ1: What is the relationship between the type of email campaign and the different response metrics?
In the meantime, to tackle this research question, the information provided by the email marketing database was taken into consideration. The metrics used to investigate this question were Open Rate, CTR, Conversion Rate and Revenue per Email Sent. This data accounted for a total of seven observations, which correspond to the cumulative values of the emails released from the seven email campaigns considered for this dissertation (table 9).
There are two primary objectives behind the email campaigns considered for this study which are to generate traffic and to drive sales. Given the available metrics on this dissertation,
Open Rate and the CTR were the parameters preferred, as they were the ones that better address
the intention of raising awareness, in other words, to weight the traffic generated to the website that is linked with first goal. Regarding the second goal, Conversion Rate and Revenue per
Email Sent metrics were the ones that best suit when the objective was to understand how the
different email campaigns influence sales conversion.
In the company´s interest, the information retrieved from this analysis provides a more complete insight of the type of content delivered through the email campaigns attending the different intentions behind the strategy followed by the company for its e-commerce channel.
4.1.1 Descriptive Statistics Analyses
Tables 9 – 13 present the results obtained from the descriptive analyses from the data, including the cumulative values of the email campaigns divided into two types of email campaigns.
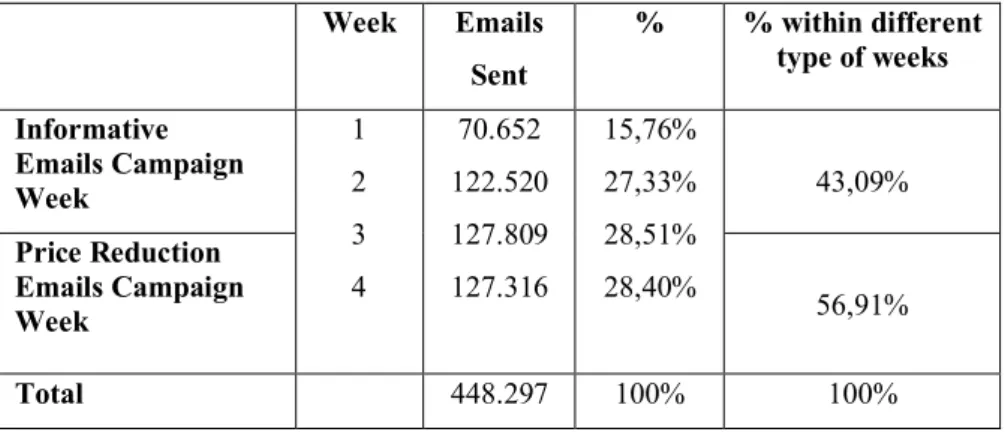
Regarding the Open Rate metric, table 10 shows that there is a much higher percentage of emails opened when there is a price reduction email campaign and the same happens with the Open Rate parameter. Meaning that price reduction email campaigns generate a higher response from users when compared with the other type. However, according to the literature, this result was expected (Wiener, 2017).
Table 9 - Emails sent per Week Week Emails Sent % % within different type of weeks Informative Emails Campaign Week 1 2 3 4 70.652 122.520 127.809 127.316 15,76% 27,33% 28,51% 28,40% 43,09% Price Reduction Emails Campaign Week 56,91% Total 448.297 100% 100%
Table 10 – Number and Percentage of emails open and open rate in the studied period
Week Number Emails Open % % within different type of weeks Open Rate % within different type of weeks Informative Email Campaigns 1 2 3 4 10.866 20.007 23.427 23.668 13,94% 25,67% 30,05% 30,34% 39,60% 15,38% 16,33% 18,33% 18,59% 15,98% Price Reduction Emails Campaigns 60,40% 18,46% Total 77.969 100% 100% - -
In what concerns, CTR metric, similarly to Open Rate metric, there is a significantly higher amount of emails clicked linked with price reduction email campaigns (table 11). Though is also essential to mention that the number of emails sent during this period is similarly higher (table 9). Under those circumstances, the CTR metric indicates the same outcome, price reduction email campaigns generate better results. However, the difference between the two type of email campaigns is not substantial. This result is contrary to the information available on the subchapter Metrics Used to Evaluate Email Marketing Performance of the literature review, which states that informative emails has higher CTR when compared with promotional messages. In the context of this analysis, it corresponds to price reduction email campaigns (Vaughan, 2012). Generally speaking, a possible explanation for this difference is because the study focuses on one single company that does not represent the overall result.
Table 11 – Number and Percentage of email clicked and click – through – rate in the studied period
The values from table 12 present the results associated with Conversion Rate metric that indicates that there is a higher percentage of conversions linked with informative email campaigns. However, it is important to notice that the difference between these two types of email campaigns is tiny, therefore not significant enough, additional tests will verify this statement in a while. Additionally, it is also interesting that during the first week of this analysis the conversion rate is substantially superior when compared with the remaining weeks. According to the literature review, this result is contradictory as price reduction email campaigns have the aim of stimulating sales. Hence it is possible to conclude that the
Conversion Rate value should be higher for these types of emails (Carmen & Nicolae, 2010).
However, according to Vaughan, this measure is also dependent on other factors besides the kind of email message.
Table 12 – Number of Transactions and Conversion rate during the studied period
Week Transactions Conversion Rate in total emails sent % within different type of weeks Informative Email Campaigns 1 2 3 4 32 21 35 32 0,045% 0,017% 0,027% 0,025% 0,027% Price Reduction Email Campaigns 0,026%
Lastly, table 13 presents Revenue per Email Sent metric that equally to Conversion Rate metric demonstrates that in the weeks with informative email campaigns possess higher values. According to the literature, price discounts and other incentives to the recipient triggers Revenue
Week Number Emails Clicked % % within different type of weeks CTR
Rate different type of % within weeks Informative Email Campaigns 1 2 3 4 1.355 2.409 3.519 3.065 13,10% 23,28% 34,01% 29,62% 36,37% 12,47% 12,04% 15,02% 12,95% 12,19% Price Reduction Email Campaigns 63,63% 13,98% Total 10.348 100% 100% - -
Per Email Sent (Pitts & Brokaw, 2017). This outcome goes in the opposite direction with what
is mentioned by the literature.
Table 13 – Revenues and Revenue per Email Sent during the studied period
4.1.2 Welch - Satterthwaite Correction
Welch - Satterthwaite correction was conducted for the three independent variables as an alternative to the Independent Samples T-Test as it violated normality of the dependent variable and homogeneity of variance assumptions (appendixes 12 & 14).
Table 14 presents the results for the different metrics. The null hypothesis is similar for the three variables, and it is the following:
H0: u1 = u2
Table 14 - Welch – Satterthwaite correction
Variables Adjusted F Ratio Significance (r) df1 df2 Open Rate 6,910 0,051 1 4,607 CTR 1,587 0,305 1 2,719 Conversion Rate 0,410 0,550 1 4,969
Revenue per email sent 0,010 0,925 1 4,223
Regarding the Open Rate variable, the null hypothesis indicates that the Open Rate means for informative email campaigns is different for price reduction email campaigns. According to Welch - Satterthwaite correction, the significant value is lower than 0,1 (r<0,1), hence it is possible to assume that the groups' means are significantly different from the other. By looking to the Open Rates from the different kind of email campaigns, present in table 10, it is possible to witness that the Open Rate is higher for price reduction email campaigns.
Week Revenues Revenue per email sent (RPES) RPES in the different type of weeks Informative Email Campaigns 1 2 3 4 2.543,46€ 1.715,27€ 2.172,76€ 1.091,95€ 0,036€ 0,014€ 0,017€ 0,010€ 0,020€ Price Reduction Email Campaign 0,013€
Therefore, one can conclude that the Open Rate would be statistically significantly higher using price reduction email campaigns (table 14).
Considering, CTR metric the null hypothesis refers that the CTR mean for informative email campaigns is the same for price reduction email campaigns. Concerning Welch - Satterthwaite correction, the significance value is higher than 0,1 (r>0,1). Thus, one can undertake that the groups´ mean is not significantly different. Consequently, taking into consideration table 11 the resolution that CTR is higher for price reduction email campaigns, even though the difference between the means is not statistically significant (table 14).
In what concerns Conversion Rate, the null hypothesis states that the Conversion Rate means for informative email campaigns is the same for price reduction email campaigns. Regarding Welch - Satterthwaite correction, the significance value is higher than 0,1 (r>0,1), one can assume that the means are very similar. Table 12 shows that the difference is very tiny between these two types of email campaigns and therefore, not significant. Nonetheless, the
Conversion Rate is slightly higher for informative email campaigns, though the difference is
not statistically significant enough (table 14).
Lastly, Revenue per Email Sent metric null hypothesis considers that the Revenue per
Email Sent mean for informative email campaigns is the same for price reduction email
campaigns. Taking into account Welch - Satterthwaite correction, the significance value is higher than 0,1 (r>0,1), one can assume that the variances are similar for both groups. Table 13 illustrates that there is a small irrelevant difference between these two types of campaigns. However, Revenue per Email Sent is still slightly higher for informative email campaigns, though not statistically significant enough (table 14).
4.2 RQ2: How do the different type of visitors to the website affect e-commerce revenues?
Google Analytics platform was used to address this research question. The previous chapter presented the metrics considered for this analysis (table 8). The sample accounted for a total of 4.367 observations which represent each individual/user that access to Lanidor´s website during the studied period.
In the company´s scope, the information obtained through this research question will provide a complete insight of the returning visitors´ behaviour on the website, that have
assessed the website through the email channel. By understanding the effect of a preceding interaction with the brand´s website or an existing relationship with the brand on the response to the different type of email campaigns, it provides a chance for the company to readjust its e-commerce strategy and strive to maximise its performance and attain higher results by creating and delivering more captivating content to its subscribers, but also by accomplish a higher number of sales. Therefore, it is essential to understand the weight of these visitors on the website, but also on online revenues to adapt the type of content that trigger them better.
4.2.1 Multivariate Linear Regression Analysis
Model: : =b<+b>?>+b@?@+bA?>?@+ BC
This model is calculated through an OLS estimation method, since it has the objective to analyse the statistical significance from the different variables, taking into consideration a 10% significance level. According to the p-value rule:
H0: bD = < à statistically not significant, therefore the variable i does not explain the behaviour of the dependent variable. It happens when P – Value > a à Do not reject H0
H1: bD ≠ < à statistically significant, therefore the variable i explains the behaviour of the dependent variable. It happens when P-Value < a à Reject H0
In effect, the variables X1 corresponds to the “returning visitors” dummy variable, X2 to the dummy variable of “price reduction email campaign” and the X1X2 to the intersection from these last two variables, X1 and X2. With this is mind, table 7 explains in detail the different dummies. Lastly, the dependent variable consider for this regression refers to the value of the revenues from Lanidor´s website through the email marketing channel during the studied period.
Table 15 resumes the quality of the indicators of the regression analysis conducted. It is possible to observe that the model does not possess a good explanatory power as the adjusted R – Square is equal to 0,4%, meaning that the independent variables are not the best predictors of the dependent one. However, since this result does not interfere with the results obtained from the coefficients table (table 15) which assess whether the predictors are statistically significant and the mathematical relationship between the independent variables and the dependent one.