Barriers and perspectives for electric power generation out of
photovoltaic solar panels in the brazilian energy matrix
Georges Naguib Girgis Elgamal1, Jacques Demajorovic2
1 Master in Business Administration – Centro Universitário da FEI – São Paulo, SP – Brazil.georges.naguib@uol.com.br 2 PhD in Education – Centro Universitário da FEI – São Paulo, SP – Brazil. jacquesd@fei.edu.br
Cite as:
Elgamal, G. N. G., & Demajorovic, J. (2020). Barriers and perspectives for electric power generation out of photovoltaic solar panels in the brazilian energy matrix.J. Environ. Manag. & Sust., 9(1), 1-26, e17157. https://doi.org/10.5585/geas.v19i1.17157.
Abstract
Research Objective: This research aims to identify issues and opportunities for the expansion of electric power generation with large-scale photovoltaic solar cells in Brazil.
Methodology/approach: The methodology includes in-depth interviews with multiplestakeholders, including industry, public sector, academia, and Non-Governmental Organizations representatives. Originality/Relevance: Despite the progress in public policies to incorporate new measures to foster photovoltaic solar energy use, results are still quite insignificant. Therefore the main contribution of this research is to help to understand the main reasons for the low level of participation in photovoltaic solar energy use in the Brazilian energy matrix.
Main results: A favorable mix of public policies, including subsidies and financing, were fundamental for solar energy growth in the countries studied. In Brazil, however, public policy is fragmented and incomplete, as financing mechanisms and long-term low interest rates for manufacturers, investors and consumers are lacking in order to significantly expand the use of this alternative.
Theoretica/Metodological contributions: The absence of strategic vision from the government and the business sector hinders seizing solar energy use in Brazil preventing the country from the benefits associated to its comparative advantages in this segment.
Conclusion: Among the opportunities missed by the country stand out the jobs generated in the production chain and its contribution to social inclusion and reduction of environmental impacts when compared to traditional systems of power generation.
Keywords: Photovoltaic Energy. Tax incentives. Public policies.
As barreiras e perspectivas para geração de energia elétrica por painéis solares fotovoltaicos na matriz energética brasileira
Resumo
Objetivo do estudo: esta pesquisa tem como objetivo identificar os desafios e as oportunidades para a expansão da geração de energia elétrica por células solares fotovoltaicas em larga escala no Brasil. Metodologia/abordagem: a metodologia inclui entrevistas em profundidade com múltiplos
stakeholders, incluindo representantes das indústrias, do setor público, academia e organizações não
governamentais.
Originalidade/Relevância: Apesar do progresso nas políticas públicas para incorporar novas medidas para fomentar o uso de energia solar fotovoltaica, os resultados ainda são bastante reduzidos. Portanto,
a principal contribuição desta pesquisa é ajudar a compreender as principais razões para o baixo nível de participação no uso de energia solar fotovoltaica na matriz energética brasileira.
Principais resultados: uma combinação favorável de políticas públicas, incluindo subsídios e financiamentos, foi fundamental para o crescimento da energia solar nos países estudados. No Brasil, no entanto, as políticas públicas são fragmentadas e incompletas, pois os mecanismos de financiamento e as baixas taxas de juros de longo prazo para os fabricantes, investidores e consumidores são insuficientes para ampliar significativamente o uso dessa alternativa.
Contribuições teóricas/metodológicas: a ausência de uma visão estratégica do governo e do setor empresarial dificulta a expansão do uso de energia solar no Brasil, impedindo que o país se beneficie de suas vantagens comparativas neste segmento.
Conclusão: Entre as oportunidades perdidas pelo país destacam-se os empregos gerados na cadeia produtiva e sua contribuição para a inclusão social e a redução de impactos ambientais quando
comparados aos sistemas tradicionais de geração de energia.
Palavras-chave: Energia fotovoltaica. Incentivos fiscais. Políticas públicas.
Barreras y perspectivas para la generación de energía eléctrica por paneles fotovoltaicos solares en la matriz de energía brasileña
Resumen
Objetivo del estudio: esta investigación tiene como objectivo identificar los retos y oportunidades para la expansión de la generación de electricidad por células solares fotovoltaicas a gran escala en Brasil. Metodología/Enfoque: la metodología incluye entrevistas en profundidad con múltiples partes interesadas, incluyendo representantes de industrias, el sector público, acdêmicosy organizaciones no gubernamentales.
Originalidad/relevancia: Apesar de los avances en las políticas públicas para incorporar nuevas medidas para fomentar el uso de la energía solar fotovoltaica, los resultados siguen siendo bastante bajos. Por lo tanto, la principal contribución de esta investigación es ayudar a entender las principales razones del bajo nivel de participación en el uso de energía solar fotovoltaica en la matriz energética brasileña.
Principales resultados: una combinación favorable de políticas públicas, incluyendo subsidios y financiamiento, fue fundamental para el crecimiento de la energía solar en los países estudiados. En Brasil, sin embargo, las políticas públicas están fragmentadas y incompletas, porque los mecanismos de financiamiento y las bajas tasas de interés a largo plazo para los fabricantes, inversionistas y consumidores son insuficientes para aumentar
el uso de esa alternativa.
Contribuciones teóricas/metodológicas: la falta de una visión estratégica del Gobierno y del sector empresarial dificulta la expansión del uso de la energía solar en Brasil, impidiendo que el país se beneficie de sus ventajas comparativas en este segmento.
Conclusión: Entre las oportunidades perdidas por el Pais destacam-se los puestos de trabajo generados en la cadena de producción y su contribución a la inclusión social y la reducción de los impactos ambientales en comparación con los sistemas tradicionales de generación de energía. Palabras-clave: Energía fotovoltaica. Incentivos fiscales. Políticas públicas.
Introduction
The growth of the renewable energy sector on the world stage is the result of government policies that seek to reduce CO2 emissions and energy security (IEA, 2012). The growth of photovoltaic solar cell power generation in several countries in recent years has been supported by public support policies through financial incentives, such as low interest loans, investment support for factories and tax reduction on equipment purchases (Grau, Huo & Neuhoff, 2012; Tmilsina, Kurdgelashvili & Narbel, 2012). Government support policies also gain importance through R&D program funding lines (Chowdhury et al., 2014; Grau, Huo & Neuhoff, 2012) and differentiated tariff systems like FIT and net metering (Cucchiella & D’adamo, 2012; Schaffer & Bernauer, 2014). As a result, installed solar photovoltaic capacity grew rapidly from 2009, jumping from 23 GW to 177 GW in 2014, with Germany, the United States, Japan, Italy and China represent 71.33% of total installed capacity in 2014 (Li & Lin, 2013, REN21, 2015). In 2017, total global installed capacity reached 402.5 GW, (IEA, 2018). In this case, the 5 leading countries continue to represent a significant portion of world production, even with slight reduction, registering 67.82% of total installed capacity in 2017 (IEA, 2018). Although France, Spain, UK, Australia and India complete the other share of the ten countries in the world ranking of installations of this power source, they make up only 12.86% of the total installations (IEA, 2018).
In this scenario, Brazil presents itself as a paradox. With its extensive area of 8.5 million km2 and much more favorable weather conditions than the leading photovoltaic countries, this alternative was not even considered in the Energy Production Report – EPE (2014). Current data show that photovoltaic energy represents only 0.93% of the country's total energy matrix, occupying the second to last position among the 8 main sources of power generation (ANEEL, 2018a). Regarding the electricity generation projects under construction, investments in solar energy represent about 7.4% of the total (ANEEL, 2018a). Still, even considering the completion of all projects, according to Aneel data (2018), both those under construction and those that have not yet begun construction, the increase in terms of additional capacity will be of 2.219.195 kW, which in the future would represent 1.97% of the country’s power generation capacity (ANEEL, 2018a). The expansion of this energy source in Brazil can bring countless contributions, including energy supply to rural and riverine populations distant from the electricity distribution networks, job creation and the development of advanced technology hubs in the country (ABINEE, 2012). In this context, the research question of this paper is: what are the factors that explain the low representation of photovoltaic solar energy in the Brazilian energy matrix? To this end, the central objective of the research is to identify the challenges and opportunities for the expansion of large-scale photovoltaic solar cell power
generation in Brazil. The methodology favors interviews with multiple stakeholders involved in the theme.
The evolution of photovoltaic power generation in developed and developing countries
This section will present the main characteristics of the incentive models for the adoption of photovoltaic energy.
The United States
With investments from the 1980s, the United States was one of the first countries to invest in large-scale solar photovoltaic technology. The US solar market growth is due to a favorable mix of public policies based on the Solar America Initiative project, in order to make this energy source more competitive (Timilsina; Kurdgelashvili & Narbel, 2012). The initiative, besides guaranteeing resources in research and development (R&D), adopts other mechanisms to stimulate: differentiated financing for the purchase of equipment; discount-based direct transfers, loans may cover up to 50% of the value of the facility; incentives for building tax deduction and discount or elimination of fees for photovoltaic systems. It is also included the net metering system that enables a portion of the unused energy to be used by the concessionaire and credited for future consumption (EPE, 2012; ABINEE, 2012).
The United States stood out on the world stage for developing a new business model for this energy source, termed as the third-party owner of photovoltaic solar generation system. The third owner is responsible for the installation, maintaining ownership of the photovoltaic solar system on the customer’s property, being compensated for the sale of energy generated by the system to the client himself. Its advantage is ensuring customer access to system power without the acquisition, maintenance and operating costs (Seel; Barbose & Wiser, 2014, Kollins; Speer & Cory, 2010).
According to GTM Research and Solar Energy Industries Association report, (2015), the stability of the policy and regulation for photovoltaic solar energy was essential to ensure its growth by generating investment resources and create an appropriate scenario for long-term industry planning. Thus, an innovation chain was structured that includes technological improvements of equipment, expansion of generation plants and new business modalities. Production costs and sales prices of solar modules and their peripheral equipment fell significantly in 2014, with an average annual reduction of approximately 10% being estimated. This ensured an expansion of installed capacity from 2002 to 2014 from 28 MW to 18,317, which, however, represents 0.61% of total electricity consumption (IEA, 2012, IEA, 2015). The United States, from 2014 to 2017, was the second fastest growing country in terms of absolute power generation, surpassing Japan, with a total installed capacity of 51 GW (IEA, 2018). Even
so, its share in the energy matrix registered only 0.66% of total electricity consumptio. (EIA, 2018).
Germany
Jacobsson and Lauber (2006) argue that the movement of public opinion in the second half of the 1980s made the big difference with German parliamentarians for changes in the energy matrix that is heavily dependent on nuclear and coal. In this context, the Chernobyl disaster in 1986 and the politicization of climate change debates stand out. From 1991 to 1995, under the Electricity Feed-in Act, the first policy established for the renewable generation of electricity from photovoltaic cells, the program “1,000 Solar Roofs Initiative” started and was repeated from 1999 to 2003 by the program “100,000 Solar Roofs Initiative”. These programs had low interest loans, guaranteed by the German development bank KfW (Grau; Huo & Neuhoff, 2012). The authors also point out that the photovoltaic market found support for its expansion with the Renewable Energy Sources Act, enacted in 2000, which established the procedures for accessing renewable energy generation projects to the grid and the feed-in tariff scheme (FIT). The FIT, also known as the “premium rate” guarantees a generator compensation for each unit of electricity supplied to the grid, from a renewable energy source through long-term contracts, usually 20 years (REN21, 2011). In the case of photovoltaic solar energy, this tariff has a greater differential for each unit of electricity generated and has price reduction clauses over time (ABINEE, 2012). This incentive was instrumental in increasing the energy generated from renewable energy sources from 6.3% in 2000 to over 15% in 2008 (Mendonça & Jacobs, 2009).
Alongside incentives, federal and state-level lending and grant programs for the purchase of photovoltaic solar power generation systems were implemented, stimulate investments in this technology and R&D projects that resulted in significant reduction of its price, around 52% from 2006 to 2011 (EPE, 2012; Grau; Huo & Neuhoff, 2012). Although the model adopted represents a challenge because it requires continued public support for its expansion, Germany has become an example in the European and international renewable energy community. With the generation of 38.2 GW of electricity in 2014, which represented 6.2% of the total electricity consumed in the country, surpassed market leading countries such as China, the United States and Japan, maintaining legal and financial incentives for market stability, with clear and transparent legislation for investors and consumers in general (IEA, 2015). In 2017, total installed capacity reached 43 GW, representing about 7.2% of the total electricity consumed in the country (Wirth, 2018).
Japan
Until the 1970s, Japan had an energy matrix based on fossil fuels. To reduce dependence on this energy source, it diversified the matrix by increasing the use of coal, gas and nuclear power plants. The 1970 and 1979 oil crises stimulated the launch of the national R&D program, “Sunshine ”, in order to develop non-fossil energy sources by the year 2000. The few effective results of this program led to the 1980 Alternative Energy Act, which became the main pillar of the solar project, with a USD 6 billion budget for companies to develop this technology during the 1980s and 1990s. In 1993, the Environmental Technology R&D Program expands resources for the creation of the Japanese photovoltaic industry and its domestic market (Chowdhury et al., 2014).
For Avril et al. (2012) a large grant program of around 50% of the installation cost has been implemented, including Residential Photovoltaic System Dissemination Program (1994), Support Project for Local Efforts (1997), for installation system with 50 kW output and the Proving Ground project for Industrial use (1998). In 2007 and 2008 there was a reduction in facilities due to the decrease in government aid. In 2009, with the promulgation of the Law on the Promotion of the Use of Non-Fossil Energy Sources, it resumes the subsidy program for residential photovoltaic systems and started the program for the purchase of surplus solar photovoltaic (FIT). The energy generated and not consumed sent to the grid was purchased by the supplier at twice the value compared to conventional generation.
Avril et al. (2012) argues that due to the government’s new target of doubling installed capacity by 2020, it has reached 23.3 GW, which represents 2.40% of total electricity consumption. Matsubara (2014) indicates continued growth due to the accident at Fukushima in 2011 to reduce nuclear dependency and import of fossil fuels (Matsubara, 2014). In fact, in 2017, this total installed capacity reached 49 GW, an increase of 110% over the previous figure (IEA, 2018). Acording to Matsubara (2018), The forecast for 2030 and 2050 is that Japan will reach the installed capacity of 102GW and 200GW respectively, thanks to the expansion of the FIT program.
Italy
The photovoltaic solar cell power generation system in Italy started in 2003 with Legislative Decree 387 complying with European Community Directive 2001/77/ for renewable sources. From 2005, the implementation of the Energy Tale Program established a series of incentives such as subsidized tariffs for a period of 20 years for the energy produced by photovoltaic systems. In 2007, the Second Energy Tale program was launched, which
established new criteria for boosting photovoltaic electricity production, such as simplifying the process for obtaining subsidized tariffs.
For Cucchiella and D’Adamo (2012), the implementation of FIT and net metering systems from 2008, were fundamental to the growth of the sector. FIT was applied in any region, regardless of the geographical difference from solar radiation. Photovoltaic solar power generation facilities, both small and medium-sized ones were built in the northern regions, who are richer with their own personal investment by families or small and medium enterprises, while in the south, where solar irradiation is higher, the investments were in large generation plants, generally made by energy companies or investment firms (Antonelli; Desideri, 2014, Spertino; Di leo & Cocina, 2013).
The continuity of this policy was ensured with the launch of the Third, Fourth and Fifth Count programs in 2010, 2011 and 2012 until their closure in 2013. As foreseen in the Program itself, its paralysis would occur when 6.7 billion euros in financial incentives were reached (Gestore Servizi Energetici, 2015).
For Antonelli and Desideri (2014), the growth of solar photovoltaic installations in Italy has been conduceted in a disorderly way, because it did not matter the size or number of photovoltaic solar power plants, provided they are installed over a period of three years throughout the country, regardless of the solar radiation level of the regions. To cover investment costs, additional charges on the energy bills of Italian citizens and businesses have been built in.
Nevertheless, the available data show an important evolution of the participation of photovoltaic solar energy in the Italian energy matrix, reaching 9% of the total, recording the generation of 18.62 GW in 2014 (THE ITALIAN REGULATORY AUTHORITY FOR ELECTRICITY, GAS AND WATER, 2015; IEA, 2015). In 2017 the share of photovoltaic solar energy remained at the same level, 9%, but in absolute numbers there was an increase to 19.7 GW in 2017 (STATISTA, 2017).
China
The Copenhagen Conference (COP15) in 2009 was marked by China's commitment to the world to reduce CO2 emissions. The stated goal was a 40% to 45% reduction in CO2 per unit of GDP by 2020 from 2005 levels. Its plan to achieve the result was a 15% increase in non-fossil energy sources in its energy matrix. With this ambitious goal, China meets international expectations and the long-term vision for its economic and social planning (YUAN; HOU; XU, 2012).
Grau, Huo and Neuhoff (2012) point out that China in 2009 promoted a series of market policies for photovoltaic solar power generation and launched the Golden Sun program, plus
some large-scale projects in the FIT tariff grid. All initiatives are aimed at a medium and long term renewable energy development program with official installation targets by 2020. There were also incentives for subsidy through to investors who acquire the photovoltaic generation system directly from manufacturers. This subsidy corresponds to a reduction of 50% when it is interconnected in the city's distribution network and 70% when outside the distribution network, applied in rural areas. In addition, there is ministerial support for high-tech deployment and innovation for small businesses and a R&D support budget for research institutions and businesses. These actions are intended to meet the Five-Year Plan issued by the federal government. There are other facilities to encourage the photovoltaic industry, such as loans and credits offered by state and government banks to manufacturers, direct investments and subsidies to photovoltaic equipment manufacturers, with tax cuts and loans at reduced interest. These technology support schemes for photovoltaic systems are widely used and have enabled the feasibility of cost-effective solar photovoltaic generation projects.
In order to promote the healthy development of the industry, the National Development and Reform Commission in August 2013 made the reference price adjustment of the photovoltaic solar power plant, defined the new FIT policy and emphasized that the reference price period for photovoltaic solar generation and FIT was 20 years. As a result, the reference price policy and FIT have become one of the most advantageous of the distributed generation policy to motivate photovoltaic solar generation (IEA, 2014). Wei et al. (2018) state that in the case of continuity of this tariff system until 2030, China will benefit not only from increased renewable energy, but also from real increases in GDP and employment as well as reduced greenhouse gas emissions.
The IEA report (2015a) shows that in 2014 China reached 28 GW of power in accumulated photovoltaic solar generation installations connected to the electricity grid, reaching second place in the world ranking, right after Germany and exceeding the installed capacity of Japan, Italy and the United States. t is observed that the installed capacity in 2014 connected to the grid was 10.6 GW and that represents a 25% percentage of the installed capacity in the world that year. Despite significant growth, photovoltaic power generation still accounted for 1.95% of the country’s total energy matrix. In 2016, the representativeness of photovoltaic energy in the Chinese energy matrix reached 5%, i.e. 81.25 GW (IEA, 2017). In 2017, growth in absolute terms was about 61.2%, driven by new generation plants, which resulted in an increase in installed capacity to 131 GW (IEA, 2017). By 2040, the total installed capacity of Chinese photovoltaic solar panels is projected to be 702 GW, or 22% of the country's total power generation capacity, which will be 3188 GW (IEA, 2017).
Brazil
Pereira et al., (2012) defend Brazil's comparative advantages for the implementation of photovoltaic solar cell power generation systems. Radiation in the national territory is higher than in Germany, which has the largest installed photovoltaic solar generation capacity in the world. Brazil has a minimum solar irradiation of 4.25 kWh/m2/day and a maximum of 6.75 kWh/m2/day, while in Germany the minimum irradiation is 2.95 kWh/m2/day and the maximum irradiation is 3.42 kWh/m2/day (WWF-Brazil, 2015).
Despite the country’s favorable conditions for the use of this technology, ongoing initiatives are still quite restricted. In 1994 the State and Municipalities Energy Development Program was created - PRODEEM for the purchase of photovoltaic systems for isolated communities, installing the equivalent of 5 MWp and serving 7,000 communities across the country. The initiative was incorporated into the Luz para Todos (Light for All) Program, which aimed to serve remote non-electrified locations in the national territory. Eletrobrás data show the installation of 2,046 photovoltaic systems and registered 70,451 projects in the program, totaling 319,259 projects since 2004, only by Eletrobrás (Abinee, 2012).
For Silveira, Tuna and Lamas (2012), the biggest challenge for technology expansion in the country is the limitation of public policy. WWF-Brazil (2015) highlights the Normative Resolution ANEEL 481/2012 allowing up to 30 MW photovoltaic projects to receive 80% off Transmission System Usage Tariffs (TUST) and Distribution System Use Tariffs (TUSD) over the first 10 years of operation, which reduces the final price of energy. But the discounts are only valid for projects that go into operation by the end of 2017. ANEEL Resolution 482/2012 established the net metering rules for distributed generation, determining that distribution utilities only charge the net balance between energy delivered to the consumer discounted from the energy generated by it and injected into the grid.
In 2013, the first Energy Auction was held for solar photovoltaic projects, for powers of 5 MW or more, and other sources such as wind and biomass-based or natural gas. However, the auction only received bids from wind generation with a total of 867.6 MW (PINHO; GALDINO, 2014). As for the sixth Reserve Energy Auction (REA) conducted by ANEEL in 2014 was an important milestone with the contracting of 889.7 MW in 31 solar photovoltaic projects (WWF-Brazil, 2015).
Moreover, the country's potential remains underused. A study by EPE (2014) shows that solar photovoltaic generation on residential roofs could reach 32 GW, which is 2.3 times the residential electricity consumption in 2013. However, the same study states that penetration of this type of generation still depends on its own ability to become economically viable, which will require more time for their effective participation in the Brazilian scenario.
In addition, the ICMS agreement 6, by CONFAZ (National Council of Finance Policy), that taxes energy compensation, diminishes the attractiveness of solar photovoltaic systems. This taxation is based on the fact that distributors and the government would lose revenue, as distributors stop selling energy and the government no longer collects taxes. However, they disregard the fact that tax revenues on investments made far outweigh the share of energy sales. EPE data (2014) show that a 60% increase in investments in the sector by 2023 would increase the tax balance by 10%.
WWF-Brazil (2015) advocates a government policy for the sector centered on tax and tax exemption, such as PIS, Contribution to Social Security Financing (COFINS), Industrialized Products Tax (IPI), Income Tax and Social Contribution on Net Income (CSLL) for the entire production chain, including the production of photovoltaic solar cells and modules. Also the creation of consumer financing lines for the acquisition of the systems and a greater disclosure of the benefits of this renewable energy generation source.
Greenpeace, in partnership with Market Analysis, in 2013, conducted a study for the assessment and perception of Brazilians about energy entitled “Brazilians facing renewable energy micro-generation”. The research points out that micro-generation of energy is still little known, highlighting that four out of ten Brazilians have never heard of it. Only 3 out of 10 Brazilians claim to know a lot or something about the topic, they are from the AB class, highly educated and concentrated in the Midwest. Nevertheless, most respondents say they would install the system if low-interest financing is available. Echegaray (2013) in his research advocates the receptivity of consumers and business community managers for the growing use of clean energy such as wind and solar.
It is worth noting that ANEEL did not include photovoltaic solar power generation in the 2030 National Energy Plan, indicating the little strategic weight of this energy source in Brazilian public policy (EPE, 2012). According to data from Aneel (2018a), installed capacity represents only 0.93% of the energy matrix. The following table shows the current mix with the country's power generation capacity.
Table 01 –Generation capacity in Brazil
0
Type Quantity Granted Power
(kW)
Supervised Power (kW)
%
Electric Generating Plant 693 693,762 693,324 0.43
Undi-Electric Generating Plant 1 50 50 0
Wind Generator Central 552 13,620,239 13,597,343 8.49
Small Hydroelectric Power Station 427 5,181,609 5,148,998 3.22
Photovoltaic Solar Generating Plant 2,261 1,487,578 1,480,778 0.93
Hydroelectric Power Plant 218 101,892,288 97,075,157 60.64
Thermal Power Plant 2,992 41,909,047 40,086,389 25.04
Thermonuclear Power Plant 2 1,990,000 1,990,000 1.24
Total 7,146 166,774,573 160,072,139 100
Source: Generation Information Bank. Aneel. 2018.
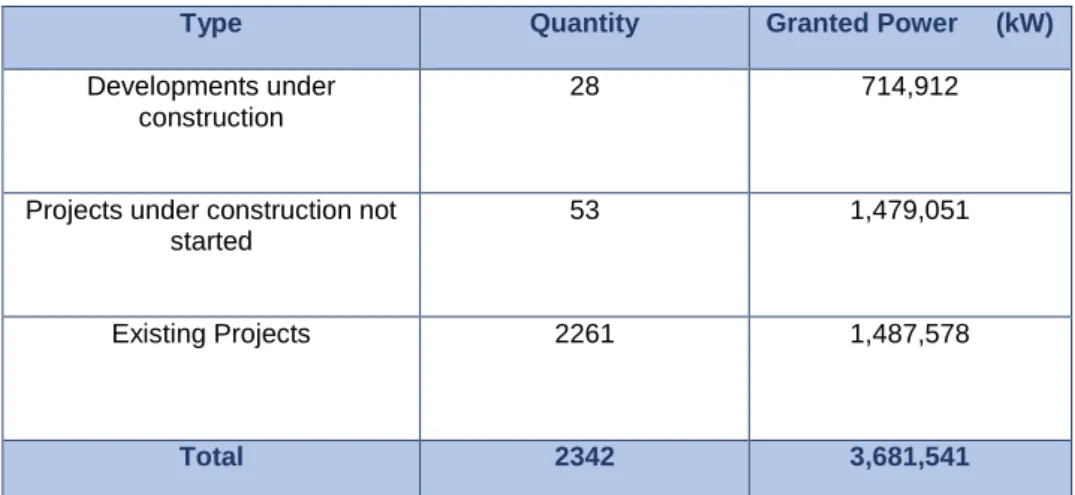
Available data on solar energy expansion show the potential for growth of both the projects and the power granted as can be seen in the table below.
Table 02 – Current and future scenario of solar energy projects in Brazil
Type Quantity Granted Power (kW)
Developments under construction
28 714,912
Projects under construction not started
53 1,479,051
Existing Projects 2261 1,487,578
Total 2342 3,681,541
Source: Prepared by the author based on ANEEL’s Generation Information Bank. 2018.
From the data presented, it can be seen that if the 28 projects under construction, totaling 714,912kW in granted power, and the 53 projects under construction not started that total 1,479,051 kW in granted power, materialized, 2,193,063 kW would be added to the existing 1,487,578 kW of existing, which would result in 3,681,541 kW. This granted power would currently represent around 2.2% of the installed capacity in the country. However,
considering that according to Aneel (2018a), In the coming years, 19,852,074 kW will be added to the country's generation capacity, thanks to the conclusion of projects in the various types of power generation alternatives, solar energy is projected to account for 1.97% of installed capacity in Brazil. Thus, even considering the expansion of this energy source in the country, this value will be much lower than the other countries studied, like Germany, Japan, Italy and China. Only the United States today would have a smaller share, although its generation in absolute terms is significantly larger than Brazil’s.
Thus, we consider for this research that characteristics of solar power generation models adopted in each country contribute to the understanding of the results achieved in the Brazilian model in relation to the other countries studied. The following table systematizes the main aspects discussed of the photovoltaic energy models of each of the countries studied.
Table 03 -Characteristics of systems implementation models of solar photovoltaic power generation
Source: Authors 2016.
As for the motivations, there is an important difference between the studied countries and Brazil. While for the United States, Germany, Japan, Italy and China, the reduction in CO2 emissions levels, decreased dependence on fossil fuels and use of nuclear energy stood out;
Países
Categorias Estados Unidos Alemanha Japão Itália China Brasil Motivação e
Benefícios para Implementação
Fontes de energia renovável para redução dos impactos ao meio ambiente, utilizando o sistema de geração fotovoltaico.
Mudança na matriz energética com redução das fontes nucleares, do carvão e do petróleo e aumento das energias renováveis com programas para geração de energia fotovoltaica.
Diminuição da dependência dos combustíveis fósseis. Desenvolver fontes de energias não fósseis e implementar novas tecnologias energéticas.
Decreto Legislativo 387 (2003) atendendo a diretiva da Comunidade Europeia para fontes renováveis.
Compromisso mundial na redução de CO2 com meta de 15% em energias renováveis até 2020.
Extensa área com altos níveis de irradiação solar. Inúmeras comunidades sem redes eletrificadas.
Desafios Ampliação dos modelos de incentivo das políticas públicas existentes para outros estados. Requer um contínuo subsídio financeiro público. Dependência de investimento financeiro público. Dependente de subsídio do governo nas tarifas de energia. Reforço das atuais redes elétricas para a expansão de carga de energia fotovoltaica no país. Uso da terra para gerar eletricidade versus agricultura.
Garantir o cumprimento das metas estabelecidas pelo Governo Central para o aumento em 15% com fontes renováveis em todo o território.
Requer políticas públicas de incentivo para a implantação de plantas de geração de energia fotovoltaica e para a implantação de instalações residenciais. Faltam campanhas informativas sobre as vantagens da energia fotovoltaica para os consumidores. Leis / Incentivo Fiscal / Incentivo Financeiro / Incentivo Tributário
Mix de políticas públicas e tarifa diferenciada net
metering . Estados com
suas próprias leis de incentivos. Incentivo Federal. Projeto Federal “Solar America Initiative” em P&D para tornar a energia fotovoltaica competitiva até 2015.
Lei para Energia Renovável com políticas públicas de incentivos financeiro e fiscal. Lei
Feed-in ( 1990). Programa 1.000 telhados (1991). Programa 100.000 telhados ( 1999). Ato de Fontes Renováveis de Energia (2000). Feed-in Tariff ( 2000).
Investimentos em P&D para fontes alternativas: Projeto Luz do Sol ( 1974). Lei de Energia Alternativa e políticas de incentivo fiscal e financeiro (1980) e Novo Projeto de Luz do Sol (1993). Projeto de Introdução e Promoção da Nova Energia em nível regional (2000). Programa de Apoio para Deter o Aquecimento Global (2001). Lei sobre a promoção do uso de fontes de energia não fósseis e a utilização eficaz de materiais de fonte de energia fóssil por fornecedores de energia (2009). Subsídios financeiros para consumidores e empresas. Decretos de 2005 e 2006 promovendo incentivo na tarifa de energia de sistemas fotovoltaicos. Programa Conto de Energia (2007) com incentivos em tarifas para as instalações fotovoltaicas.
Programa Golden Sun (2009) com incentivos na FIT. Subsídios aos investidores para o mercado local. Empréstimos e créditos às indústrias e apoio governamental a P&D. PRODEEM e Programa Luz para Todos. Desconto na TUSD e TUST pela Resolução Normativa ANEEL 481/2012 para projetos fotovoltaicos até 30 MW. Resolução ANEEL 482/2012 estabelece as regras do net metering para a geração distribuída. Primeiro leilão de energia fotovoltaica em novembro de 2013. Leilão de energia reserva com inclusão da energia fotovoltaica em novembro de 2014.
Sistema tarifário diferenciado ao consumidor
Net metering Feed-in Tariff (FIT) FIT Mix de FIT segmentado e
Net metering
FIT Net metering
Participação Atores / Governo / Empresa / Consumidor Governo: através de incentivos e mix de políticas. Empresas: através de financiamentos públicos e aumento do mercado. Consumidor: Preço da energia contratual e meio ambiente.
Governo: fornecimento de eletricidade em larga escala pelo sistema fotovoltaico e aumento da segurança de fornecimento de energia. Apoio com investimentos para fábricas e incentivos financeiros para aquisição de equipamentos. Empresas: em P&D e expansão industrial.
Governo: investimentos em P&D e para instalações de sistemas do sistema fotovoltaico. Empresas: em P&D e expansão industrial para uso do sistema fotovoltaico. Consumidor: financiamento e subsídios para instalação.
Governo: subsídio nas tarifas de energia para os sistemas fotovoltaicos. Empresas: investimentos em plantas de geração fotovoltaica . Consumidor: através de investimentos próprios. Governo: subsídio e investimentos. Empresas: investimentos subsidiados pelo governo em P&D e expansão industrial.
Governo: em fase inicial de sustentação da energia fotovoltaica nos leilões de energia.
Empresas: sem incentivo fiscal e com impostos altos para os sistemas fotovoltaicos. Consumidor: sem perspectiva de aquisição devido ao alto custo de aquisição e instalação.
Resultados Alcançados
Estados incentivando o uso da energia fotovoltaica com mix de políticas públicas de incentivo. Expansão do mercado no uso da energia solar fotovoltaica devido ao modelo de negócio do terceiro proprietário.
Incentivo federal muito forte para o uso da energia solar fotovoltaica. É o maior gerador mundial de energia solar fotovoltaica.
Ampliação das instalações fotovoltaicas devido aos investimentos e subsídios do governo.
País se torna o segundo maior gerador de energia solar fotovoltaica na Europa e o quarto no mundo.
Fortes incentivos do Governo Central para o uso da energia solar fotovoltaica. O país se tornou o maior produtor mundial de células e módulos solares fotovoltaicos.
Aguardando posição política de inclusão desta fonte na matriz energética nacional.
in Brazil, the motivation was the inclusion of communities without access to energy distribution. Challenge category reinforces continued dependence on public investment in Germany, Italy and Japan. as for the United States, the largest is in the expansion of public policies in the various states and China ensure the achievement of goals set. In the case of Brazil, the reduced public policy as well as an educational process emerge as central points.
Regarding government laws and incentives, the use of a mix of public policies that involve fiscal and tax incentives for the supply chain, involving manufacturers and consumers, R&D support to make technology more competitive and the predominance of the FIT system are the most used. It is noteworthy that in the coming decades the FIT system will tend to be increasingly central as a way of stimulating the growth of solar energy, as the Japanese and Chinese experiences show. Unlike Brazil where public initiatives appear more fragmented and limited, such as discounts on distribution system usage charges (TUSD) and the transmission system usage tariff (TUST) and the application of the net metering tariff for distributed generation.
Methodological Procedures
To achieve the objective of this study we conducted a qualitative, exploratory research, as we seek to understand the agents involved and their motivations for the implementation of photovoltaic power systems.
Methodological procedures included document analysis and interviews. The selection of respondents was intentional in order to represent the different actors involved. However, some respondents were included using the snowball technique by indicating the first group of respondents chosen (Godoi & Mattos, 2008). Interviews were held on from November 2015 to February 2016. The questions addressed the driving factors for the adoption of photovoltaic solar energy, results achieved, future scenarios barriers. In all there were 15 interviews representing the power generation and trading sector (GC1; GC2). Industrial and Business Associations (AIE1; AIE2), Government Agencies (OG1; OG2), Non-Governmental Organizations (ONG1; ONG2; ONG3; ONG4), Academia (MA1, MA2), Marketing and installation of photovoltaic systems (CI1, CI2). Interview recordings totaled 18 hours, averaging 77 minutes, and they were transcribed. The theoretical saturation criterion or pointed redundancy (Glazer and Strauss, 1967) showed that the sample chosen was sufficient for a thorough discussion of the barriers and perspectives for photovoltaic solar energy in Brazil. The transcripts were sent to the interviewees for validation, and the use of the information by the set of respondents was authorized.
The analysis technique chosen for this phase was content analysis. Following the recommendation by Bardin (1994), categories and subcategories were created to facilitate the
analysis process from the literature review and the interview analysis process, according to the table below:
Table 04 -Analysis categories and question matrix
Source: Authors 2016.
After this step, we selected text fragments, which after being coded, transcribed and tabulated, are presented below along with their comments and reflective analyzes.
Presentation of results
The first category addressed inducing factors for photovoltaic solar energy expansion. Among the internal factors, public policies were highlighted by 93% of respondents. For 57%, the adoption of the regulatory framework and the publication of the 2012 ANEEL 482 resolution was an important driver for the use of technology, by enabling the concept of distributed micro and mini-generation, allowing any consumer to generate their own energy and transfer unused surplus to the distribution grid and be compensated for their subsequent consumption.
OG2 – “482 was launched in 2012 with the goal of reducing barriers for this self-employed residential, The 482 was launched in 2012 with the goal of reducing barriers for this residential, commercial and industrial self-employed consumer so that they could have their own facility. In fact before 2012 many distributors expressly prohibited connect solar photovoltaic generation to the low voltage network”.
OG1 - “We closed 2012 with 3 micro-generation consumers. We closed 2014 with 424... In December 2015, it closed with 1,748 and we are in March and the February 2016 data closed with 2,207”.
Another important factor pointed out by 71% of respondents is the charging system adopted in resolution 482 for energy generated and injected into the distribution network, known as net metering. This system was highlighted as more suitable for the Brazilian scenario compared to the FIT. FIT, although recognized as an important tariff system for solar energy incentives in European countries, charges all electricity consumers by apportioning the subsidy to the electricity tariff. The net metering system favors the consumer, because every 1 kWh generated and injected into the network, this same 1 kWh is offset in consumption.
AIE2 – “The FIT model has been important in the past, but it is a costly model. It generates an account because you pay an energy premium to the end customer and it generates an account that needs to be prorated among consumers”.
Changes in tax aspects were also pointed out by respondents. Initially, CONFAZ authorized states to charge ICMS on the total consumption of the residential unit, without considering any compensation of the energy produced by the micro-generator. In 2015, CONFAZ itself, through the ICMS Agreement 16, authorized the granting of ICMS exemption by the states, as well as the exemption of PIS/PASEP and COFINS for the energy generated and injected by the consumer in the grid.
ONG1 – “The issue of resolving the release by CONFAZ to the states of the ICMS for electricity was a major advance in public policy, after the federal government, doing their part, removed the PIS/COFINS from the energy bill of the micro and mini generator”.
Also Resolution 687 of 205, arising from the revision of Resolution 482, provided advances in including new organizational arrangements.
OG1 – “Resolution 687 created new figures that allow, for example, consumers to organize themselves into cooperatives or consortia and to have a power plant, sharing the generation. Residential and commercial condominiums can also install and their owners can use this energy”.
The auctions held by the federal government for solar power plants were also pointed as an important driver for reversing the low rates of use of this technology in the energy matrix.
AIE2 - “In 2014, the first federal solar photovoltaic auction contracted 1,048 MW in 30 photovoltaic projects connected to the network that will be operational by 2017. In 2015 we had 2 national auctions hiring a little over 2 GW to be built in 2017 and 2018. With this, Brazil turns its participation in photovoltaic solar energy, in our index, which currently represents 0.02%”.
At the federal level, PADIS was highlighted as a program to benefit the sector.
AIE1 – “PADIS which is the semiconductor industry's densification plan. The cell and panel are considered semiconductor products and can be encouraged by PADIS. And there is already someone with the qualification, although it is not effectively producing in Brazil. PADIS gives all tax exemptions for the company to set up the factory in the country”.
The interviews also mentioned examples of state and municipal policies as inducers of the use of photovoltaic solar energy, highlighting the state auction of Pernambuco and the implementation of the green property tax in the cities of Salvador and Camaçari.
AIE2 – “From 2013, we had the first state photovoltaic solar auction held by the government of Pernambuco that hired 5 projects, 92 MW in large plants. Not all of them have been built, but some are expected to go into operation over the coming months and years, and this was the first major grid-connected solar power contract”.
MA1 – “The other option is the Green Property Tax. Several municipalities, including Salvador and Camaçari, allow you to get some discount on your property tax for photovoltaic generation”.
The price of energy and the fact that distributed systems are installed near the center of utilization of the energy load were also pointed as potential inducers. The rise in the electricity tariff due to the country's water crisis has motivated some consumers to look for alternatives such as the generation of electricity through photovoltaic solar energy. As for the proximity to consumption points, it reduces the need for expansion of transmission and distribution lines, also avoiding the load losses that commonly occur on power transmission lines. This reduces the costs involved in the power distribution of utilities, which makes it possible to reduce their prices to consumers.
CI2 – “The cost of energy has led people to look for short, medium or long term alternatives to reduce their energy costs”.
OG1 — “By putting generation close to the load, I am minimizing the load on network usage and in the long run, this will generate savings because the distributor will not need to expand the network to serve that consumer”.
The second category addressed the benefits of adopting large-scale photovoltaics. In addition to direct and indirect environmental gains, the creation of quality and technical qualification jobs should be considered. Its positive impacts on the supply chain favor the local and regional economy, including equipment assembly, maintenance, engineering and consulting employment opportunities for their acquisition and installation.
ONG2 – “At first it causes lower associated environmental impacts. When I say environmental impact, I'm not just restricted to CO2, there is also the impact on water use and so on”.
AIE2 - “The photovoltaic solar source is a great job generator, in the international average, there are approximately 25 to 30 jobs generated for each MW installed per year. Direct jobs in this case, which is one of the highest averages among different sources of electricity generation. The main feature of these jobs is that they are quality jobs, i.e., usually technical or higher level jobs, and jobs in the region where the systems are installed.
The potential for reducing energy bills and increasing energy independence was remembered by 29% of respondents. Despite the still high cost for its purchase and with a return on investment ranging 6 and 8 years, an 18-year benefit of zero-cost, clean and sustainable power generation is estimated. The warranty given by the module or photovoltaic cell manufacturers is 25 years and there are still numerous systems operating over 25 years. One of the interviewees stressed the advantage that Brazil has on the world scene by having large reserves of high purity quartz (mineral from which silicium is extracted), in addition to being one of the world leaders in the production of metallurgical grade silicium. However, this advantage is not valued in the domestic industrial market for the production of photovoltaic solar cells, as an industrial base is required for the processing of metallurgical grade silicium to solar grade silicium. An industrial base for the production of this technology would make it possible to export, in addition to quartz ore, solar grade silicium and eventually the solar modules themselves, accrediting the country as an exporter of high value-added products.
In the discussion of benefits emerged four new subcategories: high recyclability of photovoltaic modules, reduction of processes of violation of human rights; social inclusion and reduction of the social and environmental externality of power plants.
AIE2 – “These equipment have a high recyclability potential. Normally the crystalline silicium photovoltaic module has between 90 and 96% recyclability of its components. Like the aluminum chain where you can reuse most of the material used in other applications or even going back to the aluminum production chain. You can also do this in the case of photovoltaic system. This is very positive because it shows that this
chain, if properly planned from the beginning, can have very low environmental impact as reported by academia and industry around the world”.
ONG1- “Migrating to another benefit that is social one, we avoid, for example, that it would have systematic flaws in human rights as we have seen with hydroelectric constructions in the Amazon”.
ONG3 – “We include in the price of energy the externalities related to this type of generation. For example, if you take a hydroelectric or a thermoelectric. It is an energy that has to be more expensive, because it generates emissions, generates environmental impact. The socio-environmental externalities of the generation of this type of energy have to be incorporated into its price”.
The third block deals with barriers in Brazil. The cost of the photovoltaic system was pointed by 93% of respondents. Their installation is restricted to a high end consumer tier. In addition, there is a lack of adequate funding policy for this energy source on the national scene. Private and public banks often offer five-year financing for photovoltaic systems, not yet ideal for the consumer because it is equipment with a long payback, around 8 years, and high interest and taxation. Adopting the interest rate used in real estate financing and not consumer finance has emerged as a proposal.
ONG4 - “I think there is the question of economic viability. The main point is that the financing pathways we have today that can support the solar system do not reach an attractive interest rate. So this issue of differentiated interest financing lines for solar energy is one of the biggest obstacles in Brazil”.
The issue of technology disclosure to the consumer market was highlighted by 79% of respondents, ignorance of possibilities such as cost reduction, transfer of energy surplus and tariff reduction. Also the cultural issue was pointed as a hindrance to the development of this alternative.
AIE2 - “Further dissemination of the photovoltaic solar source, its qualities, its benefits is still needed, its features, how to employ this energy or installing and planning the photovoltaic system for their use. Despite showing great support and interest in this technology, it does not know the details of its operation and sometimes ends up confusing photovoltaic solar energy with solar heating”.
ONG1 – “People don't know the possibilities, they don't know the benefits. Without a doubt disclosure is important and I think it’s also a matter of culture. Culturally, Brazilians in general, do not have the habit of making investment. Buying a car is an investment. So there is a lack of investment culture and a lack of understanding that buying a photovoltaic system can be an investment. So yes, it is a cultural issue”.
The problem widens in the view of 71% of respondents due to the lack of strategic and long-term vision for the sector in the country.
ONG3 – “We have no clear effective public policy. We have public policy instruments, that are used in a fragmented way and without a strategic vision we have the ten year plans, we have the national energy plan for 2030. It was published a long time ago when solar energy did not exist in Brazil. So there is practically nothing, foreseeing or projecting a significant expansion of this source in the country”.
The barrier of energy distributors and their reactivity to technology were pointed by 50% of respondents. Since technology is perceived as a threat to business profitability due to potential drop in consumption, distributors are reluctant to effectively implement ANEEL resolution 687 for consumer tariff reductions.
AIE2 - “Unfortunately there is still some resistance from the distributors regarding the insertion and growth of distributed generation photovoltaic solar energy in Brazil, because unfortunately some distributors perceive distributed generation as a threat rather than an opportunity”.
Two interviewees also highlighted the conflict of interest in the energy scenario regarding photovoltaic solar generation that matches the lobbies of contractors or coal sector.
ONG3 – “I think there are a lot of economic agents interested in developing this source, but the lobby, like the contractors sector for the development of hydroelectric projects in the Amazon and the strong coal sector lobby that has leveraged some new projects in recent auctions”.
The intermittence of the system was also remembered. Its generation load varies with the intensity of sunlight, reaching up to 10% of its capacity value in its daytime absence; generating distortions in the power quality of the grid. Operation becomes more complex, requiring another backup power source to meet load fluctuations, either due to lack of solar intensity or increased demand for energy charge at night time. Also the problem of training of the workforce was raised by two interviewees.
AIE1 - “Another downside, which is obvious, is that you don't have 24 hours of sunshine a day. Photovoltaic is a source considered to be intermittent. You are not guaranteed the availability of electricity at the time you want it. You have to use the photovoltaic in conjunction with the large storage system or other source that gives it availability in the event of no sun or during night hours. This is an operational disadvantage”.
ONG2 – “You have some problems in the training of the workforce. We need to train people who can work in this chain, such as electricians and installers. Not an industry that requires low skilled labor. You need to qualify this workforce”.
The last category points to future scenarios. Financing and reduction of tax burden were reinforced, in addition to the remote conditions of Brazil becoming a relevant world producer. The only alternative would be massive government investments that are not on the country’s agenda.
GC2 – “It doesn't even make sense for Brazil to want to be a world producer of photovoltaic modules. It's a losing battle that, in today's technologies, is lost to China”.
For two respondents, the most promising scenario would not be to export but to invest in the local assembly capacity of the modules with imported photovoltaic solar cells, using national products such as glass, aluminum and other parts of its assembly. One of the interviewees highlighted the need to structure photovoltaic solar generation in the country's energy matrix, at least for the next 10 years, and then look at other external horizons, such as
internationalization with Latin America and Asia. A threat to the country's energy future was highlighted as a result of the termination of the trade agreement between Brazil and Paraguay of the Itaipu Treaty in 2023 and its likely increase in the energy tariff.
Conclusion
This paper aims to discuss the main characteristics and results of the models adopted by developed and developing countries regarding the generation of photovoltaic solar energy. The results show that its use has grown significantly in several countries. Although Brazil has numerous comparative advantages, it did not follow this trend. Thus, returning to the initial research question about the low representativeness of this technology in the Brazilian energy matrix, First of all, we highlight the dependence of all the studied countries on public policies for the expansion of this alternative.
The research Timilsina, Kurdgelashvili and Narbel (2012), Lauber (2006), REN (21), Chowdhury et al. (2014), Avril et al. (2012) and Matsubara (2018), evidenced that a favorable mix of public policies, including subsidies and financing, were fundamental for solar energy growth in the countries studied. We highlight the vigorous recent growth in China ensured by a set of fiscal and financial incentives (Grau, Huo & Neuhoff, 2012, Wei et al, 2018). The prospect of future solar power generation in this country is even more promising. By 2040, it should reach 22% of the total representation of its head office, and 702GW of total installed capacity (IEA, 2017) which would represent growth above 2000% compared to 2014.
In Brazil, resolutions 482 of 2012 and 687 of 2015 are important milestones in introducing innovations such as net metering or new organizational arrangements that allow consumers to share projects. However, their results are residual, since photovoltaic solar energy represents 0.93% of the energy matrix. In Brazil, public policy is fragmented and incomplete, because long-term low interest and financing mechanisms are lacking for manufacturers, investors and consumers to significantly expand the use of this alternative, corroborating the work of Market Analysis (2013) and WWF-Brazil (2015). As a result, projected growth in Brazil remains well below the countries studied. If in absolute terms relative to investments in new power generation, the expansion is 2,193,063 kW, which will represent an increase of 150%, but in relation to the total energy matrix should not exceed 1.97% for the next years, according to Aneel data (2018a). This value would be much lower than the levels that countries like Germany, Italy and Japan already record today, in addition to representing a tiny portion of what is projected for the growth of this energy source in China.
It is inferred that one of the reasons that explain the low amplitude of public policies in the country in relation to the other countries studied is the motivation. Lowering fuel participation to comply with international emission reduction agreements has motivated
European countries and China (Carvalho, 2012; Yuan; Ho & Xu, 2012) Commitments from Europe to reduce greenhouse gases by 20% by 2020 and China's commitment to reduce its CO2 emissions by 40 to 50% per unit of GDP over the same period significantly accelerated investments in solar photovoltaics. In Brazil, this pressure is much lower, due to the type of energy matrix in the country and the focus of emissions associated with deforestation. Public policies in this sector have a more symbolic and less strategic value, trying to put the country on the path of an international trend of including this alternative in the power generation mix.
The tariff system adopted in the country may also explain the few advances. FIT is considered a central element of policies in the various countries analyzed. (Mendonça & Jacobs, 2009; Cucchiella and D’adamo, 2012; IEA 2014). FIT is considered a powerful consumer incentive, as it receives a higher value for the energy sold to the distributor than the price of the consumption tariff, ensuring a significant reduction in the payback period of the investment. In the case of Japan, the significant expansion expected for solar energy expansion is due to the adoption of the FIT system (Matsubara, 2018). In China, as commented, if this subsidy persists until 2030, FIT will have positive impacts on GDP, employment and greenhouse gas emission reductions, and these positive effects tend to increase over time (Wei et al, 2018).
In Brazil, net metering was the chosen tariff model, highlighted by the interviewees as appropriate to the Brazilian scenario, for not burdening and overloading the electricity tariff for all consumers. However, by limiting itself to the credit of each kWh generated for future consumption, it does not, as in the case of FIT, a financial return on their bill, decreasing its effectiveness as a driving mechanism. The absence of a robust photovoltaic solar power model limits several opportunities for the country highlighted in the interviews and corroborated by the literature, including: generation of quality jobs, additional gains along the supply chain with complementary activities such as consulting and maintenance and local development (Irena, 2015; WWF-Brazil, 2015). It is also noteworthy that, although Brazil has one of the largest quartz reserves, this advantage is not used for the construction of an industrial base for the processing of metallurgical grade silicium for solar grade silicium, main material for photovoltaic cell production. Thus, the opportunity for the country to play a much more important role in international trade in this segment is lost, limiting itself to the role of commodity exporter.
Lack of strategic look on the part of government and business also hinders seizing emerging markets. The recycling of the photovoltaic module, highlighted in the interviews, is an extremely important factor of this renewable source. McDonald and Pearce (2010) point out that the increasing use of solar photovoltaic generation is a concern for the near future, with the end of life of photovoltaic solar modules and their disposal. On the other hand, the high recyclability rate of these equipment, between 90 and 96%, added by the presence of valuable
metals guarantee the economical viability of the recycling process (Larsen, 2009; Abinee, 2012).
Finally, we emphasize that the spread of photovoltaic solar energy is also a cultural issue. The precarious disclosure by government institutions and the lack of knowledge of the Brazilian consumer pointed out in the Market Analysis works (2013) and WWF-Brazil study (2015) limit the expansion of technology in the country. Added to this is the issue of long-term payback and module price volatility as they are pegged to the dollar in a country that dominates short-term financial return calculations. Nevertheless, we should considered that recent data from Auction Nº 01/2018 - “A-4”, held on April 4, 2018 show that solar energy has gained a new level of competitiveness, leading in contracted volume and with a strong price reduction (ANEEL, 2018b). There was a strong discount of 62.2% compared to the initial price of BRL 312.00/MWh, reaching an average selling price of electricity of BRL 118.07/MWh (ABSOLAR, 2018). According to ABSOLAR, this price reduction and the gain in competitiveness are due to the equipment price reduction, recovery of the Brazilian real (BRL) against the dollar (USD) and intense competition among entrepreneurs (ABSOLAR, 2018). Such reduction eventually exceeded one of the goals of the 2026 Ten Year Energy Plan, challenging the solar photovoltaic industry to reduce its prices by up to 40% by 2023 (PDE 2026). It remains to be seen whether this reduction will induce the Brazilian government to expand the holding of more hiring auctions from this source.
Nevertheless, we conclude that all the limitations presented for the Brazilian model of photovoltaic solar energy make the country enjoy little of its comparative advantages in relation to the other countries studied. Future research may deepen the integrated benefits of the solar energy supply chain in economic, environmental and social terms. We highlight the feasibility of silicium beneficiation, the jobs generated in the production chain and their contribution to social inclusion and reduction of environmental impacts when compared to traditional power generation systems.
References
Agência Nacional de Energia Elétrica – ANEEL. (2015). Resolução Normativa Nº 481 de 17 de abril de 2012. Altera a Resolução Normativa nº 77, de 18 de agosto de 2004. 20 abr. 2012a. Available in: <http://www.aneel.gov.br/cedoc/ren2012481.pdf >. Accessed on: March 20. 2015.
______(2015). Resolução Normativa Nº 482 de 17 de abril de 2012. Estabelece as
condições gerais para o acesso de microgeração e minigeração distribuída aos sistemas de distribuição de energia elétrica, o sistema de compensação de energia elétrica, e dá outras providências. 19 set. 2012b. Available in: <
http://www.aneel.gov.br/cedoc/bren2012482.pdf>. Accessed on: March 20. 2015. ______(2018a). BIG - Banco de Informações de Geração: Capacidade de Geração do
<http://www2.aneel.gov.br/aplicacoes/capacidadebrasil/capacidadebrasil.cfm>. Accessed on: 25 nov. 2018.
_____ (2018b). Sala de Imprensa: Leilão de geração “A-4” termina com deságio de 59,07%. 2018. Available in: <
http://www.aneel.gov.br/sala-de-imprensa-exibicao/- /asset_publisher/XGPXSqdMFHrE/content/leilao-de-geracao-a-4-termina-com-desagio-de-59-07-/656877?inheritRedirect=false>. Accessed on: 13 nov. 2018.
Antonelli, M.,& Desideri, U. (2014). Do feed-in tariffs drive PV cost or viceversa? Applied
Energy. 135, 721-729. doi 10.1016/j.apenergy.2014.06.059
Associação Brasileira da Indústria Elétrica e Eletrônica – ABINEE (2012). Propostas para Inserção da Energia Solar Fotovoltaica na Matriz Elétrica Brasileira. [S.l.]: ABINEE, p. 1-176.
Associação Brasileira de Energia Solar Fotovoltaica – ABSOLAR. (2018). Notícias externas. Frente solar fotovoltaica surpreende em leilão de energia nova com forte redução de preço e liderando em volume contratado. 2018. Available in:
<http://www.absolar.org.br/noticia/noticias-externas/fonte-solar-fotovoltaica-surpreende-em-leilao-de-energia-nova-com-forte-reducao-de-preco-e-liderando.html>. Accessed on: 13 nov. 2018.
Avrill, S. et al. (2012) Photovoltaic energy policy: Financial estimation and performance comparison of the public support in five representative countries. Energy Policy, 51, 244-258. doi 10.1016/j.enpol.2012.07.050
Bardin, L. Análise de conteúdo. Lisboa: Edições 70, 1994.
Chowdhury, S., et al (2014). Importance of Policy for energy system transformation: Diffusion of PV technology in Japan and Germany. Energy Policy, 8, 285-293.
doi 10.1016/j.enpol.2014.01.023.
Cucchiella, F.,& D’adamo, I. (2012). Feasibility study of developing photovoltaic power projects in Italy: An integrated approach. Renewable and Sustainable Energy Reviews, 16, 1562-1576. doi10.1016/j.rser.2011.11.020.
Echegaray, F. (2014) Understanding stakeholders’ views and support for solar energy in Brazil. Journal of Cleaner Production, 63, 125-133. doi 10.1016/j.jclepro.2013.02.017. Empresa de Pesquisa Energética - EPE. (2012) Nota Técnica EPE: Análise da Inserção da
Geração Solar na Matriz Elétrica Brasileira. Rio de Janeiro: MME - Ministério de Minas e Energia.
______(2014). Balanço Energético Nacional 2014: Relatório Sintese - ano base 2013. Rio de Janeiro: MME - Ministério de Minas e Energia.
Gestore Servizi Energetici - GSE. Evoluzione del Conto Energia. [2015]. Disponível em: <http://www.gse.it/it/Conto%20Energia/Fotovoltaico/Evoluzione%20del%20Conto%20 Energia/Pages/default.aspx>. Accessed on: Oct 15 2015.
Energy Information Administration – EIA (2018). US Energy facts 2018. Available in:
<https://www.eia.gov/energyexplained/?page=us_energy_home#tab1>. Accessed on: Oct 15 2018.
Godoi, C. K., & Mattos, P.L.C.L. Entrevista qualitativa: instrumento de pesquisa e evento dialógico. In: Godoi, C. K.; Bandeira-de-mello, R.; Silva, A. B da (orgs). (2012). Pesquisa,
estratégia e métodos. 2. ed. São Paulo: Saraiva, p. 301-323.
Grau, T., Huo, M., & Neuhoff, K. (2012). Survey of photovoltaic industry and policy in Germany and China. Energy Policy, 51, 20-37. doi
https://doi.org/10.1016/j.enpol.2012.03.082
Gtm research; solar energy industries association - SEIA. (2015) U. S. Solar market insight report, 2014: year in review, executive summary. [S.l.]: Greentech Media, Inc. and Solar Energy Industries Association.
International energy agency - IEA. (2012). World Energy Outlook 2012: Renewables energy outlook. [S.l.]: IEA.
______(2014). National Survey Report of PV Power Applications in CHINA 2013: Photovoltaic Power Systems Programme. [S.l.]: IEA.
______(2015). National Survey Report of PV Power Applications in CHINA 2014: Photovoltaic Power Systems Programme. [S.l.]: IEA.