Solving Logistics’ Problems through an Infinite Servers Queue Systems Approach
José António Filipe*
Instituto Universitário de Lisboa BRU-IUL, ISTAR-IUL
Av. Das Forças Armadas, 1649-026 LISBOA, Portugal
Email: [email protected] * Corresponding author
Manuel Alberto M. Ferreira
Instituto Universitário de Lisboa BRU-IUL, ISTAR-IUL
Av. Das Forças Armadas, 1649-026 LISBOA, Portugal
Email: [email protected]
Abstract
It is exemplified in this article a proceeding based on the busy period concept of infinite servers queues systems to deal with equipment’s failures. Evidently, the occurrence of failures in the equipment is a situation that demands managerial procedures in order to repair the failures as quick as possible and also to minimize the losses in the equipment operation. The model presented here - by means of infinite servers queuing systems - allows to generate system performance measures. It also contributes to solve organizational structures’ problems, by minimizing the risks of the inoperative structures of organizations, which have considerable logistics pernicious consequences for companies and often for regions where they are implanted.
Keywords: Queue, Systems, Busy period, Business logistics, Equipment, Failures, Management, Efficiency.
JEL Classification: C02, M21. Biographical notes:
José António Filipe: Assistant Professor at ISCTE-IUL (Instituto Universitário de Lisboa), has his Habilitation in Quantitative Methods, PhD in Quantitative Methods, Master in Management and Graduation in Economics. His current interests include, among others, Mathematics and Statistics, Multi Criteria Decision Making Methods, Chaos Theory, Game Theory, Stochastic Processes - Queues and Applied Probabilities, Bayesian Statistics - Application
to Forensic Identification, Applications to Economics, Management, Business, Marketing, Finance and Social Problems in general.
https://ciencia.iscte-iul.pt/public/person/jcbf
Manuel Alberto M. Ferreira is Electrotechnic Engineer and Master in Applied Mathematics by Lisbon Technical University; PhD in Management-Quantitative Methods with Habilitation in Quantitative Methods by ISCTE-Lisbon University Institute. He is former Chairman of the Board of Directors and former Vice-President of ISCTE-Lisbon University Institute. He is Full Professor at the ISCTE Lisbon University Institute and Director of Department of Mathematics in ISTA-School of Technology and Architecture. His research interests are: mathematics; statistics; stochastic processes-queues and applied probabilities; game theory; Bayesian statistics: application to forensic identification applications; applications to economics, management, business, marketing, finance and social problems in general. Has published more than 420 papers, in scientific journals and conference proceedings, and 37 book chapters. Presented 170 communications in international scientific conferences.
https://ciencia.iscte-iul.pt/public/person/mamf
1 Introduction
Faced with the scarcity of resources, economic agents have to decide the way resources are efficiently allocated, through very rigorous management rules. The various elements in business logistics shall meet correct magnitudes, measurements and efficiencies. As structures management includes the need of strong capabilities and competences, the problem of solving logistics machine failures is very challenging and reveals to be crucial.
In general, logistics is related to a set of activities involving the organization and the implementation of a complex operation. Although, in a general business sense, logistics is the management of the flow of things between the point of origin and the point of consumption in order to meet requirements of customers or corporations, in the sense of the present article, the management of a fleet is taken into account considering the importance of repairing the failures and to find out the duration of the periods of repairing, in order to make a good fleets’ activities planning.
A model for this problem, constructed in terms of infinite servers queue systems may be worked in order to get interesting measures for this problem.
This paper will progress based on the queuing systems literature review, considering particularly M/G/ queue theory, with an emphasis in its busy period. Then the research framework is designed to be applied to a concrete situation: the equipment’s failures effect in a production unit performance. An example of failures occurring in a fleet is considered. Finally some conclusions are presented, synthetizing the problem solution and expressing the importance of such results.
2 Literature Review
In this article, a M/G/ queuing system (see Takács, 1962) is considered to construct a model to study equipment’s failures. Indeed, this queuing system fits very well to do such study.
This article begins doing an overview on queuing theory (see Kendall, 1953a; Cox and Smith, 1961), as much as considers the importance of single nodes and networks of nodes concepts,
which will be presented in a general form. It is also important to highlight the relevance of the busy period concept that will also be seen with particular detail. Later, a choice will be made using queues’ systems with a single node, considering the features of the problem studied in this article (see Ferreira, 2016 and Ferreira and Filipe, 2017).
2.1 Queuing Theory Stochastic Processes
As stated in Ferreira (2016), a population, in statistical terms, is a set of objects that share common characteristics. Often, in practical situations, it is important to study statistically the expansion, or the reduction, of a population in order, at the right time, to control it. If N (t) is the population size at instant t, the states of the population process are the various values that can be assumed by N (t) and the probability that N (t) =n, n=0, 1, 2 … is denoted pn (t).
A birth is considered to occur when a new member joins the population. There is a death when a member leaves the population.
A population process is a Markov process (see, for example, Cox and Miller, 1965 and Haviv, 2013) if the changing from a state to another, eventually the same, transition probabilities depend only on the initial state and not on the mutations experienced by the process till the arrival at the present state.
The probability distribution that rules the number of births and deaths in a certain time interval, in a Markov process, depends only on the interval length and not on the initial state.
A queue system is a birth and death process with a population composed by customers receiving a service or waiting for it. There is a birth when a customer arrives at the Service Centre. There is a death when a customer abandons the Service Centre. The state of the system is the customers’ number in the Service Centre. The population process is the most important quantity of interest in the study of queues. In particular, it is important the search for its stationary distribution. In this situation pn (t) do not depend on time and is denoted pn. Usually pn is obtained
computing pn
t tlim . The pn (t), depending on time, characterize the queue system transient behaviour. The probabilities pn characterize the queue system stationary state, also called
equilibrium state.
Other important quantities, that are the queuing system performance measures, are the waiting time, also called queue time - the time that a customer spends in the system waiting for the service - and the sojourn time - the total time that a customer spends in the system: queue time plus service time.
Often it is difficult to obtain treatable formulae for the population process, the waiting time and the sojourn time (see Pollaczek, 1930) and even to make an analytic study. So numerical and simulation methods are intensively used.
2.2 Queues with a Single Node
For well understanding the concept of queues with a single node it is necessary to consider the problem in general and to get the relevant fundaments in the theory.
As referred in Alfa (2010), a single node queue is a system in which a customer arrives for having a service only at one node. The service may involve feedback into the same queue. When the customer finally has the service finished, it leaves the system. A single node system has only one service location and the service is provided by the same set of servers in that location.
This kind of queues is particularly important once it allows the study of a set of problems and has a very general application, being applied to a sort of physical and even social problems. Later in this study this queues’ system will be applied to logistics problems of equipment’s failures.
To make clear the way this kind of queues work see Ferreira (2016, 2017), who presents in a very organized way the system, through the following development for the methodology.
So, let’s consider a Service Centre at which arrive units, the customers, requiring service to other units, the servers, with or without difference among customers and servers.
The most challenging situations concerning these systems study, Statistical Queuing Theory subject matter, occur when it is assumed that:
Customers arrivals follow a stochastic process,
Each server spent time to supply to each customer the required service is a random variable. Other relevant factors are:
The number of servers that may be finite or infinite, constant or variable,
If the number of servers is finite, some customers must wait to be served. The waiting capacity, that may be finite or infinite, is the maximum number of customers that may stay in the Service Centre waiting to be served. The system capacity is the maximum number of customers, being served or waiting for service, which are allowed to stay in the Service Centre simultaneously. When a customer arrives at a Service Centre with the capacity complete it is considered lost to the system. So the queue systems with finite capacity are
systems with losses. If the number of servers is infinite a customer that arrives finds immediately an available
server. So there is no queue in the formal sense of the term. Queue systems with infinite servers are systems with neither waiting nor losses.
The queue discipline is the method as the customers are selected by the servers or vice-versa. Some examples of queue disciplines are (see Kendall, 1953a):
- “First come-first served” (FCFS); - “Last in-first out” (LIFO);
- “First in-first out” (FIFO); - “Processor sharing” (PS);
- “Service in Random Order” (SIRO); - “Priority” (PRI);
- “General Discipline” (GD).
The arrivals process is usually characterized through the probability distribution of the time length between two successive arrivals of customers at the Service Centre: the inter-arrivals time length probability distribution. It may be deterministic or stochastic. There are models where batch arrivals are considered: the number of customers, arriving at each instant of the sequence of the arrivals instants, is a random variable R that can assume integer values greater than 1 - see, for instance, Shanbhag (1966). The arrivals process may depend or not on the number of customers present at the Service Centre. Sometimes refusal situations are considered: the customer arrives and refuses to enter in the Service Centre because there are too many customers waiting to be served. And also renounce situations: the customer is already in the Service Centre and leaves it because it thinks that has waited a too long time.
The service process is specified indicating the length of the time that a customer spends being attended by a server probability distribution: the service time. Deterministic or stochastic service times are allowable.
A Service Centre which has associated a service process, a waiting capacity and a queue discipline is a node. A node with the respective arrivals process is a queue.
The Kendall notation (see Kendall, 1953b), for describing queues is v/w/x/y/z where - v denotes the arrival process (D, deterministic; M, exponential; 𝐸𝑘, Erlang (k); G,
any others),
- w denotes the service process (D, deterministic; M, exponential; 𝐸𝑘 , Erlang (k); G,
any others),
- x denotes the number of servers, - y denotes the system capacity, - z denotes the queue discipline.
If y is not mentioned it is supposed to be infinite. If z is not mentioned it is supposed to be FCFS.
2.3 Queues in Network
A device composed of N, N>1, nodes is called a network of queues (Walrand, 1988). It constitutes a generalization of the concept of queues with a single node.
Considering the work of Ferreira (2013, 2016), it is easy to understand this class of queuing systems. As explained in his work, a network of queues is a collection of nodes, arbitrarily connected by arcs, through which the customers travel instantaneously; and there is:
- an arrival process associated to each node;
- a commutation process which commands the various costumers’ paths.
The arrivals processes may be composed of exogenous arrivals, from the outside of the collection, and of endogenous arrivals, from the collection nodes.
A network is open if any customer may enter or leave it. A network is closed if it has a fixed number of customers that travel from node to node and there are neither arrivals from the outside of the collection nor departures. A network open for some customers and closed for others is said to be mixed.
The commutation process rules, for each costumer that abandons a node, which node it can
visit then or if it leaves the network. In a network with J nodes, the matrix
JJ J J J J p p p p p p p p p P 2 1 2 2 2 2 1 1 1 2 1 1
is the commutation process matrix, being
p
jl the probability of a customer, after ending its service at nodej, go to nodel, j,l 1,2,...,J. The probability J l jl j p q 1
1 is the probability that a
customer leaves the network from nodej,j1,2,...,J.
A network of queues with infinite servers in each node, with Poisson process exogenous arrivals, may be looked like an M/G/ queue. The service time is the sojourn time of a customer in the network. Denote S the sojourn time of a costumer in the network and Sj its service time at
nodej,j1,2,...J. Be G t andGj t the S andSjdistribution functions, respectively, G s andGj s
the respective Laplace Transforms.
- If J 2 1
is the network exogenous arrival rates vector, where the rate j is the
exogenous arrival rate at node j and
J j j 1 , making
s G s G s G s J J 2 2 1 1 and
s G p G p s G p s G p s G p s G p s G p s G p s G p s P J JJ J J J J J J 2 2 2 1 1 2 2 2 2 1 1 2 1 2 1 2 1 1 1 results P I s P I s s G 1 T 1 , where A is acolumn with J 1`s, for the Laplace Transform service time (Ferreira and Andrade, 2010a). This is an algorithm to compute the sojourn time probability distribution function of a customer in a network which nodes are M/G/ queues, using traffic equations and Laplace transform.
There are many practical applications, the most of them uncommon but some very well known, using mainly infinite servers’ nodes.
The referred practical applications use the M/G/ queue ability for the study of large populations’ processes, which may be used in areas as Logistics, Financial problems, Energy problems, Disease problems, Unemployment situations, Compartment models (Biology, Birth-sickness-death Processes, Hierarchical Systems) and Repairs Shop, see, for instance, Ferreira and Filipe (2017).
Statistical Queuing Theory may be applied yet in a larger context for example to intelligent transportation systems, call centres (see Ferreira and Andrade, 2010b), PABXs, telecommunications networks, advanced telecommunications systems and traffic flow. The networks of queues are used, for example, to reduce the waiting times in hospitals.
2.4 Traffic Intensity
The traffic intensity, , is the most important parameter in queues study. See, for instance, Cox and Smith (1961). It is given by whereis the customers’ arrival rate and the mean service time.
Little’s formula - see Cox and Smith (1961) - is the most popular result in queuing theory. It is a very general formula usable for any queue system that has the possibility of reaching the stationary state. It relates the mean number of customers in the system, N, with the mean sojourn time of a customer, W, through the arrival rate, λ:
N= λ W.
Pollaczeck-Khinchine formula - see also Cox and Smith (1961) - is used, for the M/G/1 queue, to evaluate the mean waiting time of a customer in the system:
𝑊𝑠 = 𝛼1−𝜌𝜌 1+𝛾𝑠2
2 ,
where
s is the service time coefficient of variation. The mean sojourn time of a customer in thesystem is then
W
W
q
. 2.5 Busy PeriodThe busy period of a queue system begins when a customer arrives there, finding it empty, and ends when a customer leaves the system letting it empty. Along the busy period there is always at least one customer in the system. In any queue system there is a sequence of idle periods and busy periods. In systems with Poisson arrivals the idle period time length is always exponential. The statistical study of the busy period time length is always a very difficult task. In general, the busy period time length is related with the transient behaviour (see, for instance, Ferreira and Andrade, 2009a, b). An idle period followed by a busy period is a busy cycle.
For a M/G/ queue, if the service time distribution function belongs to the collection (see Ferreira and Andrade, 2009a,b, Ferreira, 2017 and Ferreira and Filipe, 2017)
, 1 1 1 1 0 0 0 0 0
dw e e dw e e e t G t w u du du u w du u t w w t
1 , 0 0
e t du u t tthe busy period length distribution function is
G e t u du te w u dudw t B w t 0 0 1 1
0
0
1 0 , 0 1 0 0 e t t u du n du u t e n G n n t . If 𝛽(𝑡) = 𝛽 (constant)
1 , 0 , 1 1 1 e t e e e t G t (2.5.1) and
, 1 , 0 , 1 1 e t e e t B e ta mixture of a degenerate distribution at the origin and an exponential distribution.
The busy period of the MG queue may be useful to model socio-economic problems as, for example, disease problems, see Ferreira (2014), or unemployment, see Ferreira (2017a).
2.6 Queues and Logistics
The results got from MG queuing system theory can be applied to Logistics and particularly networks of queues with infinite servers in each node have interesting applications in that area based on the failures of transport vehicles, what allows computing important measures of performance. A set of interesting studies in this area can be found in, for instance, Ferreira (2002, 2003, 2013), Ferreira, Andrade and Filipe (2009), Ferreira and Filipe (2010a,b, 2017), Filipe and Ferreira (2015) and Ferreira, Filipe and Coelho (2014). In these works customers are the failures occurred in an equipment. For the development of the models, the service time is considered the time that the machine used is idle when is waiting for reparation or is being repaired. Some other studies can be also found in Ferreira et al (2012), making reference to operations in aircraft, shipping or trucking fleets areas. In the research of these authors there are studies considering either a single node or networks of M/G/ queues where the customers are the devices failures that are supposed to occur according to a Poisson process. The service time is the time elapsed from the instant the failure is detected till the one at which it is completely repaired.
3 Research Framework
For studying the problem approached in this article, the generic queue model considered is the
MG queue (based on Ferreira, 2003). In this queue system customers arrive according to a Poisson process at rate 𝜆. Each customer finds an available server as soon as it arrives to the system. The length of service provided is a positive random variable with distribution function G (t) and mean value 𝛼. The traffic intensity is .The service of a customer is independent from the other customers’ services and from the arrivals process.
The MG queue busy period is the key concept in this work. Formulae that allow the calculation of some of the busy period length parameters for the MG queuing system are
4 MG Queue System Busy Period Parameters
Among other very interesting features, the MG queuing system has neither losses nor
waiting. Indeed it is not a typical queuing system in the common sense.
For these kind of systems, to study the population process is not as important as for other systems with either losses or waiting. It is much more relevant the study of some other processes as, for instance, the busy period.
The results related to the MG queuing system busy period time length allow to find performance evaluation measures for the equipment.
An illustration will be presented in this study, considering a very simple and short numerical example. For another quite interesting application see Carrillo (1991).
Calling B the MG queuing system busy period time length random variable (see Ferreira and Andrade, 2009a,b), the B mean value, whatever is G(.), is given in Takács (1962) as
e 1 B
(4.1).Calling now VAR [B] the variance of B, it can be seen that it depends largely on the probabilistic structure of B. Anyway in Sathe (1985) it is stated that:
2
2 2 2 2 2 2
max e e s 2 e 1;0 VAR B 2e s 1 e 1 e 1
(4.2)
where 𝛾𝑠 is the G (.) variation coefficient.
Calling R(t) the mean number of busy periods that begin in [0, t] (being t = 0 the beginning of a busy period), after Ferreira (1995), is possible to show that
𝑒−𝜌(1 + 𝜆𝑡) ≤ 𝑅(𝑡) ≤ 1 + 𝜆𝑡 (4.3).
And, see also Ferreira (1995), if the service time distribution function is 𝐺1(𝑡) =
𝑒−𝜌
(1−𝑒−𝜌)𝑒−𝜆𝑡+𝑒−𝜌, 𝑡 ≥ 0 (note that it results from (2.5.1) making 𝛽 = 0):
,
𝑉𝐴𝑅[𝐵] =𝑒2𝜌𝜆2−1,
𝑅(𝑡) = 1 + 𝜆𝑒−𝜌𝑡 (4.4).
And if it is 𝐺2(𝑡) = 1 − 1
1−𝑒−𝜌+𝑒−𝜌+1−𝑒−𝜌𝜆 𝑡
, 𝑡 ≥ 0 (note that it results from (2.5.1) making 𝛽 =
𝜆 𝑒𝜌−1):
𝑉𝐴𝑅[𝐵] =( 𝑒
𝜌− 1)2
𝜆2 ,
𝑅(𝑡) = 𝑒−𝜌+ (1 − 𝑒−𝜌)2+ 𝜆𝑒−𝜌𝑡 + 𝑒−𝜌(1 − 𝑒−𝜌)𝑒−1−𝑒𝜆−𝜌𝑡
(4.5).
Denote
N
Bthe mean number of the customers served during a busy period in the MGqueuing systems. Considering the exposed in Ferreira (2001), if G (.) is
−Exponential 𝑁𝐵𝑀 = 𝑒𝜌
−Any other service distribution 𝑁𝐵≅ 𝑒(𝜌(𝛾𝑠2+1))(𝜌(𝛾𝑠2+1)+1)+𝜌(𝛾𝑠2+1)−1
2𝜌(𝛾𝑠2+1)
(4.6).
For the purposes of this work, the busy period is a period in which there is at least one failure waiting for reparation or being repaired; and an idle period is a period in which there are no failures. The mathematical expressions presented in this section are very simple and easily applicable. They allow computing the mean and upper and lower bounds to the variance (and in consequence also for the standard deviation) of the busy period. And also simple upper and lower bounds to the mean number of busy periods that begin in a determined length of time. And finally, expressions to the mean number of failures that occur in a busy period were also presented. These formulae application only require the knowledge of , , and
sthat are very easy to compute. The only real problem is to statistically test the hypothesis that the failures occur according to a Poisson process1.Note yet that, calling I(t) the idle period time length of the MG queuing system random variable distribution function, 𝐼(𝑡) = 1 − 𝑒−𝜆𝑡, as it happens with any queue with arrival Poisson
process. For this application it gives the probability that the time length with no failures is lesser or equal than t.
5 A Business Example
Suppose a fleet where the failures occur at a rate of 20 per year. So 𝜆 = 20/year. Suppose also that the mean time to repair a failure is 4 days (
= 4 day = (4/365) year). In consequence0.22 .
Consider the possibility of decreasing
to 0.11. Either making =10/year, for instance buying more items and decreasing, in consequence, each one use intensity. Or making
= 2 day. For instance increasing the teams affected to the failures repairs.On the contrary, if nothing is changed, things can get worse and maybe
jump to 0.44. The values0.05, 0.66, 0.88 and 12 are also considered.
1 An usual assumption for this kind of phenomena.
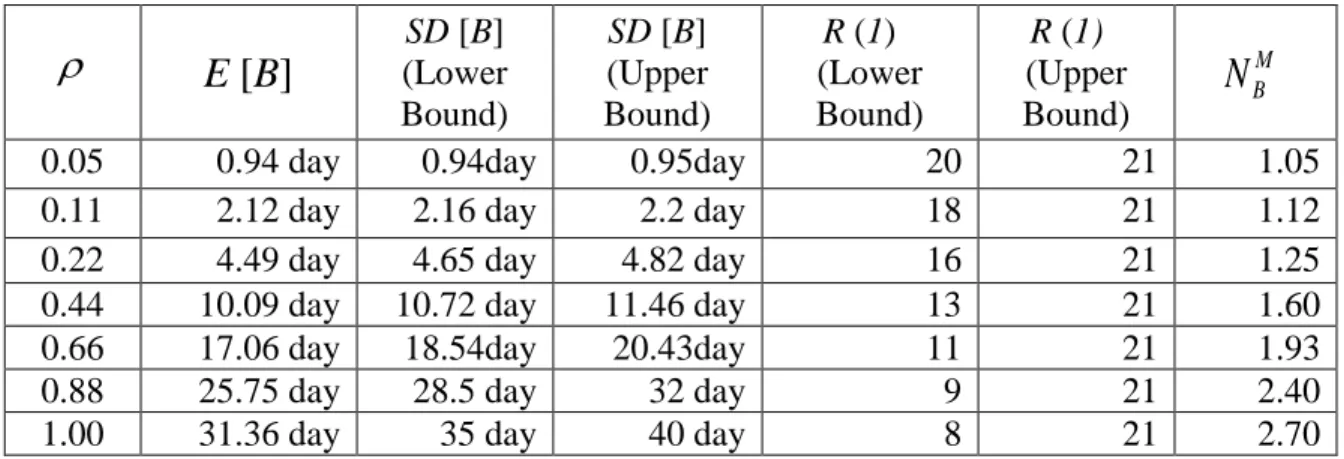
If it is supposed that the repair services times are exponential3
s
=1, and after (4.1), (4.2), (4.3) and (4.6), with t=1 year, being 𝑆𝐷[𝐵] = √𝑉𝐴𝑅[𝐵],Table 1 Exponential service times
E [B]
(Lower SD [B] Bound) SD [B] (Upper Bound) R (1) (Lower Bound) R (1) (Upper Bound)N
BM0.05 0.94 day 0.94day 0.95day 20 21 1.05
0.11 2.12 day 2.16 day 2.2 day 18 21 1.12
0.22 4.49 day 4.65 day 4.82 day 16 21 1.25
0.44 10.09 day 10.72 day 11.46 day 13 21 1.60
0.66 17.06 day 18.54day 20.43day 11 21 1.93
0.88 25.75 day 28.5 day 32 day 9 21 2.40
1.00 31.36 day 35 day 40 day 8 21 2.70
and it is possible to conclude, for these values, that when
increases, less busy periods in one year occur, with more failures in each one, of course in mean values. The busy period mean and dispersion length also increase with
.If it is supposed now that the repair service times are constant (D = deterministic),
s
0
, and after (4.1), (4.2) 4, (4.3) and (4.6), with
t
= 1 year:Table 2 Deterministic service times
E [B]
SD [B] R (1) (Lower Bound) R (1) (Upper Bound) D BN
0.05 0.94 day 0.12 day 20 21 1.54 0.11 2.12 day 0.41 day 18 21 1.59 0.22 4.49 day 1.22 day 16 21 1.68 0.44 10.09 day 3.85 day 13 21 1.90 0.66 17.06 day 7.94 day 11 21 2.18 0.88 25.75 day 14. day 9 21 2.51 1.00 31.36 day 18. day 8 21 3.09E [B] and the R (1) bounds are the same that in the former case, evidently. The behaviour of
the parameters with the increase of
is like the one of the exponential situation. But now the busy period length dispersion is much lesser and the mean value of failures in each busy period is greater.
3 A very frequent supposition assumed for this kind of services.
As for the service times with distribution functions 𝐺1(𝑡) and 𝐺2(𝑡), it is not possible to present results for 𝑁𝐵 because there is not an efficient formula to calculate 𝛾𝑠. But 𝑆𝐷[𝐵] and 𝑅(1)
are exactly calculated after (4.4) and (4.5) for 𝐺1(𝑡) and 𝐺2(𝑡), respectively. Table 3 Service times with 𝑮𝟏(𝒕) distribution function
E [B]
SD [B] R (1) 0.05 0.94 day 5.9 day 20 0.11 2.12 day 9.1 day 19 0.22 4.49 day 13.57 day 17 0.44 10,09 day 21.68 day 14 0.66 17.06 day 30.22 day 11 0.88 25.75 day 40 day 9 1.00 31.36 day 46.13 day 8Table 4 Service times with 𝑮𝟐(𝒕) distribution function
E [B]
SD [B] R (1) 0.05 0.94 day 0.94 day 20 0.11 2.12 day 2.12 day 19 0.22 4.49 day 4.49 day 17 0.44 10,09 day 10.09 day 13 0.66 17.06 day 17.06 day 10 0.88 25.75 day 25.75 day 9 1.00 31.36 day 31.36 day 8Note that for 𝐺1(𝑡) service time distribution function the busy period is exponentially distributed with an atom at the origin. For 𝐺2(𝑡) service time distribution function the busy period
is purely exponential5. Anyway, in both cases, for these traffic intensity values, it is possible to conclude that the busy period mean and dispersion length also increase with
.6 Concluding Remarks
A proceeding based on the busy period concept of infinite servers’ queues to deal with equipment’s failures was presented and discussed on this article.
Considering this model, it can be understood that when operating a fleet6, managers are
interested in big idle periods and little busy periods. And if these busy periods occur they prefer that they are as rare as possible, with the shortest number of failures possible.
From the model results, some system performance measures are got, as exemplified in the tables presented above, representing an excellent contribution for managers dealing with organizations’ planning.
If , , and
sare known, the manager of the fleet can evaluate the quality of the operation,namely in terms of:
the mean length of a period with failures, the length dispersion of a period with failures,
the mean number of periods with failures that will occur in a certain length of time, the mean number of failures that occur in a period with failures.
As the expressions depend only on a few parameters, very simple to obtain and interpret, they evidence trajectories to improve the operation, although they may be hard to implement depending on the company capabilities.
In the context of recent financial and economic crisis, numerical reliable indicators are very important because they allow defining good managing policies and practices. Besides their simplicity, the ones proposed in this article own this reliability property.
REFERENCES
Alfa, A. S. (2010) Queueing Theory for Telecommunications: Discrete Time Modelling of a Single
Node System, Springer. New York, USA.
Carrillo, M. J. (1991) ‘Extensions of Palm’s Theorem: A Review’, Management Science, Vol. 37, No. 6, p.739 - 744.
Cox, D. R. and Smith, W. L. (1961) Queues, London: Methuen.
Cox, D. R. and Miller, H. D. (1965) The Theory of Stochastic Processes, London: Chapman and Hall.
Ferreira, M. A. M. (1995) Comportamento transeunte e período de ocupação de sistemas de filas
de espera sem espera, PhD Thesis discussed in ISCTE, Supervisor: Prof. Augusto A.
Albuquerque.
Ferreira, M. A. M. (2001) ‘Mean number of the Customers Served during a Busy Period in the MG Queueing System’, Statistical Review INE, Vol. 3, pp. 33-41.
Ferreira, M. A. M. (2002) ‘Busy Period of Queueing Systems with Infinite Servers and Logistics’,
IMRL 2002 International Meeting for Research in Logistics. Proceedings Vol. 1, pp. 270-274.
Ferreira, M. A. M. (2003) ‘M/G/ Queue Busy Period and Logistics’, APLIMAT 2003.
Proceedings (Part I). pp. 329-332.
Ferreira, M. A. M. (2013) ‘Modelling and Differential Costs Evaluation of a Two Echelons Repair System through Infinite Servers Nodes Queuing Networks’, Applied Mathematical Sciences, Vol. 7, Issue 109-112, pp. 5567-5596.
Ferreira, M. A. M. (2014) ‘MG queue systems in the pandemic period study’, Applied
Mathematical Sciences, Vol. 8, Issue 73-76, pp. 3641-3646.
Ferreira, M. A. M. (2016) ‘Some achievements from a statistical queuing theory research’, Acta
Scientiae et Intellectus, Vol. 2, No. 1, pp. 70-83.
Ferreira, M. A. M. (2017) ‘First order differential equations induced by the infinite servers queue with Poisson arrivals transient behavior probability distribution parameters as time functions’.
16th Conference on Applied Mathematics, APLIMAT 2017. Proceedings pp. 535-544.
Ferreira, M. A. M. (2017a) ‘Unemployment period approach with infinite servers queue systems’,
Journal of Modern Accounting and Auditing, Vol. 13, No. 3, pp. 134-136.
Ferreira, M. A. M. and Andrade M. (2009a) ‘MG Queue System for a particular Collection of Service Time Distributions’, African Journal of Mathematics and Computer Science Research, Vol. 2, No. 7. pp. 138-141.
Ferreira, M. A. M. and Andrade, M. (2009b) ‘The Ties between the MG Queue System Transient Behaviour and the Busy Period’, International Journal of Academic Research, Vol. 1, No. 1, pp. 84-92.
Ferreira, M. A. M. and Andrade, M. (2010a) ‘Algorithm for the Calculation of the Laplace-Stieltjes Transform of the Sojourn Time of a Customer in an Open Network of Queues with a Product Form Equilibrium Distribution, assuming Independent Sojourn Times in each Node’, Journal of
Mathematics and Technology, Vol. 1 No. 4, pp. 31-36.
Ferreira, M. A. M. and Andrade, M. (2010b) ‘M/M/m/m Queue System Transient Behavior’,
Journal of Mathematics and Technology, Vol. 1 No. 1, pp. 49-65.
Ferreira, M. A. M. and Filipe, J. A. (2010a) ‘Solving logistics problems using MG queue systems busy period’, APLIMAT – Journal of Applied Mathematics. Vol. 3, No. 3, pp. 207-212.
Ferreira, M. A. M. and Filipe, J. A. (2010b) ‘Economic crisis: Using MG queue systems busy period to solve logistics problems in an organization’, China-USA Business Review, Vol. 9, No. 9, pp. 59-63.
Ferreira, M.A.M. and Filipe, J.A. (2017) ‘In the search for the infinite servers queue with Poisson arrivals busy period distribution exponential behaviour’, Int. J. Business and Systems Research, Vol. 11, No. 4, pp.453–467.
Ferreira, M. A. M., Filipe, J. A., Andrade, M., Coelho, M. (2012) ‘Using infinite servers queue systems busy period to solve logistics’ problems’, International Journal of Academic Research. Vol. 4, No. 3, PART A, pp. 315-318.
Ferreira, M. A. M., Andrade, M. and Filipe, J. A. (2009) ‘Networks of queues with infinite servers in each node applied to the management of a two echelons repair system’, China-USA Business
Review, Vol. 8, No. 8, pp. 39-45.
Ferreira, M. A. M., Filipe, J. A. and Coelho, M. (2014) ‘Performance and Differential Costs Analysis in a Two Echelons Repair System with Infinite Servers Queues’, Advanced Materials
Research, Vol. 1036, pp. 1043-1048, ModTech 2014 - The Second International Conference on
Modern Manufacturing Technologies in Industrial Engineering; Gliwice; Poland; 13 July 2014 through 16 July 2014.
Filipe, J. A. and Ferreira, M. A. M. (2015) ‘Infinite Servers Queue Systems Busy Period - A Practical Case on Logistics Problems Solving’, Applied Mathematical Sciences, Vo. 9, No. 25, pp. 1221-1228.
Haviv, M. (2016) Queues: A Course in Queueing Theory, Springer. New York. USA.
Kendall, D. G. (1953a) ‘Stochastic processes occurring in the theory of queues and their analysis by the method of the imbedded Markov chain’, Ann. Math. Stat., Vol. 24, No. 3, pp. 338-354.
Kendall, D. G. (1953b) ‚The Analysis of Economic Time-Series-Part I: Prices’, Journal of the
Royal Statistical Society. Series A (General) Vol. 116, No. 1, pp 11-34.
Pollaczek, F. (1930) ‘Ueber eine Aufgabe der Wahrscheinlichkeitstheorie’, Math. Z., Vol. 32, pp. 64-100 and 729-750.
Sathe, Y. S. (1985) ‘Improved Bounds for the variance of the busy period of the MG queue’,
A.A.P., pp. 913 – 914.
Shanbhag, D. N. (1966) ‘On Infinite Servers Queues with Batch Arrivals’, Journal of Applied
Probability, Vol. 3, pp. 274-279.
Takács, L. (1962), An Introduction to queueing theory, Oxford University Press, New York.