Revista Produção Online. Florianópolis, SC, v.12, n. 1, p. 73-90, jan./mar. 2012.
73
ARCHITECTURE PROPOSAL FOR THE USE OF QR CODE IN SUPPLY CHAIN
MANAGEMENT1
PROPOSTA DE ARQUITETURA PARA O USO DE QR CODE NA GESTÃO DA CADEIA DE SUPRIMENTOS
Dalton Matsuo Tavares* E-mail: [email protected] Stella Jacyszyn Bachega** E-mail: [email protected] Glauco Augusto de Paula Caurin*** E-mail: [email protected]
*Instituto Federal de São Paulo, IFSP, Campus São Carlos, SP) *Universidade Federal de Goiás, Campus Catalão, UFG-CAC, Catalão, GO
***Universidade de São Paulo, USP, São Carlos, SP
Abstract: Supply chain traceability and visibility are key concerns for many companies.
Radio-Frequency Identification (RFID) is an enabling technology that allows identification of objects in a fully automated manner via radio waves. Nevertheless, this technology has limited acceptance and high costs. This paper presents a research effort undertaken to design a track and trace solution in supply chains, using quick response code (or QR Code for short) as a less complex and cost-effective alternative for RFID in supply chain management (SCM). A first architecture proposal using open source software will be presented as a proof of concept. The system architecture is presented in order to achieve tag generation, the image acquisition and pre-processing, product inventory and tracking. A prototype system for the tag identification is developed and discussed at the end of the paper to demonstrate its feasibility.
Keywords: QR Code. Tagging. Supply chain management. System architecture. UML.
Resumo: Rastreabilidade e visibilidade na cadeia de suprimentos são preocupações centrais para
muitas empresas. A Identificação por Radiofrequência (Radio-Frequency Identification – RFID) é uma tecnologia que permite a identificação de objetos de uma forma totalmente automatizada por meio de ondas de rádio. Todavia, esta tecnologia possui aceitação limitada e custos elevados. Este artigo apresenta os resultados de uma pesquisa que teve o objetivo de projetar uma solução de controle e rastreamento na cadeia de suprimentos, utilizando o código de resposta rápida (QR Code) como uma alternativa menos complexa e com boa relação custo-benefício para a etiqueta RFID no gerenciamento da cadeia de suprimentos. Uma primeira proposta de arquitetura, usando software de código aberto, é apresentada como uma prova de conceito. A arquitetura do sistema exposta tem a finalidade de propiciar a geração de etiquetas, a aquisição e pré-processamento de imagens, e inventário e rastreamento de produtos. Um sistema protótipo para a identificação de etiquetas foi desenvolvido e discutido ao final do artigo para demonstrar a viabilidade de uma possível implantação.
Palavras-chave: QR Code. Etiquetamento. Gestão da Cadeia de Suprimentos. Arquitetura de
sistema. UML.
Revista Produção Online. Florianópolis, SC, v.12, n. 1, p. 73-90, jan./mar. 2012.
74
1 INTRODUCTION
A supply chain is the system of organizations, people, technology, activities, information and resources involved in moving a product or service from supplier to customer. It includes the flows of materials, information, and finances (HE et al., 2008). Based on the concept of supply chain, the Council of Supply Chain Management Professionals (CSCMP) has expanded the scope of the definition for supply chain management, concerned with the integration of supply and demanded the management within and across companies. So, supply chain management encompasses the planning and management of all activities involved in sourcing and procurement, conversion, and all logistics management activities. It also includes coordination and collaboration with channel partners, which can be suppliers, intermediaries, third-party service providers and customers (CSCMP, 2010).
More and more companies are demanding the track and trace of items and products in their supply chains as it can improve supply chain visibility and efficiency. Track and trace in supply chain can also help prevent counterfeit and theft of products and enhance security. Track and trace in supply chain requires identification of items, capture of events as the items move through supply chain and query of events for the visibility of the items (HE et al., 2008).
Although some international airports have adopted the RFID tag system for transport and secure inspection of luggage to improve the accuracy, the RFID tag is still too expensive when compared to paper based barcode tags. The cost of paper based barcode tags is only the paper and printing ink, which was still cheaper when compared to the price of a radio wave chip based tag in 2008. The cost of this tag was about US$ 2,00, while the passive tag's cost was about US$ 1,00. Although this cost has been considerably reduced with the passing years to something between US$ 0,8 – 0,10 for a passive RFID UHF tag, this value added to the cost of the basic infrastructure of a complete RFID system (e.g. RFID printer, scanner, etc.) is still expensive (HARROP, 2010). Other issue refers to the RFID accuracy when dealing with item tracking, which was fewer than 90% for luggage inspection systems. This and the inherent costs of this kind of system deter its widespread adoption for most airline companies (BI et al., 2008).
Revista Produção Online. Florianópolis, SC, v.12, n. 1, p. 73-90, jan./mar. 2012.
75
fast decoding and easy access to the standard. The use of mobile phones with cameras, to read the barcodes in two dimensions (2-D) for various purposes is currently a popular topic in research and for practical applications. Examples involve applications in airport luggage inspection systems (BI et al., 2008), as assistance for the visually impaired (AL-KHALIFA, 2008) and in augmented reality (AR), as an extension for rendering 3D objects (KAN; TENG; CHOU, 2009).
In general, the information obtained with QR Codes is mainly static. What is obtained is exactly what was coded. In the context of this research, we intend to use a mixed notion of QR Code, in which a public QR Code and private information available in a web server are cross referenced, offering a particular context related to a particular item. Therefore, data like the precedence of the item, its current geographical location (can be obtained by the mobile phone GPS), and so on can be represented in a database in the web server with a timeline if necessary. In this article we will present the draft of the architecture that will enable this system.
The idea involved is “amplifying” a paper based document with electronic information, without modifying the medium format. This method can be applied to printed documents commercially or domestically. This technique is called paper-based augmented reality and it substantially improves the utility of paper (HULL et al., 2007).
In the next sections we present the RFID status today, to enforce the 2-D barcode of choice, the research method used, a proposal for a system architecture that enables augmented reality (AR) using paper based tags and QR Code, a brief introduction to QR Code and the issues concerning the creation and scanning of printed tags. A partial prototype of the tag system will be presented along with some experimental results.
2 RFID IN NUMBERS
The largest database of RFID projects in the world is the IDTechEx RFID Knowledgebase, which currently stands at 4424 case studies in 124 countries. The USA has retained the lead in number of RFID projects but China leapt from number five to number three in the last few years, overtaking Japan and Germany. This is due to the vast number of new RFID projects in China which range from pigs to mail bags and the prospect of having to tag 150 million pet dogs and 2.4 billion pigs yearly by
Revista Produção Online. Florianópolis, SC, v.12, n. 1, p. 73-90, jan./mar. 2012.
76
law. Considering this trend and IDTechEx analysis, East Asia already surpasses Europe in total RFID market by territory (Figure 1) (IDTECHEX, 2011). Detailed market analysis and forecasts can be seen in the complete IDTechEx report RFID Forecasts, Players and Opportunities 2011-2021.
Figure 1 - Total RFID Market by Territory. Pie gives data until 2016.
Source: IDTechEx (2011).
Bottom line is that there is good news and bad news for the printed transistor developers targeting RFID. The bad news is that, in contrast to other applications of printed electronics, highest volume RFID is all about tag cost. Certainly, none of the increasing number of developers of zinc oxide printed transistors is targeting RFID as first priority as they see their applications of high current and transparency as more significant in photovoltaic’s and displays. Tag cost is 50-60% of total system cost in highest volume RFID so cost is the key parameter overall, particularly for highest volume (HARROP, 2010).
The good news is that fully printed RFID can be one tenth or less of the cost of the conventional silicon chip based tag. In the long term it will be printed directly onto things like 85% of barcodes today, saving the label cost and getting RFID down to maybe one hundredth of the cost of the conventional RFID tag. IDTechEx indicated that the printed RFID labels entering volume production in 2010 had a market potential of at least tens of billions yearly. Ones eventually printed directly onto things, no label being needed, have potential of 100 billion to one trillion yearly in consumer packaged goods, healthcare, postal and other applications (HARROP, 2010).
Revista Produção Online. Florianópolis, SC, v.12, n. 1, p. 73-90, jan./mar. 2012.
77
grow but a good deal of research still remains to be done and material prices need to drop before printed tags can be offered commercially – and before they can be printed directly onto packaging. However, once these two milestones are achieved – at a reasonable price – some believe that RFID tagging will one day become pervasive throughout supply chains for almost every type of good (SCHIFFNER, 2011).
Considering the short term acceptance of the technology in other markets besides the above mentioned (Figure 1), the use of RFID is not encouraging. In Brazil, the RFID initiatives are bound to efforts in experimentation, acquisition of knowledge and use of new technology. The difficulties in RFID implementation are not determinant nor are the financial costs in its adoption, and this is noticed mainly near the implementation phase. Likewise, the analysis in Pedroso, Zwicker and Souza (2009) proves that for a pool of enterprises researched, the application and benefits expected didn't prove meaningful enough to justify the use of the technology.
3 METHOD
The research nature is applied research (BARROS; LEHFELD, 2000) and the scientific explanation is hypothetical-deductive (CARVALHO, 2000). Besides, the research approach is qualitative (BRYMAN, 1989) and the research procedure is theoretical-conceptual (BERTO; NAKANO, 1998, 2000). We verified the difficulties of adoption of the RFID based system in Brazilian enterprises and devised a new system in order to facilitate an easier and accessible way of tracking items. Our proposal is less complex regarding the deployment of the system and its configuration. Although the cost was not an issue according to Pedroso, Zwicker and Souza (2009), the system is also cost-effective, fact that may encourage SMEs to test and eventually adopt it.
Considering the Brazilian scenario regarding the adoption of RFID, according to Pedroso, Zwicker and Souza (2009), it seems the strategic and technical difficulties are meaningful while the financial aspects are not considered. This may be due to the size of the enterprises researched (the annual revenues are in the range of US$ 100 Million to US$ 1 Billion). Therefore, we can assume the scope of small and medium enterprises (SMEs) are not included here.
Revista Produção Online. Florianópolis, SC, v.12, n. 1, p. 73-90, jan./mar. 2012.
78
The technical difficulties arise when the enterprises need to implement the RFID system in its entirety, including the interface with the management systems (Figure 2).
Figure 2 - RFID based system.
Source: Pedroso, Zwicker and Souza (2009).
The main hypothesis considers if a reduction in the complexity of the tagging system, in this case, the RFID system, would result in a motivator for the adoption of the proposed system. The proposed system would also reduce the implementation cost of the overall system, considering the tags can be printed on the item or in plain paper (this is not a technical drawback as we have seen in section 2 for the RFID tags).
To implement this system, the main contribution is behind the use of open source software (OSS) as an enabling and value adding technology. Open source refers to software that we may freely use, modify, or distribute, provided we observe certain restrictions with respect to copyright and protection of its open source status. OSS is not freeware and generally has a copyright. Not using OSS today somewhere along the product life cycle or as a technology basis is hardly an option – be it for commercial, engineering, or quality reasons. Consequently, most technologies and products have created their own specific ecosystems with dedicated vendors, users, developers, testers, integrators, and service suppliers (EBERT, 2009).
The approach chosen to implement the tag system is the development of a prototype. In the past, the developed system was normally thought of as inferior in
Revista Produção Online. Florianópolis, SC, v.12, n. 1, p. 73-90, jan./mar. 2012.
79
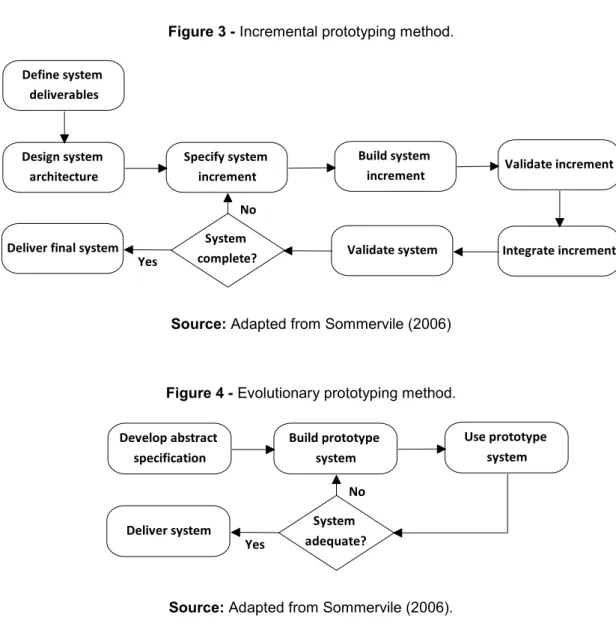
some way to the required system so further development was required. Now, the boundary between prototyping and the normal system development is blurred and many systems are developed using an evolutionary approach. According to Sommervile (2006), the variants of software prototyping are evolutionary prototyping, throwaway prototyping, incremental prototyping and extreme prototyping.
Evolutionary prototyping is the approach to system development where an initial prototype is produced and refined through a number of stages to the final system. Throw-away prototyping is usually a practical implementation of the system produced to help discover requirement’s problems and then is discarded. The system is then developed using some other development process. In incremental prototyping the final product is built as separate prototypes. At the end, the separate prototypes are merged in an overall design. Extreme prototyping, as a development process, is especially used for developing web applications. Basically, it breaks down web development into three phases, each one based on the preceding one. The first phase is a static prototype that consists mainly of HTML pages. In the second phase, the screens are programmed and fully functional using a simulated services layer. In the third phase the services are implemented. The process is called Extreme Prototyping to draw attention to the second phase of the process, where a fully-functional user interface (UI) is developed with very little regard to the services other than their contract.
For this project we used a mixture of methods, considering the evolutionary prototyping and the incremental prototyping. The system is planned to be developed and delivered in increments after establishing an overall architecture requirement and specifications (Figure 3). Users may experiment with delivered increments while others are being developed. Each increment will be submitted to an evolutionary prototyping approach in order for it to achieve its maturity (Figure 4).
Revista Produção Online. Florianópolis, SC, v.12, n. 1, p. 73-90, jan./mar. 2012.
80
Figure 3 - Incremental prototyping method. Define system
deliverables
Design system architecture
Specify system
increment Validate increment
System
complete? Validate system Integrate increment
Deliver final system
Build system increment No
Yes
Source: Adapted from Sommervile (2006)
Figure 4 - Evolutionary prototyping method. Develop abstract specification Build prototype system System adequate? Deliver system Use prototype system No Yes
Source: Adapted from Sommervile (2006).
The incremental prototyping method (Figure 3) considers the definition of system deliverables, the design of the system increments and the building of the system increment. From this point, a validation process is started until the system is complete and can be considered as the final system. For this paper, we consider the method only until the building stage. The validation of the system will demand its practical implementation in the factory floor or a test system.
For each increment defined in the overall architecture, the evolutionary prototyping will be applied. With this method we can start the development of each increment building a mockup and using it. By the use of the mockup we can test it until it matures in the final system. The first stages of development and testing of the tag system will be presented in section 4.
Revista Produção Online. Florianópolis, SC, v.12, n. 1, p. 73-90, jan./mar. 2012.
81
4 SYSTEM ARCHITECTURE
The system can obtain embedded information in a QR Code and display it in a web page. This information consists at least in a Uniform Resource Locator (URL) containing the address of an item profiling web server and the ID of the item to be tracked. Therefore, using this ID it is possible to access any useful information about a specific item via Transmission Control Protocol/Internet Protocol (TCP/IP) networks and hypertext transfer protocol (http).
The system architecture is illustrated in a Unified Modeling Language (UML) use case diagram in Figure 5.
Figure 5 - UML use case diagram for the item tracker system.
The key concepts associated with the use case model are actors and use cases. The users and any other systems that may interact with the system are represented as actors. The required behavior of the system is specified by one or more use cases, which are defined according to the needs of the actors. Each use case specifies some behavior, possibly including variants, that the system can perform in collaboration with one or more actors (ALMENDROS-JIMÉNEZ;
Revista Produção Online. Florianópolis, SC, v.12, n. 1, p. 73-90, jan./mar. 2012.
74
IRIBARNE, 2005).
The actors of the system are:
Operator: the human operator. Its primary task is to create or customize item tags according to a specified format standard. He/she creates a tag when an item is presented to the system or customizes it when an item suffers any kind of modification, although the tag is designed not to need modifications. All the information present in the tag is customizable, considering its format is respected. Operators also scan tags to acquire item details when needed.
Identifier: standard scanning and identification module. This module is responsible for acquiring the tag information. It can be automatic, e.g. using a camera with the recognition software embedded, located in some key point to scan items in batch, or it can be manual, embedded in a handset and operated by an operator.
Corporative network: the communication medium responsible for conveying the identified information. Most likely it will be a TCP/IP network.
Profile manager: server responsible for receiving an http request and provide an item description. The interface presented for the operator can allow the creation of a new item or the update of details for a known item (e.g. its current location, quantity etc). The information available in the profile manager can be used to keep historical records and to show tracking information for a given item.
The specified use cases are:
Create tag: the operator can create a tag for a given item.
Customize tag: the tag is configured with information such that it changes seldom (or don't change at all – e.g. a tag identifier, the link for the item details in the profile manager). However, if the change is needed, the operator can configure the tag fields at any time and generate a new tag reflecting the current item's status. Position: The handset must be positioned by the operator accordingly for each
tag it will scan, so it can identify the tag correctly. The automated camera must be positioned only once, on the initial system set up. We emphasize the position procedure is very simple considering the nature of the tag used (QR Code).
Identify tag: the identifier is responsible for identifying a tag. This device can be a handset with the ability to scan a tag or a camera with embedded software to scan batches of items.
Revista Produção Online. Florianópolis, SC, v.12, n. 1, p. 73-90, jan./mar. 2012.
75
Send tag: the tag identified by the identifier contains the URL and an item identifier. The URL is responsible for the connection with the profile manager and the item identifier is the search key to find the item in the database.
Receive tag: the tag information sent by the identifier is received by the profile manager so it can display required information or interact with the user in a useful way (update of historical record, supplier information, tracking information etc.). Search database: when the http request is received, the profile manager looks for
the appropriate entry in a database based on the item identifier. If the entry exists, the information is presented, otherwise, a set of actions is displayed (create a new item or other customized search parameters are presented).
Manage item: for a given item, not present in the system, the profile manager can insert it in the local database. If an item concluded its life cycle on the system it can be removed from the system. Its entry can be kept for log purposes if necessary. Otherwise, item features can be updated.
Update history: responsible for updating the tracking history of an item in the supply chain.
Considering the standard RFID system presented in Figure 2, the setup of the proposed system is much simpler (Figure 6). Compared to the RFID system, we have less failure points (e.g. the antenna, the reader/interrogator, the RFID tag). The proposed system is software oriented considering its setup implies basically in the configuration/installation of the profile manager, the insertion of items and the generation of the paper based tags. From this point on, the tracking is done considering the communication of the reader (i.e. handset of fixed camera) and the profile manager.
Revista Produção Online. Florianópolis, SC, v.12, n. 1, p. 73-90, jan./mar. 2012.
76
Figure 6 – Proposed paper based tag system architecture.
The information kept in the profile manager is considered dynamic in nature (it can change over time), while the information kept on the paper based tag is less prone to change (i.e. item identification and profile manager URL). In the future we intend to test the system integration with management systems (step 4 in figure 6). As a proof of concept, the next sections will present the standard barcode chosen, the format of the tag and a preliminary implementation of the reader based on OSS. We will also present the first research results concerning the implementation of the profile manager.
5 BARCODE OF CHOICE – QR CODE
Barcodes of one dimension (1-D) are quite popular and universally recognized due to its reading speed, accuracy and functional features. However, the need to store more information in printed barcode in limited spaces, favors the use of bi-dimensional (2-D) barcodes. They can be used to access data and services like a time table for buses, product information, etc. Figure 7 shows the same information coded as an EAN-13 barcode (left) and as a QR Code (right). The word “QR Code” is a trademark of DENSO WAVE INCORPORATED in the following countries: Japan, United States of America, Australia and Europe.
Revista Produção Online. Florianópolis, SC, v.12, n. 1, p. 73-90, jan./mar. 2012.
77
Figure 7 - Comparison of 1-D barcode and 2-D barcode using QR Code
There are a huge number of 2-D barcode standards available and devised specifically for camera recognition. Some of them are based on open standards while others are proprietary like Semacodes, Spotcodes, Rohs' VisualCodes, ColorCode, CyberCode, MobileTag, VeriCode, ShotCode, eZcode, HotScan, Codablock F, Aztec, FP Code (Fine Picture Code – Fujitsu) and Bee Tagg (ConnVision) (DWI, 2010).
PDF417 (Portable Data File) and MaxiCode are used under the Automatic Identification Manufacturers (AIM) international standard and the International Organization for Standardization (ISO). The two most recognized 2-D barcode standards are the DataMatrix (ISO/IEC 16022:2000) and QR Code (ISO/IEC 18004:2000). There isn't a license fee for the use of DataMatrix or QR Code. Although the comparison between these standards reveal the superiority of DataMatrix (except for Japanese Kanji encoding), the QR Code is the most commonly accepted in Asia, particularly in Japan (ROUILLARD, 2008).
The preference for the QR Code is in great part due to the availability of the specification and the fact that Denso Wave does not practice their patent. The license for using the QR Code stipulated by the Japanese Industrial Standards (JIS) and ISO are not necessary.
5.1 Size, orientation and error correction
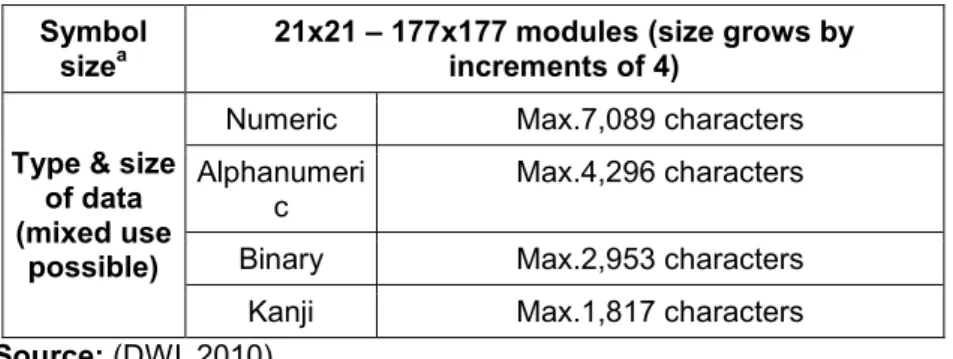
While standard 1-D barcode can store at most about 20 digits, QR Code can deal with hundreds of times this amount of information (DWI, 2010). The QR Code can deal with all kinds of data, like numeric, alphanumeric characters, Kanji, Kana, Hiragana symbols, binary and control code. The available versions range from 1-40, with a maximum variation in size as shown in Table 1. Considering QR Code can store information in two axis (horizontal and vertical), it can code the same amount of data in approximately one tenth of the size of a conventional barcode.
Revista Produção Online. Florianópolis, SC, v.12, n. 1, p. 73-90, jan./mar. 2012.
78
Table1-QR CODE OUTLINE SPECIFICATION Symbol
sizea
21x21 – 177x177 modules (size grows by increments of 4)
Type & size of data (mixed use
possible)
Numeric Max.7,089 characters Alphanumeri
c
Max.4,296 characters Binary Max.2,953 characters Kanji Max.1,817 characters
Source: (DWI, 2010).
In a QR Code, there are three large square patterns in the three corners of the code surrounded with white bars. These three square patterns are used for position detection. In version 2 (and above) of QR Code, an additional square is used to align the QR Code as shown in Figure 8. The other area of QR Code consists of a number of small blocks which are used to encode the embedded information. There are several different error correction levels for a QR Code as listed in Table 2. Typically, higher correction level indicates that it allows more blocks in the code to be destroyed, and often this will result in a longer code with larger QR Code size (KAN; TENG; CHOU, 2009).
Figure 8 - QR Code structure
Source: Kan, Teng and Chou (2009).
Thanks to the three identifying position patterns, QR Code is capable of an omnidirectional reading of 360 degrees. This feature is important considering the easy handling of the handset by an operator. Besides, these patterns guarantee stability and high speed reading, bypassing the negative effects of background interference.
Revista Produção Online. Florianópolis, SC, v.12, n. 1, p. 73-90, jan./mar. 2012.
79
TABLE 2 - Levels of error correction in QR Code.
Error correction (data recovery)b
Level L Approx. 7% of codewords can be restored. Level M Approx. 15% of codewords can be restored. Level Q Approx. 25% of codewords can be restored. Level H Approx. 30% of codewords can be restored. Structured
append Max. 16 symbols
Source: (DWI, 2010).
Other fundamental feature is the error correction capability. The data from a tag can be restored even if the barcode is partially dirty or damaged. A maximum of 30% of codewords can be rebuilt.
A QR Code symbol can be divided in up to 16 symbols, allowing the printing in a narrow area. Therefore the content of one barcode symbol can span across multiple symbols.
Once determined the symbol version and the error correction level, the actual size of the QR Code depends on the size in mm2 of the module (a square area containing the QR Code). For a greater module size, we achieve a better stability and ease of reading with a QR Code scanner. On the other hand, a bigger printing area is necessary. Therefore, it is necessary to determine the size of each tag after considering all the relevant factors. It is recommended to print the QR Code barcode as big as possible inside the available printing area.
The barcode area of the QR Code demands a margin or “quiet zone”. The margin is a clean area around the barcode where nothing is printed. It has a length of four modules in all sides of the barcode (Figure 9).
Revista Produção Online. Florianópolis, SC, v.12, n. 1, p. 73-90, jan./mar. 2012.
80
Figure 9 - Four-module wide margin is required around a symbol.
Source: DWI (2010).
Denso Wave website provides an example to calculate the total QR Code area, including the margin. For this example, consider a QR Code with 50 alphanumeric characters, and perform the following steps (DWI, 2010):
1. Determine the error correction level as “M” (can be modified by the user); 2. Specify the version and maximum data size from QR Code version table and
cross reference the alphanumeric characters and the level M. Version 3 is able to store 50 or more characters (version 2, with level M store only 38 characters);
3. Use a printer with 400 dpi resolution. This results in 0.254 mm when printed in a 4 dot configuration (25.4 mm/in ÷ 400 dpi × 4 dots/module = 0.254 mm/module);
4. Version 3 = 29 modules. Therefore, the size of the QR Code is 29 modules × 0.254 mm/module = 7.366 mm;
5. Secure a margin of size 7.366 mm + 0.254 mm/module × 8 modules = 9.398 mm.
5.2 Resolution and scanning device
Other important issue regards the printer resolution. The size of the module to be printed with a thermal printer depends on the number of dots in the printing head. For example, if the printer head density is 300 dpi and each module is comprised of 5 dots, the size of the module is 0.42 mm2. Increasing the number of dots improves the printing quality, avoids printing width or paper feed speed fluctuations, distortion of axis, blurring, etc., and enables more stable operations. It is recommended to ensure more stable operations that each module is comprised of four or more dots (Figure 10). The relationship between the printer and the size of the modules is presented in
Revista Produção Online. Florianópolis, SC, v.12, n. 1, p. 73-90, jan./mar. 2012.
81
Table 3.
The appropriate tag scan has its own size limit for the module. The resolution of the scanner represents this limit. For instance, if the QR Code symbol is printed in 600 dpi, using a 4 dot printer, the size of the module is 0.17 mm. A scanner with resolution below 0.17 mm is necessary to read this symbol. The printing in a limited area with a major printing head density may prove useless if the scanner reading limit is exceeded. It is a good practice to determine the scanner to be used before determining the module size.
Figure 10 - Size of the module considering the printing head resolution.
Source: DWI (2010)
TABLE 3 - Printer and module size relationship
Printer density Head config. 4 dot config. 5 dot config. 6 dot
Laser 600 dpi (24dot/mm) 0.17 mm 0.21 mm 0.25 mm 360 dpi (14dot/mm) 0.28 mm 0.35 mm 0.42 mm 300 dpi (12dot/mm) 0.33 mm 0.42 mm 0.5 mm
Thermal (8dot/mm) 200 dpi 0.5 mm 0.63 mm 0.75 mm
Source: DWI (2010) 5.3 Content format
Until now we have focused on the 2-D barcode standard and format. Another important matter is the information encoded in the QR Code.
The 2-D barcodes generally encode text, but this text can have various meanings. Commonly, the 2-D barcode encode text that represents URLs. This is a special text string, because it is recognized as a URL by the readers, and therefore, it
Revista Produção Online. Florianópolis, SC, v.12, n. 1, p. 73-90, jan./mar. 2012.
82
can be parsed accordingly (e.g. the reader can open it in a navigator).
The 2-D barcodes can encode various types of text with related actions. Text representing contact information, when recognized can activate an application to add the contact to an address book. This only works because the readers understand the encoded text as contact information. To do so, there are standards, de facto or not, available. For the context of this paper, the definitions for telephone numbers, sms or mms cell phone messages, etc. are ignored due to their simplicity and the lack of an URL entry point. The standards of interest for de scanner are the URL and contact information as specified in BC (2011).
The URL is the most common application for 2-D barcode. To do so, it is necessary to encode explicitly the URL in the barcode, including the protocol (“http://”), to ensure the recognition of the encoded text as a URL. The expected behavior is the opening of the URL in a web browser by the reader. It is desirable that the reader, for security reasons, show the URL first and allows the operator to choose if it is secure to access it or not.
A most complete type of message to be encoded is the vCard format to store the whole contact information. The problem is that this format is too verbose to use with a 2-D barcode.
NTT DoCoMo, a Japanese mobile phone operator has a popular and compact format called “MECARD” to encode contact information (NTTDOCOMO, 2010). For instance, to encode the name John Doe, in the address Hong Kong Polytechnic University, phone number +556699995444; email [email protected], it would be necessary to encode the message as presented in Table 4.
Table 4 - Syntax of the MECARD message as proposed by NTT DoCoMo.
MECARD:N:John Doe; ADR:Hong Kong Polytechnic University;TEL:+556699995444;EMAIL:johndoe@unkn own.org;;"
The expected behavior for the readers is to open a new entry in the address book, populate it with the identified data and supply the user with the choice to add a new contact.
Revista Produção Online. Florianópolis, SC, v.12, n. 1, p. 73-90, jan./mar. 2012.
83
6 EXPERIMENTAL RESULTS
To implement the scanning device, the following hypotheses were considered: The equipment should be easy to handle from the operator point of view;
Its implementation should be based in OSS in order to simplify the portability and source code access for the barcode recognition software. Therefore it can be platform independent;
The recognition hardware should be able to read the standard used to encode the tags.
Considering the prerogatives presented and the wide acceptance of QR Code in mobile platforms like mobile phones, the experimental testbed chosen was a Google G1 smartphone, with the Android OS (Figure 11).
Figure 11 - Device chosen to implement the scanner.
The main features of the hardware presented in Figure 10 is a 3.2 inch display (8.1 cm) TFT-LCD, an ARM-based Qualcomm processor MSM7201A, dual-core CPU/GPU, a sliding keyboard with 3.2 megapixel camera with auto focus, wi-fi (802.11b/g) and Bluetooth (2.0+EDR) connectivity.
There is no restriction regarding the hardware platform, considering mobile phones today have a near configuration. The only demand is the execution of a Java virtual machine and a camera with enough definition to recognize the tag. This is a necessary restriction to execute the recognition software and to perform the tag identification accordingly. The auto focus feature is desirable but it isn't a pre-condition
Revista Produção Online. Florianópolis, SC, v.12, n. 1, p. 73-90, jan./mar. 2012.
84
to the software execution.
The resolution of the camera was calculated considering Table 5. Given the minimum size of the tag (version 1 and a size of 0.5 cm2) and its maximum size (version 40 and a size of 3.3 cm2) and a printer with resolution of 600 dpi, a camera with 2.0 megapixels is enough.
TABLE 5 - Relationship of megapixels and printing area
Megapixel
s Printing area (inches)
2.0 4x6 [standard] 3.0 5x7 4.0 8x10 5.0 9x12 6.0 11x14 8.0 12x16 Source: Digicamguides (2010).
The results were obtained following the same procedure shown in Section 5.1 and the specification of Table 3. The quiet zone was considered for the calculation. 6.1 Tag creation
To create the tags we have to consider the message specification to be encoded and QR Code standard (version and level of error correction). Considering the message specification there are two possibilities: the composition of a URL leaving all the item features to the profile manager or the composition of an entry containing contact information (Section 5.3). NTT DoCoMo's MECARD was chosen, because it can store the URL as part of a more complex message. This offers some additional features which allow the operator take some rapid actions. For instance, if the operator detects a problem in the item or batch of items, it can gather information on the manufacturer (e.g. name, phone number, address, etc.) simply by scanning the tag. If necessary, more detailed information is available in the profile manager.
To create the tag, the developer of the recognition software has an automated tool (ZXING, 2010). Other possibility is the use of the qrencode tool (LIBQRENCODE, 2010). In both cases, the result is enough to create a readable tag. Using the command line software qrencode, it is possible to specify, for instance, the version of
Revista Produção Online. Florianópolis, SC, v.12, n. 1, p. 73-90, jan./mar. 2012.
85
the QR Code and the level of error correction, which are the key parameters in the specification of the generated symbol. The default values are 3 for the version (up to 77 alphanumeric characters) and L for the error correction.
An example of command line using the qrencode software is presented in Table 6. This entry uses the MECARD standard as presented in Table 4. Besides, it was possible to add the URL to access the item specification in the profile manager.
TABLE 6 - Syntax of the MECARD message as proposed by NTT DoCoMo. qrencode -l L -v 1 -o output.png "MECARD:N:John
Doe;TITLE:Student;ORG:Hong Kong Polytechnic University;ADR:Hong Kong Polytechnic
University;TEL:+556699995444; EMAIL:
[email protected];URL:http://www.ise.polyu.edu.h k/scmis2010/index.html;;"
Source: Digicamguides (2010) 6.2 Tag recognition
To recognize the tags, a little compendium of the available software was made based on QRCR (2011). The software KAYWA Reader, Nokia Reader, i-nigma Reader, UpCode, QuickMark, BeeTagg, NeoReader, ScanLife, ZXing were briefly researched. From these, the choice is almost indifferent. Issues regarding availability, software portability and eventual software customization must be considered.
Regarding the availability, almost all the researched tools are available for download, except Glass from Active Print, which wasn't available by the time of conclusion of this paper. Considering the portability issue, Nokia Reader is obviously a solution bound to Nokia phones. KAYWA Reader, UpCode, QuickMark, NeoReader are all good barcode scanners, but the software is proprietary. I-nigma Reader, BeeTagg and ScanLife cover a more broad application spectrum, which includes the business plan for the integration of barcodes in enterprises. This can be translated into marketing campaigns to incorporate the new medium. Their software is also proprietary.
Considering the source code access and the possibility of customization afterwards, there are only two choices: ZXing and Glass. ZXing is a barcode recognition library implemented in Java, making it highly portable and configurable by a software developer.
Revista Produção Online. Florianópolis, SC, v.12, n. 1, p. 73-90, jan./mar. 2012.
86
chosen to implement the handset. ZXing (pronounced “Zebra Crossing”) is a library divided in various components that are being actively supported. Meaningful to this paper are the barcode generator and the Android application Barcode Scanner, which can be downloaded freely via Android Market (Figure 12).
Figure 12 - Software Barcode Scanner used to implement the handset. (a) Availability via Android
Market. (b) Software installation. (c) Software in action
(a) (b) (c)
The barcode generated with the command presented in Table 6 is presented in Figure 13. Independent from the QR Code orientation, the tag recognition is correctly performed. Using the MECARD format (Table 4), it is possible to store the contact information regarding the organization/person responsible for the item or batch of items. Barcode Scanner recognizes the MECARD format and enables actions like add contact, show the address of the contact in Google Maps (show map), dial a phone number (dial number) or send an e-mail (send e-mail). Besides, the stored URL allows the connection to a web server that will host the item profile manager.
Revista Produção Online. Florianópolis, SC, v.12, n. 1, p. 73-90, jan./mar. 2012.
87
7 CONCLUSIONS
The main contribution of this paper is the conceptual architecture for a track and trace system with low complexity and cost-effective when compared to RFID systems. This system was designed to track products/items in their supply chains. As a proof of concept, the first steps for the implementation of the system were presented.
Considering the practical applications in productive sectors, these can be envisioned analogous to RFID systems. In section 1, there are applications in the field of track and trace of items and products intended to improve the visibility and efficiency. Besides, applications for improving security are foreseen to avoid theft and counterfeit of products. In this context, the use of a 64 or 128 bit encryption keys could act as a prevention mechanism to avoid the forgery of products (considering the content of the QR code tag is encrypted). Questions concerning the identification of items and the searching for events could be implemented in the context of the profile manager as part of the history function, improving the visibility of products and behavior analysis in the supply chain. Considering scenarios with the massive use of tags (e.g. luggage inspection systems), a QR code based system is cost-effective when compared to RFID systems. Nevertheless, the accuracy of the proposed QR code system has to be evaluated in future works.
The system was devised using the incremental prototyping method. We also used the evolutionary prototyping method in order to achieve stability for the chosen increment of the system by means of a limited number of system buildings and evaluation of the current version of the system.
We started the implementation of the first increment of the system; in this case, the reader for the QR code tags. To achieve this, the paper based standard for the tag was chosen and the first module partially implemented. This module allows the recognition of items (individually or in batch) using a simple, cost-effective and robust tag recognition system. In this sense, the QR code allows the symbol recognition independent of orientation. ZXing library and recognition software was tested using a smartphone and proved to be efficient. This is the first step in order to devise the final version of the software considering the implementation of the connection for the item database.
Revista Produção Online. Florianópolis, SC, v.12, n. 1, p. 73-90, jan./mar. 2012.
88
The second increment implemented was part of the profile manager. We started the research for tag creation and customization. The software considering here was the qrencode tool. We achieved a recognizable tag according to the MECARD format.
After testing the proposed increments against the abstract specification established, we achieved a current usable state for the QR code reader and the profile manager (regarding creation/customization of tags). Besides, the software was implemented using OSS in order to validate the experimental system architecture.
As future work, the authors intend to validate the system, by means of field tests, with volunteer enterprises. This task is intended for the second semester of 2012. Secondly, we intend to incorporate the idea of geographical information systems (GIS) as part of the architecture. This will allow the possibility to show contact information or product last location in the map (e.g. Google Map).
REFERENCES
AL-KHALIFA, H. S. Utilizing QR Code and Mobile Phones for Blinds and Visually Impaired People. In: Lecture Notes in Computer Science, v. 5105/2008, Springer Berlin, Heidelberg, 2008, p. 1611-3349.
ALMENDROS-JIMÉNEZ, J. M.; IRIBARNE, L. Designing GUI components from UML Use Cases. Proceedings… 12th IEEE International Conference and Workshops on the Engineering of Computer-Based Systems (ECBS’05), pp. 1-8, 2005.
BARROS, A. J. S. e LEHFELD, N. A. S. Fundamentos de Metodologia: Um Guia para a Iniciação Científica. 2 ed. São Paulo: Makron Books, 2000.
BC. Barcode contents, Sep. 30, 2011. [Online]. Available:
http://code.google.com/p/zxing/wiki/BarcodeContents. [Accessed: Dec. 13, 2011]. BERTO, R. M. V. S.; NAKANO, D. N. A produção científica nos anais do encontro nacional de engenharia de produção: um levantamento dos métodos e tipos de pesquisa. Produção, v. 9, nº 2, p. 65-75, jul. 2000.
BERTO, R. M. V. S.; NAKANO, D. N. Metodologia da pesquisa e a engenharia de produção.In: XVIII Encontro Nacional de Engenharia de Produção (ENEGEP) e IV International Congress of Industrial Engineering (ICIE), 1998, Niterói, RJ.
Anais...Niterói: UFF/ABEPRO, out. 1998. 1 CD-ROM.
BI, L.; FENG, Z.; LIU, M.; WANG, W. Design and Implementation of the Airline Luggage Inspection System Base on Link Structure of QR Code.
Proceedings…International Symposium on Electronic Commerce and Security, p.527-530, 2008.
Revista Produção Online. Florianópolis, SC, v.12, n. 1, p. 73-90, jan./mar. 2012.
89
BRYMAN, A. Research methods and organization studies. London: Uniwin Hyman, 1989. 224 p.
CARVALHO, M. C. M. de. A Construção do Saber Científico: Algumas Proposições. In: CARVALHO, M. C. M. de (org.) Construindo o Saber. 2. ed. Campinas, SP. Papirus. p.63-86 2000.
CSCMP. Council of Supply Chain Management Professionals, “Definition of logistics management.,” Council of Supply Chain Management Professionals, 2000-2010. [Online]. Available: http://cscmp.org/aboutcscmp/definitions.asp. [Accessed: Dec. 13, 2011].
DIGICAMGUIDES. Megapixels. [Online] Available:
HTTP://WWW.DIGICAMGUIDES.COM/LEARN/MEGAPIXELS.HTML. [Accessed: Dec. 13, 2011].
DWI. Denso Wave Incorporated, QR Code.com, 2000-2009. [Online]. Available: http://www.denso-wave.com/qrcode/index-e.html. [Accessed: Dec. 13, 2011]. EBERT, C. Guest Editor's Introduction: How Open Source Tools Can Benefit Industry, IEEE Software, v. 26, no. 2, p. 50-51, Mar./Apr. 2009.
HARROP, P. Country: WorldWide Printed RFID in 2010. [Online]. Available: http://www.printedelectronicsworld.com/articles/printed_rfid_in_2010_00001961.asp. [Accessed: Dec. 13, 2011].
HE, W.; ZHANG, N.; TAN, P.S.; LEE, E.W.; LI, T.Y.; LIM, T.L. A Secure RFID-based Track and Trace Solution in supply chains. Proceedings…The 6th IEEE
International Conference on Industrial Informatics, pp. 1364-1369, 2008.
HULL, J. J.; EROL, B.; GRAHAM, J.; KE, Q.; KISHI, H.; MORALEDA, J.; VAN OLST, D. G. Paper-Based Augmented Reality. Proceedings… 17th International
Conference on Artificial Reality and Telexistence 2007, pp. 205-209, 2007. IDTECHEX. RFID Forecasts, Players and Opportunities 2011-2021 - Sample. [Online]. Available: http://www.idtechex.com/knowledgebase/en/. [Accessed: Dec. 9, 2011].
KAN, T.-W.; TENG, C.-H.; CHOU, W.-S. Applying QR Code in Augmented Reality Applications. Proceedings… 8th International Conference on Virtual Reality Continuum and its Applications in Industry, pp. 253-257, 2009.
LIBQRENCODE. Libqrencode. [Online] Available:
http://megaui.net/fukuchi/works/qrencode/index.en.html. [Accessed: Dec. 13, 2011]. NTTDOCOMO. Phonebook Registration. [Online] Available:
http://www.nttdocomo.co.jp/english/service/imode/make/content/barcode/function/ap plication/addressbook/index.html [Accessed: Dec. 13, 2011].
PEDROSO, M. C.; ZWICKER, R.; SOUZA, C. A. Adoção de RFID no Brasil: um estudo Exploratório, Revista de Administração Mackenzie, vol. 10, no. 1,
Revista Produção Online. Florianópolis, SC, v.12, n. 1, p. 73-90, jan./mar. 2012.
90
http://www3.mackenzie.br/editora/index.php/RAM/article/viewFile/378/216. [Accessed: Dec. 13, 2011].
QRCR. QR-Code readers, Jan. 5, 2011. [Online]. Available: http://www.mobile-barcodes.com/qr-code-software/. [Accessed: Dec. 13, 2011].
ROUILLARD, J. Contextual QR Codes. Proceedings… Third International Multi-Conference on Computing in the Global Information Technology, pp. 50-55, 2008. SCHIFFNER, B. Understanding RFID Print Technology. [Online]. Available: http://sdgmag.com/article/specialty-imaging/understanding-rfid-print-technology [Accessed: Dec. 13, 2011].
SOMMERVILE, I. Software Engineering. 8th edition. Addison Wesley, 2006. ZXING. ZXing Project. [Online]. Available: http://zxing.appspot.com/generator/ [Accessed: Dec. 13, 2011].