MELINA COELHO DA SILVA
EVOLUTION OF DESMOSOMAL GENES IN TELEOST FISH AND EXPRESSION
ANALYSIS OF DESMOSOMAL CADHERINS IN THE GILTHEAD SEA BREAM
(Sparus aurata)
UNIVERSIDADE DO ALGARVE
Faculdade de Ciências e Tecnologias
MELINA COELHO DA SILVA
EVOLUTION OF DESMOSOMAL GENES IN TELEOST FISH AND EXPRESSION
ANALYSIS OF DESMOSOMAL CADHERINS IN THE GILTHEAD SEA BREAM
(Sparus aurata)
Mestrado em Biotecnologia
Trabalho efetuado sob orientação de: Dr.ª Deborah M Power Dr.ª Katerina A Moutou Co-orientador Dr. João CR CardosoUNIVERSIDADE DO ALGARVE
Faculdade de Ciências e Tecnologias
EVOLUTION OF DESMOSOMAL GENES IN TELEOST FISH AND EXPRESSION
ANALYSIS OF DESMOSOMAL CADHERINS IN THE GILTHEAD SEA BREAM
(Sparus aurata)
Declaração de autoria de trabalho
Declaro ser a autora deste trabalho, que é original e inédito. Autores e trabalhos consultados estão devidamente citados no texto e constam da listagem de referências incluída.
Indicação de «Copyright»
A Universidade do Algarve reserva para si o direito, em conformidade com o disposto no Código do Direito de Autor e dos Direitos Conexos, de arquivar, reproduzir e publicar a obra, independentemente do meio utilizado, bem como de a divulgar através de repositórios científicos e de admitir a sua cópia e distribuição para fins meramente educacionais ou de investigação e não comerciais, conquanto seja dado o devido crédito ao autor e editor respetivos.
I
Acknowledgments/Agradecimentos
First of all, I would like to thank Professor Deborah Power for the opportunity to embark on this project and for her guidance.
Secondly, to Professor Katerina Moutou for the hospitality and constant support on this project. Also a big ευχαριστώ to everybody from the Laboratory of Genetics, Comparative and Evolutionary Biology from the University of Thessaly.
Às minhas coleguinhas, Ana L. e Catarina, tudo de bom para vocês, está?
Um obrigada à minha família e amigos, com destaque especial à minha mãe, à minha prima Élodie e às minhas amigas Andreia, Diana e Margarida.
Quero agradecer também à boa companhia e ajuda do pessoal do laboratório de Endocrinologia Comparativa e Biologia Integrativa do CCMAR. Obrigada à Rita Costa pela ajuda com a estatística e por fornecer algumas amostras.
Por fim, mas definitivamente não menos importante, quero agradecer ao meu co-orientador Professor João Cardoso, pela paciência, dedicação, correções preciosas e conhecimentos partilhados.
The work received funds from FCT – Foundation for Science and Technology under Pluriannual UID/Multi/04326/2013.
“We ourselves feel that what we are doing is just a drop in the ocean. But the ocean would be less because of that missing drop.” Mother Teresa
II
Abstract
Fish aquaculture is a viable and profitable industry worldwide and monitoring fish larvae health and growth is a key step. The gilthead sea bream (Sparus aurata) is an economically important species reared mainly under mesocosm and intensive aquaculture systems. However, heterogeneous larvae growth and anatomic deformations are observed using these systems and few molecular markers to monitor fish growth are currently in use.
Desmosomes are a type of cell-cell junction formed by a protein complex that promotes strong connections between cells, playing a crucial role in the maintenance of tissue integrity. Desmosomal genes are well studied in human but poorly in fish, thus their potential as an additional molecular marker to monitor fish growth and health in aquaculture remains to be explored.
The aim of this project was to study the desmosomal genes evolution in fish and characterize their potential involvement in fish development and physiology in aquaculture. The results showed that desmosomal genes largely expanded in fish when compared to other vertebrates and teleosts possess a single desmocollin (dsc); three desmogleins (dsg a,b and c); two plakoglobins (pg a and b); two desmoplakins (dp a and b) and seven plakophilins (pkp 1a, 1b, 2, 3a, 3b, 4a and 4b). Dsc and dsg b were the candidates and their expression in
Sparus aurata was analyzed in various experiments. In general their expression in larvae was
not affected by the aquaculture systems. However, these genes seem to be associated with growth, in larvae exhibiting heterogeneous growth, the smaller individuals have the dsg b expression significantly up-regulated (p < 0.05) compared to the dsc. Thus these genes have potential to be used as molecular markers of growth. Different dsc profile expressions were found among the experiments, revealing that genetic background may also influence the expression of this gene.
III
Resumo
A aquacultura tem crescido vastamente ao longo das últimas décadas e emergido como uma alternativa às práticas pesqueiras. Os peixes são o principal organismo produzido e atualmente a sua produção mundial é aproximadamente 160 milhões de toneladas por ano. Consoante a densidade larvar a aquacultura pode ser classificada em diferentes categorias: extensiva, mesocosmo e intensiva. A dourada (Sparus aurata) é uma espécie bastante importante a nível económico no Mediterrâneo cuja produção em aquacultura tem registado um crescimento exponencial desde o início dos anos 90 até à atualidade. A sua produção é essencialmente sob regime intensivo e mesocosmo. Porém, estudos revelaram que esta espécie produzida em sistemas intensivos exibe deformações morfológicas e taxas de sobrevivência larvares menores quando comparadas com o sistema mesocosmo. Assim a seleção do sistema de aquacultura mais apropriado representa um desafio devido ao impacto que estes sistemas têm na saúde e crescimento dos indivíduos. Outro dos maiores desafios associado aquacultura é o crescimento não homogéneo das larvas de peixe. A origem deste problema permanece desconhecido e provoca perdas económicas elevadas devido às agressões e comportamentos canibalescos dos indivíduos maiores sobre os menores.
As formas clássicas de avaliar o crescimento larvar baseiam-se na caracterização do músculo, executando-se colorações por forma a contar as fibras e as dimensões das mesmas. Novas formas de avaliação têm vindo a emergir, recentemente o gene mlc2 foi descrito como um marcador molecular de performance de crescimento de larvas de dourada em aquacultura.
Os desmossomas são um tipo de junção celular constituídos por um vasto complexo de proteínas que promove ligações fortes entre as células. Em humanos estão envolvidos em vários processos, tais como: proliferação, diferenciação e morfogénese. A disrupção destas estruturas tem efeitos drásticos na integridade celular, desta forma o seu mau emparelhamento tem vindo a ser associado a uma serie de doenças. Estruturalmente estas junções celulares são constituídas por proteínas de três famílias: caderinas (desmocolinas e desmogleínas), armadilho (plocoglobinas e placofilinas), e plaquinas (desmoplaquinas). A arquitetura dos desmossomas baseia-se na ligação heterofílica das proteínas transmembranares (desmocolinas e desmogleínas) na zona extracelular das células, as suas
IV
caudas intracelulares por sua vez ligam-se às proteínas armadilo que interagem com as desmoplaquinas que finalizam a conexão da estrutura com a rede de filamentos intermédios das células. O papel destas proteínas é vastamente estudado em mamíferos, porém em peixes um único estudo foi realizado. Os resultados do silenciamento das caderinas desmossomais provocou fenótipos severos no peixe zebra e redução da integridade celular, revelando assim também um papel de extrema importância nos peixes.
Este projeto focou-se na biotecnologia azul e em termos gerais pretendeu-se enriquecer o conhecimento sobre este grupo de genes, desvendar como evoluíram nos peixes teleósteos e correlacionar com o seu desenvolvimento e crescimento, utilizando como modelo a dourada devido ao seu elevado interesse comercial. A nível de metodologia o projeto foi dividido em duas partes:
a) Análises bioinformáticas – identificação in silico de genes desmossomais em peixes e outros vertebrados para execução de análises filogenéticas;
b) Técnicas de biologia molecular – avaliação da expressão de caderinas desmossomais durante o desenvolvimento larvar, em larvas cultivadas em diferentes sistemas de aquacultura (intensivo e mesocosmo) e em larvas que exibissem crescimentos heterogéneos, por forma a correlacionar estes genes com os principais problemas da aquacultura acima referidos, utilizando q-RT-PCR. Foram encontrados homólogos dos genes desmossomais humanos em várias espécies. No geral foram identificados em teleósteos: uma desmocolina (dsc); três desmogleínas (dsg a,b e c); duas placoglobinas (pg a e b); duas desmoplaquinas (dp a e b); sete placofilinas (pkp 1a, 1b, 2, 3a, 3b, 4a e 4b). Os genes desmossomais apresentam trajetórias evolutivas distintas de espécie para espécie, tendo sido identificadas duplicações específicas de espécies que sugerem ter um papel funcional especifico em cada espécie, potencialmente associado à sua adaptação ao meio. Devido ao seu papel crucial na formação da estrutura desmossomal e da sua evolução complexa, as caderinas desmossomais foram selecionadas pra se efetuar os estudos de expressão. A dsc, dsg b e dsg
c foram isoladas na dourada, permanecendo o duplicado a por ser isolado e sendo o c uma
nova descoberta alcançada neste projeto. A expressão tecidular em conjunto com uma pesquisa em bases de dados de EST revelou que a dsc é amplamente expressa enquanto as
dsg apresentam uma distribuição mais restrita. Em humano, diferentes combinações destas
V
verificar nos teleósteos. A dsc e dsg b foram identificadas em larvas enquanto a dsg c parece estar ausente nesta fase, o que indica também uma combinação das caderinas desmossomais associada à fase desenvolvimento dos peixes. Análises de expressão de dsc e
dsg b em larvas que apresentava crescimento heterogéneo, revelou que os indivíduos
menores expressam níveis maiores de dsg b e esta é significativamente sobre expressa em comparação à dsc (p < 0.05). Correlações entre estes genes e genes associados ao desenvolvimento do músculo foram observadas (myog, igf-2 e fst). Após eclodirem, as larvas apresentam um período intenso de hiperplasia (recrutamento de fibras de músculo) que ocorre entre os 15-25 dias após eclosão e posteriormente um período de hipertrofia (aumento do tamanho das fibras existentes). Curiosamente, no geral foi no período de hiperplasia que níveis mais elevados de dsc e dsg b foram observados. Isto indica que a expressão destes genes está possivelmente mais associado ao recrutamento de fibras musculares do que ao aumento das mesmas, justificando assim o facto dos indivíduos menores apresentarem uma no geral níveis maiores de dsg b e uma sobre expressão desta em relação à dsc. Estes resultados sugerem que estes genes poderão servir como marcadores moleculares de crescimento em larvas de peixe em aquacultura. No geral os sistemas de aquacultura não parecem influenciar a diferença de expressão de dsc e dsg b, o que sugere que o tipo de sistema de aquacultura não tem impacto na integridade celular neste período (5-60 dias após ecolosão). Os resultados mais surpreendentes foram as diferenças de expressão de dsc obtidas nas diferentes experiencias, sugerindo que fatores genéticos podem influenciar fortemente a expressão destes genes visto que que as amostras eram provenientes de stocks diferentes.
VI
Abbreviations
1R: first whole genome duplication 2R: second whole genome duplication 3R: third whole genome duplication aa: amino acid
ANOVA: analysis of variance
aqp4: aquaporin 4
ATP: adenosine triphosphate
BLAST: Basic Local Alignment Search Tool
BME: β-mercaptoethanol bp: base pair
BrEt: ethidium bromide
b4galt6: β-1,4-galactosyltransferas
Ca2+:calcium ion
CAR: cell adhesion recognition site cDNA: complementary
deoxyribonucleic acid
cdh2: cadherin 2
cm: centimeters
CM: cytoplasmic membrane
col1a1: collagen type I alpha 1
Ct: cycle threshold
CTNNB1: human β-catenin 1 protein CTNND1: human δ-catenin 1 protein DNA:deoxyribonucleic acid
DP: desmoplakin dph: days post hatch Dsc: desmocollin Dsg: desmoglein
DTD: desmoglein terminal domain
EA: extracellular anchor
EC: extracellular cadherin repeat
E. coli: Escherichia coli
ef1a: elongation factor 1-alpha
EST: expressed sequence tag
FAO: Food and Agriculture Organization
fst: follistatin
Fw: forward g: gram
GSR: glycine–serine–arginine HCMR: Hellenic Center for Marine Research
HKG: housekeeping gene IA: intracellular anchor ICS: cadherin-like sequence IDP: inner dense plaque IF: intermediate filament Ig: immunoglobulin
Igf-2: insulin-like growth factor 2
Ind/L: individual per liter IPL: proline rich linker region IPTG: isopropyl
β-D-1-thiogalactopyranoside kb: kilobase
kctd1: potassium channel
tetramerization domain containing 1 kg/m³: kilogram per cubic meter kg/ha/year: kilogram per hectare per year
VII
LB: Luria-Bertani M: molar
m: meter m3: cubic meter
MCS: multiple cloning site mg/ml: milligram per milliliter Mg2+: magnesium ion
min: minute ml: milliliter
mlc2: myosin light chain 2
mm: millimeters
mrf4: myogenic regulatory factor 4 mst: myostatin
mt-DNA: mitocondrial deoxyribonucleic acid
MYA: million years ago
myog: myogenin
NCBI: National Center for Biotechnology Information NF: normalization factor Ng: nanogram
n.i. : not identified nm: nanometers
nmol/L: nanomol per liter
NSRF: National Strategic Reference Framework
ODP: outer dense plaque P: p value
PCR: polymerase chain reaction PG: plakoglobin
pH: hydrogen potential PKP: plakophilin
PLC: hepatocellular carcinoma-derived cell line
PLEC: human plectin protein PM: plasmatic membrane
psma8: proteasome subunit alpha 8
PRD: plakin repeat domain q-RT-PCR: quantitative real time polymerase chain reaction R0: starting fluorescence
RAPD:random amplified polymorphic DNA
RNA: ribonucleic acid
RPL13A: ribosomal protein L13a rpm: rotations per minute
rps18: gene of ribosomal protein S18
RUD: repeat unit domain Rv: reverse
SDS: sodium lauryl sulfate
SEACASE: sustainable extensive and semi-intensive coastal aquaculture in Southern Europe
sec: second
S.E.M: standard error of the mean SNP:single nucleotide polymorphism
ss18:nBAF chromatin remodeling complex subunit
TAE: Tris-Acetate-EDTA
taf4b:gene of TATA-box binding protein associated factor 4b Tm°: melting temperature
TSWGD: teleost-specific whole genome duplication
VIII
trappc8: gene of trafficking protein
particle complex 8
ttr: transthyretin
tubb2:tubulin β-2A class IIa U: unit
UV: ultraviolet
U/μl: unity per microliter V: volt
WGD: whole genome duplication X-gal: 5-bromo-4-chloro-3-indolyl-ß-D-galactoside
znf521: gene of zinc finger protein 521
°C- Celsius degrees λ: wave length μg: microgram μl: microliter
μg/mL: microgram per milliliter μg/μL: microgram per microliter μm: micrometers
IX
Table of Contents
Acknowledgments/Agradecimentos ... I Abstract ... II Resumo ... III Abbreviations ... VI Table of Contents ... IX List of Tables ... XI List of Figures ... XIII1 Introduction... 1
1.1 Aquaculture an expanding industry worldwide ... 1
1.2 Fish farming systems ... 3
1.2.1 Extensive system ... 4
1.2.2 Mesocosm system ... 5
1.2.3 Intensive systems ... 6
1.3 The gilthead sea bream and its farming ... 7
1.4 Bottlenecks of fish farming and molecular markers ... 9
1.5 The desmosomes ... 11
1.5.1 Desmosomes structure ... 12
1.5.2 The desmosomal cadherin family members ... 14
1.5.3 The desmosomal armadillo family members ... 18
1.5.4 The desmosomal plakins family members ... 19
1.6 Gene evolution in teleosts ... 21
1.7 Context in biotechnology ... 23
1.8 Objectives ... 24
2 Materials and methods ... 25
2.1 Biological material ... 26
2.1.1 Study 1: expression during ontogeny an in larvae with heterogeneous growth……….……… 26
2.1.2 Study 2: mesocosm and intensive systems ... 26
2.2 Bioinformatic analysis ... 27
2.2.1 In silico searches ... 27
X
2.2.3 Gene synteny analysis ... 29
2.3 Molecular biology techniques ... 29
2.3.1 Primers design ... 29
2.3.2 Polymerase chain reaction (PCR)... 30
2.3.3 Agarose gel electrophoresis ... 31
2.3.4 Gene cloning ... 32
2.3.4.1 Ligation reaction ... 32
2.3.4.2 Bacterial transformation ... 32
2.3.4.3 Positive clone selection... 33
2.3.5 Plasmid DNA extraction – MiniPrep ... 33
2.3.6 RNA extraction and cDNA synthesis ... 34
2.3.7 Real time quantitative PCR (q-RT-PCR) ... 35
2.4 Statistical analyses ... 38
3 Results ... 39
3.1 Identification of desmosomal genes from fish ... 39
3.2 Phylogenetic analysis ... 42
3.3 Gene synteny of the desmosomal cadherins ... 48
3.4 Isolation of the gilthead sea bream dsc and dsg ... 51
3.5 Tissue distribution of the dsc and dsg in gilthead sea bream ... 52
3.6 Ontogenic expression of dsc and dsg b in sea bream larvae ... 53
3.7 Expression of dsc and dsg b in sea bream larvae reared in mesocosm and intensive aquaculture systems ... 57
4 Discussion ... 60
4.1 Fish desmosomal genes and evolution ... 60
4.2 Expression of desmosomal cadherins in gilthead sea bream ... 63
5 Conclusion ... 65 6 Future work ... 66 7 Bibliography ... 67 8 Annexes ... 75 Annex I ... 75 Annex II ... 83 Annex III ... 87
XI
List of Tables
Table 1.1: Main differences between extensive, mesocosm and intensive aquaculture techniques [9]. ... 4 Table 1.2: Developmental stages of gilthead sea bream larvae at 17-18 °C [17]. ... 9 Table 1.3: Tissue distribution of desmosomal cadherins in human and associated diseases [38]. ... 17 Table 1.4: Disease associated with DP mutations in humans. ... 20 Table 2.1: Set of primers used in the PCR and q-RT-PCR and their respective efficiency. Fw – forward and Rv – reverse.”*”indicates primers already designed in previous studies [75,26] ... 37 Table 3.1: Accession numbers of the desmosomal transcripts retrieved from the sea bream nucleotide database. ... 42 Correlations analysis of dsc and dsg b expression during larval development revealed that the expression of the two genes are correlated, which is expected since they are part of the same complex of proteins (Table 3.2). Correlation analysis was also performed with structural genes, myogenic and hormonal factors (mlc2a, mlc2b,
myog, mstn, col1a1, igf-2, fst and mrf4) involved in muscle growth (Table 3.2). ... 56
Table 3.2: Correlation analysis of dsc and dsg b expression with other transcripts involved in teleost muscle growth mlc2a, mlc2b, myog, mstn, col1a1, igf-2, fst during the same time period (5, 15, 25, 35, 48 and 60 dph). The statistical test used was Pearson correlation and “*” indicates statistically significant correlation at a level of p < 0.05. ... 56 Table Annex I.1: Genes and respective proteins accession numbers of the dsc retrieved from the genomes databases searches. ... 75 Table Annex I.2: Genes and respective proteins accession numbers of the dsg retrieved from the genomes databases searches. ... 76 Table Annex I.3: Genes and respective proteins accession numbers of the pg retrieved from the genomes databases searches. ... 77 Table Annex I.4: Genes and respective proteins accession numbers of the dp retrieved from the genomes databases searches. ... 78
XII
Table Annex I.5: Genes and respective proteins accession numbers of the pkp retrieved from the genomes databases searches. ... 79 Table Annex II.1: ESTs accession numbers of dsc found in the in silico search. ... 83 Table Annex II.2: ESTs accession numbers of dsg found in the in silico search. ... 86
XIII
List of Figures
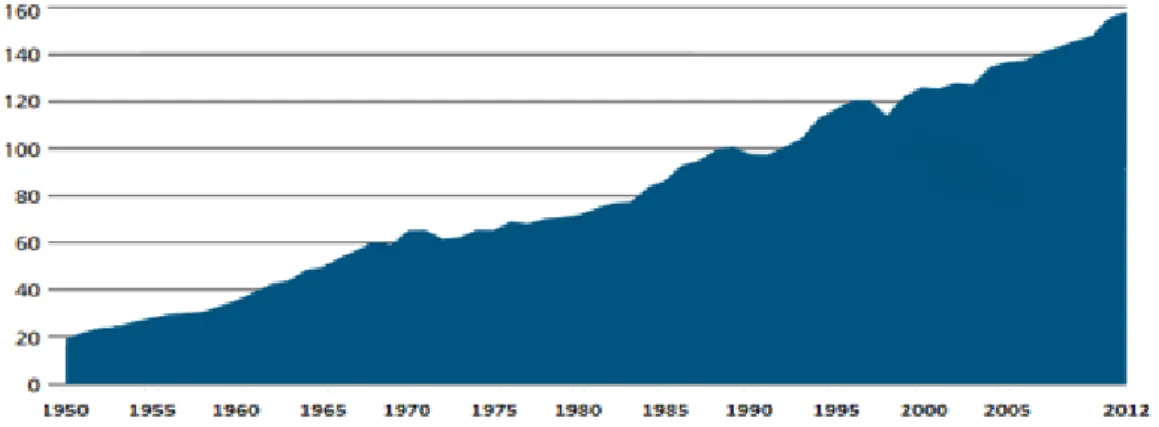
Figure 1.1: Global aquaculture fish production increment (in million tonnes) from 1950 until 2012. Data from FAO [6]. ... 2 Figure 1.2: Classification of the aquaculture systems according to larval density. Values expressed in number of larvae L-1. Larvae stocking density is indicated in brackets [9].
Boxed are the three types that constitute the intensive system. ... 3 Figure 1.3: Increase growth in global aquaculture production of gilthead sea bream from 1969 to 2013. Adapted from FAO - Fisheries and Aquaculture Statistic 2013 [14]. 7 Figure 1.4: World distribution of the gilthead sea bream. Colours indicate the relative probability of gilthead sea bream occurrence in the area [15]. ... 8 Figure 1.5: Photograph of an adult gilthead sea bream [10]. ... 8 Figure 1.6: Immunofluorescence microscopy photograph of an epithelial cell line (PLC, hepatocellular carcinoma-derived cell line) stained with antibodies against desmoplakin (yellow) and keratin intermediate filaments (red). The cell nuclei are shown in blue. Arrowheads point to individual desmosomes that are lined up along the plasma membranes of adjacent cells. A’: Higher magnification of cell-cell contacts shown in A [29]. ... 11 Figure 1.7: Structure of a desmosome. The three major protein families that are responsible for maintaining the desmosome structure are represented: the cadherin family members: Dsc-Desmocollin (red) and Dsg-Desmoglein (green); the armadillo family: PG-Plakoglobin (blue) and PKPs-Plakophilins (pink); plakin family: DP-Desmoplakin (yellow) that links to intermediate filaments (IF). Adapted from [28]. .... 13 Figure 1.8: Structural model of a desmosome. (A) Electron micrograph of a desmosome. (B) Schematic representation of the structural organization of a desmosome. PM- plasmatic membrane; IDP- inner dense plaque; ODP - outer dense plaque; PG-plakoglobin; DP- desmoplakin; PKP- plakophilins; IF- intermediate filaments; C – c-terminal and N- n-terminal [35]. ... 14 Figure 1.9: Schematic representation of desmosomal cadherins, Dsc and Dsg. In human CAR - cell adhesion recognition; EC’s - extracellular cadherin repeats; EA- Extracellular anchor; CM- cytoplasmic membrane; IA- intracellular anchor; ICS- intracellular
XIV
cadherin-like sequence; IPL-intracellular proline-rich linker; RUD-repeat unit domain; DTD- desmoglein terminal domain [30]. ... 15 Figure 1.10: Expression patterns of the desmosomal cadherins in the four layers of the epidermis in human [35]. ... 16 Figure 1.11: Schematic representation of the armadillo proteins (PG and PKP). Hatched box represent the insert between repeats 5 and 6 that is only present in PKP [30]. .... 18 Figure 1.12: Schematic representation of DPI and DPII. A, B, C – plakin repeat domains; GSR- glycine–serine–arginine rich domain [30]. ... 20 Figure 1.13: Evolution of fishes over the time, from hagfishes to teleosts radiation. MYA- million years ago [63]. ... 21 Figure 1.14: Fates of duplicated genes after WGD event. Non-functionalization: it’s a very frequent fate in one of the paralogs since immediately after WGD paralogues are functionally redundant, suggesting that the selective constraint of maintaining both is low and that one of them is, therefore, free to disappear. Deleterious mutations occur in one of the paralogues, eventually leading to its silencing (pseudogenization). Mutations continue to accumulate until the structural features of the gene have totally disappeared. Subfunctionalization: genes usually have more than only one function and in this case complementary degenerative mutations in paralogous genes lead to preservation of both. Neofunctionalization: due to the lack of selective constraint on maintaining both paralogues, one of them is free to acquire mutations, eventually generating a new function. Dosage selection: after a WGD genes are doubled and therefore duplicate genes pairs are all expressed at a higher level than the corresponding ancestral gene, however the relative dosage is not disrupted. Maintain gene relative dosage balance is crucial to some genes and in one paralogue can lead to negative developmental or physiological consequences [66]. ... 22 Figure 1.15: Proposed rounds of WGD during the vertebrate radiation: 1R and 2R occurred prior or at the emergence of the vertebrates and the 3R or teleost specific genome duplication that occurred only in the teleosts. Adapted from [68]. ... 23 Figure 2.1: Flow chart of the methodology followed in this research project. ... 25 Figure 3.1: Cladogram describing the number of desmosomal genes (dsc, dsg, pg, dp and pkp) identified in fish and other vertebrates. The TSWGD is represented by the closed circle “•”. “+” indicates that for sea bream the members correspond to
XV
transcripts retrieved from its specific assembly. “*” indicates members not predicted in the genome and retrieved from EST; n.i. - not identified. Accession numbers are available in Annex Tables I.1, I.2, I.3, I.4, I.5, II.1, II.2 and Table 3.1. ... 40 Figure 3.2: Phylogenetic tree of dsc and dsg members of fish and other vertebrates. Tree was obtained with the model WAG+I+G using the method maximum likelihood with a bootstrap analysis of 100 replicates. a, b and c represent the different dsg duplicates identified by the clustering organization. Accession numbers in Annex Table I.1, I.2 and Table 3.1. ... 43 Figure 3.3: Phylogenetic tree of the pg members of fish and other vertebrates. The tree was constructed with the model JTT+I+G+F using the method maximum likelihood with a bootstrap analysis of 100 replicates. The tree was rooted with the human β-catenin 1 protein. a and b represent the different pg duplicates identified by the clustering organization. Accession numbers in Annex Table I.3 and Table 3.1. ... 45 Figure 3.4: Phylogenetic tree of dp members of fish and other vertebrates, obtained with the model JTT+I+G+F using the method maximum likelihood with a bootstrap analysis of 100 replicates. The tree was rooted with the human plectin protein. a and b represent the different dp duplicates identified by the clustering organization. Accession numbers in Annex Table I.4 and Table 3.1. ... 46 Figure 3.5: Phylogenetic tree of pkp members of fish and other vertebrates, obtained with the model JTT+I+G+F using the method maximum likelihood with a bootstrap analysis of 100 replicates. The tetrapod and teleost branches were collapsed to facilitate interpretation. The complete tree is available as Figure Annex III.1. The tree was rooted with the human δ-catenin 1. * indicates the presence of a gilthead sea bream transcript in the clade. a and b represent the different pkp duplicates. Accession numbers in Annex Table I.5 and Table 3.1 ... 47 Figure 3.6: Characterization of the neighbouring gene environment of the desmosomal cadherins in some fishes and in human. Each box represents a gene and each gene is defined by a colour, the position of the gene is indicated below and the arrow defines gene orientation. The genes represented in the figure contain their official abbreviations: DSC-desmocollin; DSG-desmoglein; TTR-transthyretin; BGALT6-β-1,4-galactosyltransferase 6; TRAPPC8- trafficking protein particle complex 8; CDH2-cadherin 2; AQP4-aquaporin 4; KCTD1- potassium channel tetramerization domain
XVI
containing 1; taf4b - TATA-box binding protein associated factor 4b; PSMA8- proteasome subunit alpha 8; SS18- nBAF chromatin remodeling complex subunit;
ZNF521 - zinc finger protein 521; tubb2- tubulin β-2A class IIa and dp-desmoplakin. The
dashed line represents the existence of a big distance between genes on the same chromosome or scaffold that is described in the upper part of the genes. Single numbers inside the forms represent that “x” number of that gene exits one after the other. a, b and c letters inside dsg forms describes which duplicate it is according to the phylogenetic tree (Figure 3.2). For coelacanth and spotted gar x,y,z and i, ii, iii represent respectively the dsg duplicates of these two species. ... 49 Figure 3.7: Agarose gel electrophoresis of the dsc and dsg b PCRs . DL – 1 kb DNA ladder; Dsc60 – dsc primers tested with Tm° of 60; Dsc64 – dsc primers tested with Tm° of 64; Dsc- – negative control; Dsgb 58 – dsg b primers tested with Tm° of 58; Dsgb 60 – dsg b primers tested with Tm° of 60; Dsgb - – negative control. ... 51 Figure 3.8: Nucleotide sequence alignment between dsg a, dsg b and dsg c from stickleback; dsg b and dsg c from sea bass and dsg b from sea bream. The conservation of nucleotides among the genes are represented with a colour gradient where total conservation is black and zero conservation is white. The primers that generated an amplification product are highlighted with red. ... 52 Figure 3.9: Tissue distribution by PCR of dsc and dsg b in sea bream. DL–DNA ladder; skn–skin; msc–muscle; gll–gills; lvr–liver; duo–duodenum; stm–stomach and negative control (–). ... 53 Figure 3.10: Relative expression of dsc and dsg b in gilthead sea bream larvae at 5, 15, 25, 35, 48 and 60 dph. 5 dph: dsg b n= 9; dsc n= 4. 15 dph: dsg b n= 9; dsc n= 12. 25 dph: dsg b n= 13; dsc n= 13. 35 dph: dsg b n= 15; dsc n= 15. 48 dph: dsg b n= 9; dsc n= 9. 60 dph: dsg b n= 7; dsc n= 7. The main morphological events on these dph are mapped. Statistically significant differences were assessed using two-way ANOVA. “*” indicates statistically significant differences (p < 0.05) between the expression of dsc and dsg b. Same lower case letters indicate dsc expression without significant differences (p > 0.05) between the dph, while different lower case letters indicate statistically significant dsg b expression differences on the dph (p < 0.05). Dsg b did not reveal significant (p > 0.05) differences in its expression during the period studied .... 54
XVII
Figure 3.11: Relative expression of dsc and dsg b in sea bream larvae at 58 dph in individuals of different sizes. Statistical significances we assessed using t-test; “*” indicates p < 0.05. Large=0.0067g average weight and length=1.4-2.1 cm; Small=0.029g average weight and length=1.3-1.8 cm. Small: dsg b n= 10; dsc n= 10. Large: dsg b n= 10; dsc n= 10. ... 55 Figure 3.12: Relative expression analysis of the desmosomal cadherins (dsc and dsg b) in gilthead sea bream larvae at 4, 15, 25, 35, 45 and 81 dph reared in different aquaculture systems (intensive (I) and mesocosm (M)). Two-way ANOVA was performed to assess statistically significant differences. A: Expression of dsg b. 4 dph: I n=10; M n= 12. 15 dph: I n=12; M n= 9. 25 dph: I n=12; M n= 10. 45 dph: I n=12; M n= 10. 81 dph: I n=12; M n= 10. B: Expression of dsc. 4 dph: I n=12; M n= 10 .15 dph: I n= 9; M n= 10. 25 dph: I n=12; M n= 10. 45 dph: I n=12; M n= 11. 81 dph: I n= 7; M n= 8.Same lower case letters indicate gene expression without significant differences (p > 0.05) between the dph in the intensive system, while different lower case letters indicate statistically significant gene expression differences on the dph (p < 0.05) in the intensive system. Same upper case letters indicates gene expression without significate differences (p > 0.05) between the dph in the mesocosm system, while different upper case letters indicates statistically significate gene expression differences on the dph (p < 0.05) in the intensive system. “*” Indicates statically differences of dsg b expression between intensive and mesocosm systems (p < 0.05). ... 58 Annex Figure III.1: Complete version of the Figure 3.5. Phylogenetic tree of pkp members of fish and other vertebrates, obtained with the model JTT+I+G+F using the method maximum likelihood with a bootstrap analysis of 100 replicates. The tree was rooted with the human δ-catenin 1. Due the large dimensions of this phylogenetic tree, zoom in of each cluster (PKP4, PKP3, PKP1 and PKP2) is provided respectively in Annex Figures III.2, III.3, III.4 and III.5. Accession numbers available in Annex Table I.5 and Table 3.1. ... 87 Annex Figure III.2: Zoom in of the pkp4 cluster from Annex Figure III.1. a and b represent the different pkp4 duplicates identified by the clustering organization. ... 88 Annex Figure III.3: Zoom in of the pkp3 cluster from Annex Figure III.1. a and b represent the different PKP 3 duplicates identified by the clustering organization... 89
XVIII
Annex Figure III.4: Zoom in of the pkp1 cluster from Annex Figure III.1. a and b represent the different PKP 1 duplicates identified by the clustering organization... 90 Annex Figure III.5: Zoom in of the pkp2 cluster from Annex Figure III.1. ... 91
1
1 Introduction
1.1 Aquaculture an expanding industry worldwide
Aquaculture is defined as the large scale husbandry or rearing of aquatic organisms for commercial purposes and is a viable and profitable industry worldwide [1]. The origins of aquaculture as a form of farming trace back to more than 2000 years when the Roman and Chinese Empires were the pioneers [2]. In the last few decades, aquaculture has become a global practice and is one of the most rapidly evolving and technically innovative sectors of food production, with a significant investment, scientific input, technical development and production [3]. Aquaculture has been emerging as an alternative to fisheries that imposes a significant pressure on fish stocks reducing average age and body size, which in return reduces the percentage of the fish to spawn and maintain the natural stock density [4].
According to the Food and Agriculture Organization (FAO) it is estimated that more than 600 aquatic organisms are cultured and this includes several fish species, crustaceans, molluscs, amphibians, reptiles, aquatic invertebrates and also plants and algae [5]. Most aquaculture products are for human consumption, although they can have other applications, such as extraction of bioactive compounds from algae for the cosmetic and pharmaceutical industries. A small proportion of the aquaculture products are used to produce fishmeal and to extract fish oils for use in the manufacturing of fish diets with high protein content for aquaculture [5].
Fish are one of the main aquaculture products and they are the most traded food commodities in the world. Over the last sixty years, fish production in aquaculture has grown vastly (Figure 1.1), increasing at an average annual growth rate of 6.1 percent. In 1950 approximately 20 million tonnes of fish were produced in aquaculture, but nowadays the production has increased eight times and has almost reached 160 million tonnes per year [6]. In 2012, approximately 200 countries exported aquaculture products and these exports are especially important for developing nations as they represent more than half of the total value of traded commodities in the majority of the cases [5].
2
Figure 1.1: Global aquaculture fish production increment (in million tonnes) from 1950 until 2012. Data from FAO [6].
World fish consumption per capita increased from an average of 9.9 kg in 1960 to 19.2 kg in 2012. This increment was triggered by population growth, urbanization, expansion of fish production and the existence of efficient distribution channels [6]. Asia dominates the market and China is by far the largest global aquaculture producer and exporter [6,7]. In 2012, aquaculture provided almost half of the fish for human consumption and China, India and Vietnam were the top leading producers, with 41.1, 4.2 and 3.1 million tonnes of fish produced, respectively [5,8].
Fish is a rich source of protein and a 150 g portion provides about 50–60% of an adult human daily protein requirements. In densely populated countries where total protein intake levels are low, fish proteins represent a crucial nutritional component [6]. In 2050 it is expected that the global human population will reach 9.6 billion inhabitants with more than 800 million suffering from chronic malnutrition. This fact will challenge the capacity of the planet to feed the human population while safeguarding its natural resources for future generations. In this context, aquaculture plays a crucial role in eliminating hunger, promoting health and developing the economy in order to support the global development [3,5].
3
1.2 Fish farming systems
Aquaculture production of fish starts in hatcheries with the production of fry from broodstock. Fish hatchery systems may follow different approaches, but a decisive parameter is the fish larvae stocking density. Accordingly, hatchery systems are defined as: extensive, mesocosms, semi-intensive, intensive and hyper intensive (Figure 1.2) [9]. Despite this classification, commonly three main categories are defined: extensive, mesocosms and intensive systems that are described in more detail below [9].
Figure 1.2: Classification of the aquaculture systems according to larval density. Values expressed in number of larvae L-1. Larvae stocking density is indicated in brackets [9].
Boxed are the three types that constitute the intensive system.
Other parameters that can be considered are the prey source and availability (wild or cultured; phytoplankton or zooplankton; live or inert) and quality of water and hydroid system (clean water, green water, pseudo-green water, open or closed water circuit) [9]. Table 1.1 summarizes the main differences between the aquaculture systems.
4
Table 1.1: Main differences between extensive, mesocosm and intensive aquaculture techniques [9].
Parameters
Techniques
Extensive Mesocosm Intensive*
Rearing enclosures Ponds or bags Tanks or bags Tanks
Localisation Outdoor Indoor ** Indoor
Rearing volume (m3) >100 30-100 <20
Rearing density (ind/l) 0.1-1 2-8 30-200
Food chain Endogenous Mixed Exogenous
Infrastructures Light Medium Sophisticated
Environment Natural Mixed Controlled
Autonomy and autarky High Medium Low to nil
Dependence on man and technique
Light Medium High to very high
Need for specific biological knowledge
Light Medium High to very high
Validity for new species Very high High Medium to low *Includes semi-intensive, intensive and hyper-intensive techniques
**Sometimes outdoor (with bags) or semi-outdoor
1.2.1 Extensive system
The extensive system is based on the natural migration of euryhaline fish (organisms that are able to adapt to a wide range of salinities) and typical fishing traps are used to capture juveniles of 2-3 g. The juveniles captured are seededinto lagoons and costal ponds where they complete growth and reproduction [10]. Extensive systems also operate for fish eggs and larvae, in this case, feeding is based on phytoplankton and zooplankton that promote a natural environment, creating a food chain that provide the necessary nutrients for fish development [9]. Larviculture under this system is performed at low densities (0.1-1 larvae L-1) and usually is carried out in
small pouds or even bags [9].
In this type of farming the fish density generally does not exceed 0.0025 kg/m³ and the output is less than 1000kg/ha/year [10]. This system is highly dependent on the environment conditions and this together with the lower outputs are the main disadvantages. An advantage of extensive system is that is a highly environmental-friendly practice [9].
5
1.2.2 Mesocosm system
The mesocosm system sits between extensive and semi-intensive systems (Figure 1.2), thus it is also denominated as semi-extensive [9]. The goal of the mesocosm system is to mimic the natural environment using both extensive and intensive techniques without their disadvantages [11]. This may include enrichment of the farming area with oxygen supplementation and exogenous feed, consequently requiring extra costs in more advanced technologies. In mesocosm system, the individuals obtain most of their food from the natural environment, yet they can also receive supplementary feed, which allow fish to grow faster than in the extensive system [10]. This system is based on a natural phytoplankton or zooplankton bloom that is stimulated prior to the yolk-sac larvae (larvae already hatched from the egg but not feeding yet and still absorb the yolk that contain nutritive compounds) and also water fertilization to stimulate algae growth [11].
This system can be subdivided according to the source and quality of the food in mesocosms with extensive and intensive philosophies. In the extensive philosophy, fish use natural source of food (phytoplankton or zooplankton) and ocasionally receive an exogenous input to complement the diet. In the intensive philosophy, the source of food is the natural food chain derived from the phytoplankton and zooplankton and supplementation with exogenous inputs always occur [9].
Larviculture in these systems is performed at relatively low densities (2-8 larvae L-1) in relatively large (30-100 m3) and deep (1.5-2.5 m) tanks, usually with circular
shape [9]. Mesocosm systems are used throughout the world, yet there is no standard protocol that can be followed, although high-value marine food can be produced in such systems [11]. However it’s the rearing methodology that exhibits improved results in relation to the production of high quality juveniles with lower ecological footprint compared with the intensive system. The final production varies a lot, according to the size of the juveniles stocked and the amount of feed provided. Normally the density in mesocosm systems does not exceed 1 kg/m³ and the output is around 10000kg/ha/year [12].
The white sea bream, sea bass and the gilthead sea bream are the three main species that perform the best in this aquaculture system when compared with intensive or extensive techniques. These species when in mesocosm systems exhibit
6
homogenous behavior, normal wild coloration and low levels of deformities (1-5% in sea bream and white sea bream and 2-3% in sea bream) [9].
Sea bream larvae in mesocosm system exhibit higher growth and also higher rates of larval survival than in intensive systems. Anatomic deformities in the vertebral column, anal and caudal fins of some species in intensive systems were also observed [13]. Other advantage of this system is the environmental stability that prevents drastic changes in the water quality due to the larger volumes used and its lower economic impact when compared with intensive system. The main disadvantage is the inexistence of a protocol that can be applied to different species in different regions, since nutritional and environmental requirements varies from species to species and phytoplankton and zooplankton organisms vary widely from place to place [11].
1.2.3 Intensive systems
Intensive systems include the semi-intensive, intensive and hyper-intensive systems (Figure 1.2). These aquaculture systems are the most sophisticated and are highly dependent on skilled personnel and technology [9]. They are characterized by high larval densities in small tanks under strict specific hydraulic, thermal, light and feed conditions, which accelerate growth and fish biomass. Under this systems high rates of deformities and other abnormalities, such as alterations in the coloration, cannibalism and abnormal sex ratio, are observed [9].
These systems were implemented during the 1980s and consist of four phases: reproduction, larval rearing, fattening and grow-out. In intensive farming there is a brood stock that initiates the reproduction and then larval rearing phase occurs, followed by the fattening phase and terminating with the growing-out. There is no wild capture and the reproductive phase assures the existence of a new generation, thus gonad development, spawning and egg quality are significantly influenced by brood stock robustness [14]. The larval rearing phase is performed under highly controlled and optimized conditions in order to guarantee a good development of the fish. Fattening is very important and takes place in land-based installations. There is a pre-fattening phase applied to fry and an intensive pre-fattening phase applied to juveniles. The growing phase may occur in land-based installations and also in sea cages, either
7
in sheltered or semi-exposed sites (floating cages) or totally exposed sites (semi-submersible or (semi-submersible cages) [14].
1.3 The gilthead sea bream and its farming
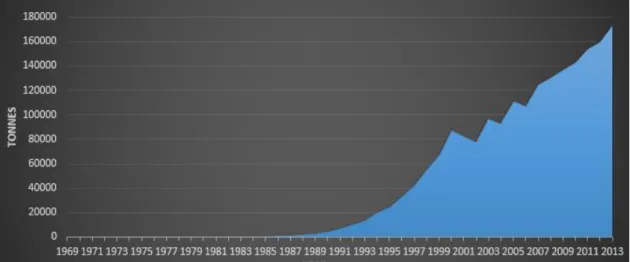
The gilthead sea bream (Sparus aurata) is an economically important species in European aquaculture and an intensive increment in its production is evident over the recent years (Figure 1.3). Since the early 90’s a continuous exponential growth in sea bream production occurred, starting from less than 100 tonnes in 1986 to more than 150,000 tonnes in 2013 worldwide (Figure 1.3) [14].
Figure 1.3:Increase growth in global aquaculture production of gilthead sea bream from 1969 to 2013. Adapted from FAO - Fisheries and Aquaculture Statistic 2013 [14].
Gilthead sea bream can be farmed in coastal ponds and lagoons with extensive and mesocosm systems or in land-based installations and in sea cages with intensive farming systems. In extensive systems gilthead sea bream reach the first commercial size (350-400 g) in approximately 20 months while in the intensive system it occurs in only 15 months [10].
Gilthead sea bream is a subtropical carnivorous teleost fish of the Sparidae family and is very common in the Mediterranean Sea, its presence extends from the Eastern Atlantic coasts of the Great Britain to Senegal in Northern Africa (Figure 1.4) [10].
8
Figure 1.4:World distribution of the gilthead sea bream. Colours indicate the relative probability of gilthead sea bream occurrence in the area [15].
The average length of an adult sea bream is 35 cm with a maximum length of 70 cm. It is regularly curved with small eyes and the mouth has thick lips. The body shape is oval and its colour is silvery grey with a large black blotch at the origin of the lateral line extending from the upper margin of the opercula. On the body sides dark longitudinal lines are often present and the dorsal fin has a dark band while the tips of caudal fin are edged with black (Figure 1.5) [17,10].
Figure 1.5:Photograph of an adult gilthead sea bream [10].
This species is a protandrous hermaphrodite (organisms that develop into males first, then possibly to females), in the wild sexual maturity in males is achieved at 2 years of age (20-30 cm) and in females at 2-3 years (33-40 cm). In captivity sex reversal can be conditioned by social factors and hormones [10]. The breeding season
9
under natural environmental conditions occurs in late Autumn, eggs size are 0.9-1.1 mm and their incubation lasts about 2 days at 16-17°C [16]. Larval length at hatching is 2.5-3.0 mm and metamorphosis occurs around 50 days post hatch (dph) at 17.5°C or about 43 days post hatch at 20°C [16]. Moretti et al characterized the ontogeny of larval development at 17-18 °C in the intensive system and the principal characteristics during this stage are described in Table 1.2 [17].
Table 1.2: Developmental stages of gilthead sea bream larvae at 17-18 °C [17].
Day Size
(mm) Characteristics 1 3.0 Hatching
2 3.5 Pectoral fins appear 3 3.8 Exotrophy starts
4 3.9 Eyes pigmented 60% of yolk sac absorbed, 40% of oil drop absorbed
5 4.0 Primary swim bladder inflation 100% of the yolk sac absorbed, 70% of oil drop absorbed 15 5.0 End of the primary swim bladder inflation 100% of the oil drop reabsorb, caudal fin 17 7.0 Anal fin
20 7.5 Stomach starts developing 45 11.0 Second dorsal fin
50 15.0 First dorsal and ventral fin
60-70 20.0 Scales
90 30.0 Definite morphology
Since this species is very sensitive to low temperatures, 4°C is their lethal temperature limit and juveniles typically migrate in early Spring to areas where they can find milder temperatures [10]. Due to its euryhaline (capacity to tolerate a wide range of salt water concentrations) and eurythermal habits, this species is found in both marine and brackish water environments [10].
1.4 Bottlenecks of fish farming and molecular markers
Selection of the aquaculture system may impact on fish health and may affect fish growth performance [19,20]. Different growth and larval survival rates are observed according to the type of aquaculture system selected, however the reasons behind this remain unclear and constitute a major problem in fish aquaculture [13]. The non-homogeneous larvae growth and consequently the rearing of juveniles of uneven sizes, increases aggressive behavior within a population provoking losses in the culture and this has a negative impact in the aquaculture production. In the wild, the
10
size-related dominancy promotes faster growth of the larger dominants since they obtain preferential access to food [20]. The cause of non-homogeneous growth in larvae remains to be explored and it may be a genetic consequence or a social event effect. Several exogenous factors, such as temperature, salinity, light intensity, food availability and quality also have an impact on growth performance [21]. To avoid non-homogenous growth in aquaculture a size grading occurs at regular intervals by separating larvae according to the size and each group of larvae is cultured in different tanks [15,23]. This prevents cannibalistic behavior and consequently improves growth, survival rates and biomass gain of the cohort reducing economic losses [23,20]. However, size sorting increases stress and is an extra cost for the producer [18].
Available methodologies to assess larvae growth and quality are based on the characterization of the muscle structure using histology. Staining of muscle sections (with haematoxylin and eosin) and counting of muscle fibers and their dimensions have been used extensively to determine the growth dynamics of fast muscle fibers in several aquaculture species [23]. However, the development of technology and the availability of sequenced genomes and transcriptomes for many fish species will permit the identification of candidate regulatory genes involved to monitor larval growth. This would prevent in the future the costs associated with the production of individual with low growth potential [19].
Recently, molecular markers based on the fish genetic traits have been developed and applied to aquaculture for genetic identification and discrimination of aquaculture stocks (mt-DNA or nuclear DNA such as microsatellites, SNP or RAPD) and tocompare hatcheries and wild fish stocks [24]. However, few markers linked with aquaculture fish performance and production have been identified. Recently a marker for fish muscle growth, myosin light chain 2 protein (mlc2), a structural protein of the muscle, has been described and is a good candidate gene for assessing gilthead sea bream growth performance [19]. The development and growth of muscle comprises two fundamental processes: hyperplasia (the recruitment of new fibers) and hypertrophy (increase in size of existing fibers) and in gilthead sea bream mlc2a is highly expressed during hyperplasia while mlc2b is up-regulated during hypertrophy [25].
11
1.5 The desmosomes
Multicellular organisms have four types of cell-cell junctions: 1) gap junctions, intercellular channels that permit the free passage between the cells of ions and small molecules; 2) tight junctions, that regulate the passage of molecules and ions through the space between cells; 3) adherens junctions, that provide strong mechanical attachments between adjacent cells; and 4) desmosomes, localized patches that hold two cells tightly together [26]. Desmosomes (derived from the greek “desmos” meaning bond and “soma” meaning body [27]) are multiprotein complexes assembled in the plasma membrane and provide a connection between intermediate filaments of the cell cytoskeletons of adjacent cells, giving strength to tissues [28]. They are important in the maintenance of tissue architecture and form a transcellular web that allows cells to resist to mechanical stress [29]. In humans they are involved in fundamental processes such as cell proliferation, differentiation and morphogenesis [30].
Disruption of desmosomal structure has devastating consequences for tissue integrity and can lead to death [27] and there is a correlation between desmosomal diseases and aberrant cell signalling [31]. Several human diseases have been associated with functional impairment of desmosomes. As expected, skin and its appendages, heart and mucous membranes are the most affected, since desmosomal defects affect tissues and organs subjected do mechanical stress [29].
Figure 1.6:Immunofluorescence microscopy photograph of an epithelial cell line (PLC, hepatocellular carcinoma-derived cell line) stained with antibodies against desmoplakin (yellow) and keratin intermediate filaments (red). The cell nuclei are shown in blue. Arrowheads point to individual desmosomes that are lined up along the plasma membranes of adjacent cells. A’: Higher magnification of cell-cell contacts shown in A [29].
12
In other vertebrates, the gene repertoire and importance of the desmosomes in animal physiology remain largely unknown and in teleosts, that represent the largest and successful group of vertebrates, there is a sole study in the zebrafish. The desmosomal proteins were knocked down leading to tissue integrity reduction and the animal developed severe phenotypes such as shortened body axis, severely reduced or absent head and or tail, absence of clearly defined somites and sometimes blebbing of the epidermis [18]. This suggests that as in humans, these protein complexes also play an important role in tissue development and animal growth, however they remain to be explored and their importance in the maintenance of tissue integrity and potential usefulness as an additional molecular marker to monitor fish growth in aquaculture remains to be explored.
1.5.1 Desmosomes structure
Desmosomes are classically “spot welds” and their disc-shaped-like structures are highly organized and resistant to dissolution, pH extremes and most detergents [26]. They are dynamic cell structures of size between 0.1 to 0.5 μm and can be assembled and disassembled in response to signals from the micro-environment that are essential to allow morphogenic process (Figure 1.6) [28]. They are abundant in cells derived from the ectodermal lineages [31], and present in all epithelial cell and a few non-epithelial cell types, including myocardial and Purkinje fiber cells, meningeal cells and follicular dendritic cells of lymph nodes [29]. This type of cell junction is composed by three major protein families: cadherins, armadillo and plakins [32] (Figure 1.7).
13
Figure 1.7: Structure of a desmosome. The three major protein families that are responsible for maintaining the desmosome structure are represented: the cadherin family members: Dsc-Desmocollin (red) and Dsg-Desmoglein (green); the armadillo family: PG-Plakoglobin (blue) and PKPs-Plakophilins (pink); plakin family: DP-Desmoplakin (yellow) that links to intermediate filaments (IF). Adapted from [28].
This structure may vary according to the cell type and layer and also during embryonic and post-embryonic development. For example during epidermal differentiation, smaller and less-organized desmosomes in the basal layer are replaced by larger and more electrondense desmosomes [29,32]. Structurally, desmosomes can be divided into three parts: desmoglea or extracellular core, inner dense plaque (IDP) and outer dense plaque (ODP) [33]. To form this structure, each cell provides “half” of the adhesion complex [34]. The N-terminal domains of Dsc and Dsg are located in the extracellular core, the apparent intercellular space between the two “half-desmosomes” of neighbouring cells, of approximately 34nm of thickness (Figure 1.8) [29,33,35]. The C-terminal of Dsc and Dsg are located in the ODP, which is 15-20 nm thick. ODP consists of the Dsc and Dsg tails interacting with plaque proteins, PKP, DP and PG. DP binds to IF within the IDP, serving to tether the IF to the plasma membrane (Figure 1.8) [35].
14
Figure 1.8: Structural model of a desmosome. (A) Electron micrograph of a desmosome. (B) Schematic representation of the structural organization of a desmosome. PM- plasmatic membrane; IDP- inner dense plaque; ODP - outer dense plaque; PG-plakoglobin; DP- desmoplakin; PKP- plakophilins; IF- intermediate filaments; C – c-terminal and N- n-terminal [35].
1.5.2 The desmosomal cadherin family members
Desmogleins (Dsg) and the desmocollins (Dsc) belong to a subfamily of the cadherin superfamily. They are transmembrane proteins that bind heterophically and mediate calcium-dependent cell-cell adhesion [36]. In cultured cells, desmosomal adhesion can be initiated or disrupted by raising or lowering the extracellular calcium concentration, although, in vivo the extracellular Ca2+ concentration is assumed to be
always well above the concentration that is required to regulate desmosomes (+/- 0.1 mM) [36].
Dsc and Dsg structures share four extracellular cadherin repeats (EC1-4) and an extracellular anchor (EA) region, that form Ig-like globular domains with calcium
15
binding sites between each pair of consecutive repeats (Figure 1.9) [37]. These cadherin sequence repeats are approximately 110 aa in length and the first cadherin repeat (EC1) contains the cell adhesion recognition site (CAR) that possesses a central alanine residue responsible for the adhesive function between desmosomal cadherins. Both Dsc and Dsg also contain an intracellular anchor (IA) and a cadherin-like sequence (ICS), which is also conserved across the other cadherin members. The main difference between Dsc and Dsg is that the latter possesses additional unique sequences at the C-terminal region with yet unknown functions and this includes a proline rich linker region (IPL), a repeat unit domain (RUD) and a Dsg terminal domain (DTD) (Figure 1.9) [37]. In vertebrates, desmosomal cadherins are single transmembrane proteins that are encoded as precursor proteins containing a signal sequence and a prodomain that immediately precede EC1 and are removed by proteolysis [37].
In human, four Dsg (Dsg1-4) and three Dsc genes (Dsc1-3) have been identified and each of the Dsc transcripts exhibit alternative splicing of the cytoplasmic domain giving rise to a longer ‘a’ form and a shorter ‘b’ form (Figure 1.9) [32]. In the “b” form the region encoding the ICS domain is truncated and terminates with an additional 11 aa in Dsc 1 and 2, and eight residues in Dsc 3, not found in the “a” form [38].
Figure 1.9: Schematic representation of desmosomal cadherins, Dsc and Dsg. In human CAR - cell adhesion recognition; EC’s - extracellular cadherin repeats; EA- Extracellular anchor; CM- cytoplasmic membrane; IA- intracellular anchor; ICS- intracellular cadherin-like sequence; IPL-intracellular proline-rich linker; RUD-repeat unit domain; DTD- desmoglein terminal domain [30].
16
In human skin, depending on the cell type and cellular layer there are different combinations of Dsg and Dsc and simple epithelia express only the Dsg2/Dsc2, but stratified complex epithelia, such as the epidermis, express primarily Dsc1/3 and Dsg1/3 with low levels of Dsg2/Dsc2 in the basal layers and Dsg4 concentrated in the granular and cornified layers (Figure 1.10) [36].
Figure 1.10:Expression patterns of the desmosomal cadherins in the four layers of the epidermis in human [35].
The differentially expressed desmosomal cadherins are not fully understood, but the highly patterned distribution of different adhesion molecules may ensure maintenance of cell relationships during morphogenesis of multilayered tissues [32]. In the desmosome, the desmosomal cadherins bind directly to PG, also known as γ-catenin [30]. Dsc, Dsg and PG together in the absence of other desmosomal components can generate adhesion [36].
A wide range of studies have revealed that desmosomal cadherins are implicated in human diseases, especially in disorders associated with heart and the skin diseases (Table 1.3) [35].
17
Table 1.3: Tissue distribution of desmosomal cadherins in human and associated diseases [38].
Subfamily Members Expression Disease
Desmogleins Dsg 1 Stratified epithelia Pemphigus (vulgaris, foliaceus,
paraneoplastic)
Striate palmoplantar keratoderma Bullous impetigo
Staphylococcal scaled skin syndrome Dsg 2 Simple and stratified epithelia,
myocardium
Arrythmogenic right ventricular cardiomyopathy
Respiratory and urinary adenovirus infection
Dsg 3 Stratified epithelia Pemphigus (vulgaris, paraneoplastic) Dsg 4 Outermost epidermis, hair
follicle cells
Localized recessive hypotrichosis +/- recessive moniletrix
Desmocollins Dsc 1 Epidermis, hair follicle cells IgA Pemphigus
Dsc 2 Simple and stratified epithelia, myocardium
Arrythmogenic right ventricular cardiomyopathy
palmoplantar keratoderma and wooly hair
Dsc 3 Stratified epithelia Pemphigus vulgaris
Hypotrichosis with recurrent skin vesicles
In other vertebrates the existence of dsc and dsg are poorly explored and their role remains unknown. In zebrafish, a teleost model organism, a single dsc (zfdsc) has been isolated and the transcript has similar size to the mammalian “a” form of Dsc 1 with which it shares 68% of aa homology [18]. Two dsg (zfdsgα and zfdsgβ) have been also identified and they are expressed throughout the development of zebrafish and play an important role in the early embryo morphogenesis [18]. Zfdsgα exhibits 64% homology with the human Dsg 2 but data related to zfdsgβ is not available since the authors only isolated a fragment of the gene. Zfdsc and zfdsgα are expressed in egg and zfdsgβ starts to be expressed at 2.25 hours post fertilization. Knockdown experiments revealed that these proteins have an important role in embryo development and epiboly, gastrulation, convergence-extension movements and structure of desmosomes are affected. Zfdsc protein precursor comprises of a 16 aa signal sequence that is preceded by a 105 aa pre protein and the mature protein has 771 aa, the CAR region in human is YAT but in zebrafish is RAF. ZfDsgα has 40 extra aa, glycine-rich insert in the extracellular domain when compared to zfDsgβ. ZfDsgα comprises of a 16 aa signal sequence followed by a pre-protein composed of 21 aa, the CAR site in the is IAL rather than YAL in the human [18].
18
1.5.3 The desmosomal armadillo family members
PG and PKP are the armadilo family representatives in desmosomes. These proteins interact to the cytoplasmic tails of desmosomal cadherins and also to DP, which in turn links the desmosome to the IFs network of the cell (Figure 1.8) [29]. PG is a component of both adherens junctions and desmosomes and it has been suggested that cells expressing PG with C-terminal truncations have modified desmosomes. This deletion provokes the formation of large desmosomes, thus the C- terminus limits the size of desmosomes [39]. Beyond the structural function, PG is also found in the cell nucleus, where it plays a role as a gene expression regulator [29]. It was found that PG can control the expression levels of desmosomal genes, revealing an autoregulation mechanism [31]. Knockout studies in mice also identified a critical role for PG in desmosome assembly in vivo and PG null animals die because of fragility of the myocardium [40].
Armadillo proteins are characterized by a series of repeat motifs, designated as arm repeats (Figure 1.11) [41]. The central domain of PG comprises a highly conserved series of arms repeats that are involved in its association with Dsc and Dsg [39]. The interaction of armadillo proteins appears to be mediated by overlapping regions of the central arm repeats [39]. Structurally, PG contains 12 arm repeats of 42 aa each [39,43] and repeats (1– 4) are required for Dsg binding, whereas Dsc binding requires both ends of the arm domain [43].
PKP belong to the p120-catenin subfamily that shares a conserved central domain composed of 9 arm repeats, in contrast to the 12 in PG and β-catenin, and are flanked by a N- and C-terminal regions that diverge from one another (Figure 1.11) [44]. It has been proposed that PKP recruit DP to the desmosomal junctions and the lateral interaction between these two proteins extend the size of the desmosome [45].
Figure 1.11: Schematic representation of the armadillo proteins (PG and PKP). Hatched box represent the insert between repeats 5 and 6 that is only present in PKP [30].
![Table 1.1: Main differences between extensive, mesocosm and intensive aquaculture techniques [9]](https://thumb-eu.123doks.com/thumbv2/123dok_br/18625441.910684/26.892.118.770.151.587/table-differences-between-extensive-mesocosm-intensive-aquaculture-techniques.webp)
![Figure 1.4: World distribution of the gilthead sea bream. Colours indicate the relative probability of gilthead sea bream occurrence in the area [15]](https://thumb-eu.123doks.com/thumbv2/123dok_br/18625441.910684/30.892.193.700.106.440/distribution-gilthead-colours-indicate-relative-probability-gilthead-occurrence.webp)


![Figure 1.10: Expression patterns of the desmosomal cadherins in the four layers of the epidermis in human [35]](https://thumb-eu.123doks.com/thumbv2/123dok_br/18625441.910684/38.892.210.687.305.606/figure-expression-patterns-desmosomal-cadherins-layers-epidermis-human.webp)
![Table 1.3: Tissue distribution of desmosomal cadherins in human and associated diseases [38]](https://thumb-eu.123doks.com/thumbv2/123dok_br/18625441.910684/39.892.123.776.145.537/table-tissue-distribution-desmosomal-cadherins-human-associated-diseases.webp)
