Repositório ISCTE-IUL
Deposited in Repositório ISCTE-IUL:
2018-03-27Deposited version:
Post-printPeer-review status of attached file:
Peer-reviewedCitation for published item:
Davcik, N. & Rundquist, J. (2012). An exploratory study of brand success: evidence from the food industry. Journal of International Food and Agribusiness Marketing. 24 (1), 91-109
Further information on publisher's website:
10.1080/08974438.2012.645747Publisher's copyright statement:
This is the peer reviewed version of the following article: Davcik, N. & Rundquist, J. (2012). An exploratory study of brand success: evidence from the food industry. Journal of International Food and Agribusiness Marketing. 24 (1), 91-109, which has been published in final form at
https://dx.doi.org/10.1080/08974438.2012.645747. This article may be used for non-commercial purposes in accordance with the Publisher's Terms and Conditions for self-archiving.
Use policy
Creative Commons CC BY 4.0
The full-text may be used and/or reproduced, and given to third parties in any format or medium, without prior permission or charge, for personal research or study, educational, or not-for-profit purposes provided that:
• a full bibliographic reference is made to the original source • a link is made to the metadata record in the Repository • the full-text is not changed in any way
The full-text must not be sold in any format or medium without the formal permission of the copyright holders. Serviços de Informação e Documentação, Instituto Universitário de Lisboa (ISCTE-IUL)
Av. das Forças Armadas, Edifício II, 1649-026 Lisboa Portugal Phone: +(351) 217 903 024 | e-mail: [email protected]
1
An exploratory study of brand success: Evidence from the food industry
The running head: Brand success in the food industry
Dr. NEBOJŠA S. DAVČIK
ISCTE-IUL, Lisbon, Portugal
&
Dr. JONAS RUNDQUIST
School of Business and Engineering, Halmstad University,
Kristian IV Väg 4, 30118 Halmstad – Sweden
[email protected]
Key words: Branding, brand success, variance-based SEM, PLS, food industry, Sweden, Italy
Acknowledgement: The authors are very grateful to professors Francesco Favotto and Giacomo
Boesso (University of Padova) for their research support as well as to Laura Zanatta and Maddalena
Sisto for their help in Italian data collection. Comments and suggestions from Dr. Zoran Cajka (FEFA)
are highly appreciated. This research is partially funded by the PRIN 2006 of MIUR (Italian
University & Research Ministry), grant #: 2006072800_003. All mistakes and misunderstandings are
the authors’.
Abstract:
Managing a successful brand that is differentiated and consumer oriented can provide a
comprehensive competitive advantage. The goal of this research is to identify drivers that influence the
brand and to determine which drivers influence the brand more, in order to develop a more effective
business strategy. The main question is how the drivers in a proposed model contribute to brand
success.
An abductive theory approach is adopted and food managers from Italy and Sweden were
questioned. The paper explores the enriched-food brands in the Italian and Swedish markets. The
measurement scales were constructed using theory combined with suggestions from industry. The
authors modeled the eight constructs as nine correlated first-order factors.
The model includes seven
independent variables (consumer orientation, brand differentiation, brand knowledge, new brand
development, values, organization and strategy) and the dependent variable brand success. All
variables contain four to six items. The variance-based structural equation modeling approach, using
PLS algorithm, have been applied.
This study provides insight and empirical evidence on the development and enhancement of brand
success. The findings can be employed as more effective brand strategies in a sector that has been
under-investigated in academic literature and practice.
2
1. INTRODUCTIONOrganizational resources can boost an additional value to its stakeholders if brand management is successfully used and exploited. Brand management has attracted considerable attention in academic and business community in last two decades. The reasons for this increased awareness are the high cost of launching new brands, the high failure rates of new products (Crawford 1993; Pappu et al. 2005), the rising cost of promotional activities and the high costs of attracting and keeping new consumers.
If consumers perceive that a product with a specific brand name add more value than the competitor’s brand, this might develop sustainable and long-term competitive advantage for an organization (Aaker 1989; Agres & Dubitsky 1996; de Chernatony & Cottam 2006). The importance of successful brand building has been discussed in academic literature (e.g., Pappu et al. 2005; Agres & Dubitsky 1996), but there is no mutual agreement of what constitutes and guarantees success of a brand in the market (cf. Annacker & Hildebrandt 2004). If a brand is successful, it can protect an organization in an unstable environment (King 1991), it can develop a stronger negotiating position to its retailers (Park & Srinivasan 1994), and can help defend market position against competition and increase market shares (Adams 1995).
We can adapt famous Jaworski & Kohli (1993) question in: Why are some organizations’ brands more favorable and expensive than others? This question has been raised by many managers every day, but there is no clear answer or explicit theory. The authors’ motivation to conduct this study is based on the need to provide a better understanding of factors affecting brand effectiveness. The enriched-food industry has been chosen as a case because it has a strong growth rate and it is highly differentiated in a comparison to conventional foods (Boesso et al. 2009). As a mainstream food industry segment, it includes high levels of innovativeness and comprehensive marketing efforts in maintaining differentiation strategies. The high costs for R&D in this segment of the food industry makes price premium, and therefore branding, important. The development and management of an effective brand strategy in the enriched-food industry has been under-investigated in business practice and academic literature.
The authors have applied a variance-based structural equation modeling approach (PLS algorithm), because i) the nature of the study is exploratory, rather than (theory) confirmatory; ii) this approach allows formative as well as mixed models, not only reflective models; iii) prerequisites of the data distribution and sample requirements are less stringent than in the covariance-based SEM, which allows studying a small sample size [<100] (cf. Fornell & Bookstein 1982; Chin 1998b; Davcik 2011).
The authors’ intention is to contribute to the existing literature on branding in three ways. First, a brand success scale has been developed and tested empirically in two countries. The authors applied an abductive theory approach that is based on abductive reasoning in which explanatory propositions (hypothesis) are formed, using theoretical rationale and empirical experience of the subject, and evaluated, i.e., estimated with a statistical technique. Second, the characteristics of brand success drivers in a specific industry context were examined. The study is also a first attempt to determine the underlying factors of brand success in general. Third, this study has avoided the conventional focus on single-authored measures (e.g., Singh & Ranchhod 2004) as well as added operationalization adjustments from an industry, because a multifaceted approach to branding has been applied. Instead of focusing on a single perspective (e.g., financial, customer oriented), this approach includes internal, external, as well as interactive items in each variable.
A brief overview of the literature on successful brand building and its applicability will be presented in the following section. Background information on the industry context, measures, sample and data collection will be presented in section 3. Modeling procedure and varieties of statistical techniques are employed to confirm the reliability of the brand success drivers. These issues are discussed in section 4. The study concludes with a discussion about the managerial implications of the findings and some suggestions for further research directions are examined.
2. SUCCESSFUL BRAND AND ITS DRIVERS: TOWARD A CONCEPTUAL FRAMEWORK
Brand management is considered, by theory and practice, as a concept that can fully exploit the assets of an organization as well as generate an additional value from the brand investments (e.g., Pappu et al. 2005; Davcik et al. 2010). Advantages of successful brand building have been widely discussed in the literature (e.g., Pappu et al. 2005; King 1991; Park & Srinivasan 1994; Adams 1995), but only a few conceptual and quantitative studies on its antecedents have been conducted. Success factors studies in marketing should investigate the impact and consequences of success drivers (cf. Albers 2010), because the goal is not to confirm specific hypothesis but to identify and investigate the different impacts and influences of the various factors that explain brand success.
The discussion that follows presents a brief explanation of brand success factors and drivers employed in this study. The items constructs, depicted in Appendix (Table 5), reflect an attempt to offer a solution for a brand management application in a
3
business framework, as well as a starting point for discussion and further research.Brand success is determined by the impact of the various success drivers, which are measured as market share, revenue, profit, premium price, ROI, brand value, etc. (e.g., Aaker 1991; Aaker et al. 2004; Kotler 1999; Davcik et al. 2010; Albers 2010; cf. Annacker & Hildebrandt 2004). An adequate assessment of brand success cannot be achieved without an appropriate marketing performance audit and activity measurement. Clark & Ambler (2001, p. 231) have defined marketing performance measurement as the assessment of “the relationship between marketing activities and business performance”. It is widely accepted that brand equity represents the value of the brand (e.g., Aaker 1991; Aaker et al. 2004; Kotler 1999; Kotler & Armstrong 1999; cf. O’Sullivan & Abela 2007), which is a cornerstone for brand success in the market.
Differentiation has been defined as “…the act of designing a set of meaningful differences to distinguish the company’s offering from competitors’ offerings” Kotler (1999, p. 287). Companies that employ differentiation strategy are more market oriented than those that employ cost-leadership strategy (Narver & Slater 1990). This is the case because differentiators compete on brands that gain higher prices in the market, while cost leaders are more oriented on low price competition (Sandvik & Sandvik 2003; Davcik et al. 2010). Agres & Dubitsky (1996) have concluded, in their study on successful brand building strategy, that delivering differentiating brand benefits is more appealing for the successful strategy than improving product quality.
Knowledge is not a media consequence, but the results of a communication process between an organization and its stakeholders (Agres & Dubitsky 1996; Boesso et al. 2009). Examples of such stakeholders in the industry are suppliers, consumers, and competitors. In addition, knowledge sources, such as universities or consultancies, can be considered stakeholders, too. It is important for the organization to find information from all these stakeholders in order to be able to load the brand with relevant content. In this study, such knowledge from stakeholders is termed brand knowledge.
Consumer orientation represents the capability to understand the consumer’s needs (current and/or latent) that shall be satisfied in an efficient and timely manner. Deng & Dart (1994) have argued that consumer orientation represents the extent to which marketers succeed at increasing long-term consumer satisfaction. The marketing concept, and its operationalization side – market orientation, are based on a premise that all organizational activities must be focused on satisfaction of consumer’s need (Kotler 1999; Deng & Dart 1994).
A value plays a crucial role in any marketing activity (Holbrook 1999). In the literature (e.g., Kotler
1999; Holbrook 1999), it has been argued that marketing, as a managerial process, facilitate the exchange of interest as a transaction between two parties in the process where each of them offers some value in return for a greater value. In its essence, consumer value represents the evaluation of an object offered by an organization. The complexity of this concept lies in the fact that “object” is a multi-dimensional “effect” framed by shape, name, (in)tangibles, colors, promises, experiences, etc. – it has each of these constructs or a few of them.
There are a great number of scientific approaches and theories on most effective and state-of-the-art organizational design, but the most intricate organizational paradigm of the last two decades is related to the contingency factors approach. This research approach is based on congruence hypothesis, e.g. that effective organizational structuring requires a fit between contingency factor and design parameter (Mintzberg 1980). Cyert & March (1963) have suggested that a business organization is constrained by the uncertainty of its environment. Organizations have problems to maintain a viable coalition and have limitations with its capacities for assembling, storing and utilizing information. As a result, a company can be characterized as an adaptively rational system rather than an omnisciently rational system. Because of that, an organization must obtain information from its environment because it wants to reduce uncertainty with more information. New information from the environment – new brands, market results, competitors’ actions, etc. – gives new sense to an organization. Weick et al. (2005) have advocated that an organization must develop its capacity to make sense of events in order to construct meaning and establish organizational actions.
Knox (2000) has argued that brands are strategic management tools because they represent the company (e.g., its reputation and values). According to him, branding has proved to be the critical factor in all marketing processes, as well as a common denominator to business success. Porter (1996) defines strategy as a process, in which a unique and valuable position is created involving a different set of activities. In other words, strategic positioning represents “…performing different activities from rivals’ or performing similar activities in different ways” (Porter 1996, p. 62). Fuchs & Diamantopoulos (2010) have shown that positioning strategy affects the success of brands and benefit-based strategy (i.e., value oriented) is superior over feature-based strategy.
In order to reach brand success, new brand development is important (cf. Boesso et al. 2009). This is valid for service industries (e.g., Berry 2000) as well as for goods-producing industries (e.g., Wong & Merrilees 2005). New brand development is highly relevant also in the food industry, as Nevo (2001) has argued that a firm’s growth in the cereal industry was driven by “aggressive marketing, rapid introduction of
4
new brands and fueled by vitamin fortification, pre-sweetening and the surge of interest in natural cereals” (Nevo 2001, p. 310). John et al. (1998) have shown that development of new brands is a strong complement to brand extension, as brand extensions may dilute the original brand and decrease profit. New brands can create new markets that do not affect established brands and erode existing markets. It can therefore be assumed that new brand development is positively associated with brand success.A preceding discussion leads us to the research proposition:
P: Numerous factors contribute to brand success performance; of which, the most prominent are: consumer orientation, brand differentiation, brand knowledge, new brand development process, values, organization and creation of the brand strategy.
The Proposition frames an overall structure of the possible relationships amongst the constructs (Wong & Merrilees 2005) that can facilitate quantitative, multivariate data analysis, approach.
3. BRAND SUCCESS MODEL
3.1. Sample and data collection
The data was collected from Italian and Swedish companies that manage enriched-food brands at their respective markets. The enriched-food brands (EFB) represent brands that have added value or characteristics different from the conventional food, such as vitamins and foods with functional and organic ingredients. Many categories of healthy products, such as dietary, organic, functional, integrative, etc., might be embedded in this food group, in which each of these specific sub-groups have been characterized by a specific functional ingredient or trait (Boesso et al. 2009). For instance, health-enhancing food might be defined as natural or processed food or food ingredients that bear health enhancing benefits beyond their primary nutritional functions (Bogue & Sorenson 2001). Functional and organic foods can be included in this subgroup.
The questionnaire responses were collected through an online survey, using Quicksearch software. The advantages of an online survey are (i) easy to use in the statistical software, such as SPSS, STATA, LISREL, etc.; Rundquist (2011) has advocated that (ii) respondents fill out a form faster than with interviews or in return mail envelopes, (iii) the results are directly stored in a database, (iv) it is immediately registered when a respondent answers the survey, and (v) it allows
respondents to answer in their spare time or at home in a less stressful situation. Each respondent could choose to answer in English, Italian or Swedish.
The authors identified 125 brands from this industry group; 45 in Italy and 80 in Sweden. The respondents returned 58 answers; 21 from Italy and 37 from Sweden (response rate 46.4% of total sample; 47% in Italy and 46% in Sweden). This response rate is satisfactory because i) acceptable rates for cross-sectional samples have ranges between 12% and 20% (Churchill & Iacobucci 2009; O’Sullivan & Abela 2007), and ii) the variance-based SEM, PLS algorithm, has been applied which allows using a small sample size [<100] (Chin 1998b; Hair et al. 2011).
The data was collected over a period of six weeks. After an initial email request with a link to a questionnaire on the internet, the authors sent two additional email reminders on a two-week basis, with a possibility for a respondent to be removed from the list and the survey on request. The Quicksearch software allowed us to “force” the respondent to answer on all questions from the questionnaire, in a manner that they could not pass to the next question if they do not answer on previous, which provided us with no missing values in the data set. In order to avoid the creation of common method variance that may defile construct relationships, respondents were not informed about specific goal of the research (Sousa & Bradley 2009).
3.2. Development of instruments
The measures employed in this study are based on literature and adjusted according to industry feedback. Preliminary versions of the survey were tested with three senior academics in marketing / management field. Their feedback was included in the final pre-test version of the survey that was tested by four marketing executives in food industry. The pre-test respondents were precluded from participation in the final survey. Results of the pre-test showed necessary adaptation of the constructs and clarification of the questions and items included. The factor constructs and items were revised accordingly. All items in the survey are statement style and measured on the Likert scale from 1 (strongly disagree) to 7 (strongly agree).
The authors employed a perceptual approach in this study, as opposed to objective financial data, due to the impossibility in obtaining objective data from the companies. An objective research approach could not be applied due to the proprietary data and confidentiality issues. The subjective approach is well known in the literature (e.g., Jaworski & Kohli 1993; Singh & Ranchhod 2004) and strong correlation between the two approaches has been reported. For instance, Venkatraman and Ramanujam (1987, p. 118) have drawn the conclusion that “perceptual data from senior managers … can be employed as acceptable operationalizations of business economic performance”.
5
Their conclusion is based on the results from asking senior executives to rate their firm’s performance relative to that of major competitors using a number of criteria, including sales growth, net income growth and ROI, and comparing their answers with objective performance statistics. In this study, marketing managers from each organization were questioned in order to obtain senior executive information.3.3. Measures
Brand Success. The authors measured brand success with items adopted from various resources (e.g., O’Sullivan & Abela 2007; Singh & Ranchhod 2004). The item constructs have been developed within a branding framework using the success performance outcomes (e.g. profitability, market share, ROI) by O’Sullivan & Abela (2007) and higher brand loyalty as surrogate for the customer satisfaction idea by Singh & Ranchhod (2004). The Brand differentiation item constructs are inspired by Porter (1996; 1998) and Sandvik & Sandvik (2003), but adapted according to the suggestions from the industry managers. The Brand knowledge items constructs have been inspired by Frishammar (2002) and McDonald et al. (2007), and have been improved with suggestions from the industry. The Consumer orientation items construct are adapted from Deng & Dart (1994) and Singh & Ranchhod (2004). The idea for the new brand development items construct came from Kotler’s (1999) discussion on brand challenges and advantages, and was refined with suggestions from industry managers. The values items were inspired by Holbrook (1999) and adapted to the study with suggestions from the industry. The organization items construct was inspired by seminal works of Mintzberg (1980), Lawrence & Lorsch (1967), Cyert & March (1963) and Weick et al. (2005) with necessary item adaptation for this study. The authors measure the creation of the competitive strategy with items adopted from Singh & Ranchhod (2004) and Jaworski & Kohli (2003).
4. MODELING PROCEDURE AND RESULTS
In assessing the model, the authors have applied the two-step approach suggested by Hair et al. (2010) and Anderson & Gerbing (1988), estimating a measurement model before the assessment of the multivariate model construction. The justification of this approach needs an accurate assessment of the reliability of indicators. Hair et al. (2010) have advocated that the best approach is a single-step analysis with simultaneous analysis of measurement models. However, in practical applications, researchers are always faced with less
reliable measures and two-step approach is necessary to increase the interpretability of the models and to avoid possible bias interaction among estimated models.
One may ask why the authors employed the variance-based SEM (VBSEM), instead of much more known and applied the covariance-based SEM (CBSEM). The authors decided to apply this technique because of different research perspectives that are based on theory, specification of the measurement model, sample characteristics and assessment of the goodness-of-fit (Davcik 2011). The nature of this study is to predict and explore the relationships among different constructs, rather than to confirm specific theoretical rationale. The authors applied the VBSEM approach because it intends to predict the performance of the construct relationships (Fornell & Bookstein 1982; Hair et al 2010; Davcik 2011), that is, to explain the variance. However, CBSEM is based on estimation of the covariance matrices, that is, to confirm the theoretical rationale that was specified by the model (Davcik 2011). Specification of the measurement model under the VBSEM approach allows reflective, formative and mixed models. The CBSEM approach is theoretically and empirically embedded in reflective paradigm (e.g., Fornell & Bookstein 1982; Davcik 2011; Edwards & Bagozzi 2000). The data distribution assumptions and sample size requirements are less stringent in the VBSEM than in the CBSEM approach (Fornell & Bookstein 1982; Chin 1998a, 1998b; Davcik 2011; Hair et al. 2010; Hair et al. 2011; cf. Henseler et al. 2009; Marcoulides & Saunders 2006).
In order to assess the fit of the model and its estimates, the authors have applied the variance-based structural equation modeling using the PLS path analysis. the authors have used SPSS 18 to analyze the data and SmartPLS for structural equation modeling.
4.1. Unidimensionality, reliability and common method bias
Because the data was collected in the same period of time and all measures were based on a similar construction, there is a risk of common method bias. The authors used Harman's test (Harman 1967; Podsakoff & Organ 1986) to test, and an un-rotated solution in the exploratory factor analysis gave eleven components with an eigenvalue above 1.000. The first factor accounted for 25.03% of the variance and eleven factors together accounted for 76.64% of the variance. Therefore, the common method bias is not likely to have a significant impact on this study.
Anderson and Gerbing (1988) have recommended examination of the item scales for unidimensionality and reliability as a first step in survey data analysis. The corrected item-item and item-total correlations for each factor were examined in order to reach unidimensionality. This process used one scale at a
6
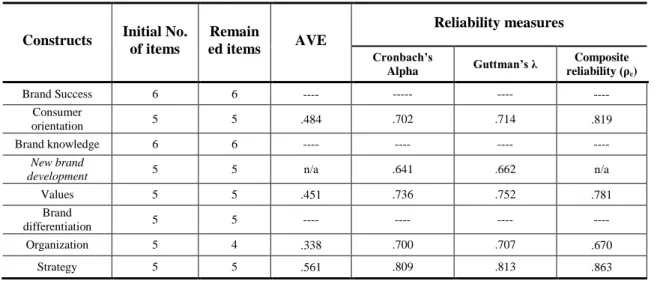
time within each multi-item construct. If the coefficients alpha (Cronbach 1951) and Guttman’s λ (Guttman 1945) were lower than 0.7 within multi-item scale, the item(s) with the lowest item-total correlation were eliminated from the scale until reaching the preferred 0.7 level for the multi-item scale. Some evidence on unidimensionality and composite reliability are presented in Table 1.The evidence of internal model consistency provided by composite reliability measured by coefficients α and λ have been presented in Table 1. The alpha measure of reliability is the most commonly used for a set of multi-construct indicators (Hair et al. 2010) and widely used in the multivariate data research. However, the authors report Guttman’s lambda along with the alpha, because it is upper-bond to alpha. Table 1 indicates that all reflective constructs, except new brand development, satisfy reliability minimum level (> .700). The new brand development failed to satisfy minimum reliability level (.641) and this construct will be excluded from further analysis.
TAKE IN TABLE 1
The results of the discriminant validity test are reported in Table 1. The average variance extracted (AVE) exceed recommended 0.5 level (Fornell & Larcker 1981). In addition, the shared variance among constructs in the model, measured by the square of their intercorrelations, is smaller than the AVE for each construct (Fornell & Larcker 1981), which means that discriminant validity is not a concern. After the composite reliability analysis, the authors have examined results for offending estimates. No offending estimates were found in constructs – e.g. negative variances, non-significant error variances, and not positive defined correlation matrices as well as correlations larger than 1.
In the second step of the model assessment, the authors have reported the composite reliability (ρc),
depicted in Table 1, for the reflective constructs in the outer model. This reliability indicator is reported for all construct, except for the new brand development because it was excluded from the analysis in the first step of the model assessment. The ρc is applied in the
variance-based SEM as a control for the internal consistency of the model. This coefficient can be interpreted in the same way, as the alpha coefficient (Chin 1998b; Henseler et al. 2009). The composite reliability coefficient does not assume tau equivalency among the constructs, and has a more accurate parameter estimates in comparison to alpha and lambda coefficients (Davcik 2011; cf. Werts et al. 1974).
Debate about the nature and specification of the measurement model in the structural equation modeling is beyond the scope of this manuscript. For a more thorough discussion, the following articles are recommended (e.g., Fornell & Bookstein 1982; Chin 1998b; Edwards & Bagozzi 2000; Diamantopoulos &
Winklhofer 2001; MacKenzie et al. 2005; cf. Buil et al. 2010; Chin 1998a).
TAKE IN TABLE 2
The authors have controlled the latent constructs for multicollinearity by the assessment of the variance inflation factors (VIF). All variance inflation factors, presented in Table 2, have a value of less than 3, which is bellow the stringent threshold value of 3.33, and especially a far below the standard critical value of 10 (e.g., Diamantopoulos & Siguaw 2006; Davcik 2011; Cenfetelli & Bassellier 2009). The authors conclude that multicollinearity is not likely to influence the model performance. The authors present descriptive statistics (i.e., mean and standard deviation), see Table 2, for the employed factors in order to underline their relative importance. The Wald test for the Italian and Swedish factors is presented in Table 2. The important differences between the national samples exist within the four factors: success, brand knowledge, organization and values. There is no significant difference between the national samples regarding the three factors: consumer orientation, differentiation and strategy. The strategic dimension of the study reveals that there is no difference between Italian and Swedish companies. In other words, as it is presented in Table 2, 85.56 % of Italian and Swedish companies have same consumer orientation and 38.08 % of the companies in both countries apply the same branding strategy. Brand differentiation is similar to 51.51 % of the analyzed companies. These results are somewhat intuitive because they reveal that managers in these two countries apply the same marketing logic that leads to the similar strategy and consumer orientation in two countries.
The results of control variables attract some attention. The authors have found that number of employees (t = 4.1562, meanI = 3.47, meanS = 2.46) has
significant difference between the two groups but, in contrary, brand annual turnover (t = 0.6309, meanI =
3.47, meanS = 3.33) has no significant difference
between two countries. There is a significant difference between the two countries regarding size (number of employees), as the Italian companies are mostly medium sized or large players at the enriched-food market. In contrary, the Swedish companies are dominantly small or medium sized enterprises that specialize in “health” business. Because of this finding, it is not surprising that a brand annual turnover, as a control variable, has no statistical difference. This is the case due to the lack of specialization and focus on a healthy market segment by Italian companies.
7
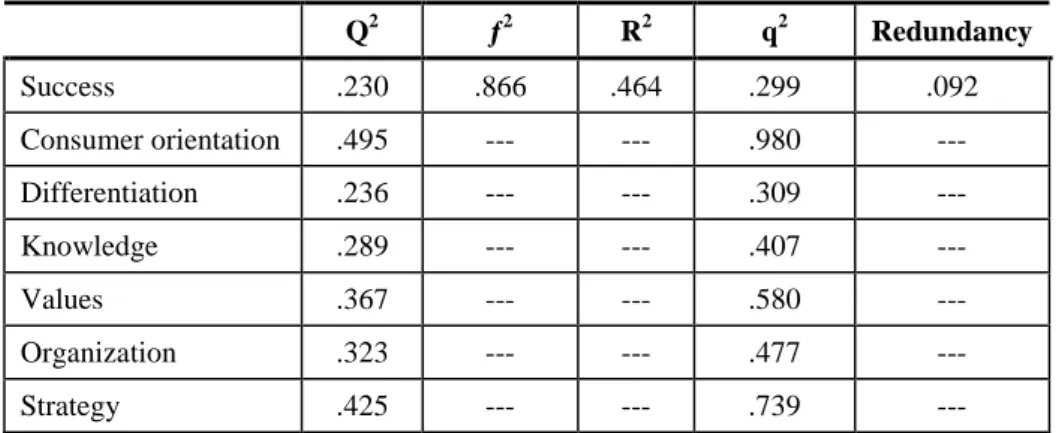
The structural model criterions are presented in Table 3. The predictive relevance of the model is assessed by the examination of the Q2 indicator, which represents a fit between observed values and values reconstructed by the model (Davcik 2011). The model under study has predictive relevance and observed variables are well reconstructed, because all Q2 values are above zero (Fornell & Bookstein 1982; Davcik 2011). The relative impact of the predictive relevance can be assessed by the q2 indicator. A model has a small impact of the predictive relevance if q2 ≤ .02, a medium impact of the predictive relevance if q2 has the value between .02 and .35; and a strong impact of the predictive relevance if q2 ≥ .35 (Davcik 2011). The assessed variables of the model reveal a medium impact of the predictive relevance for brand success and brand differentiation and a strong impact of the predictive relevance for all other variables.TAKE IN TABLE 3
The coefficient of determination has a substantial value R2 of .464, which suggest well explanatory power of the model (cf. Chin 1998b). The effect size, which represents the proportion of variance of the dependent construct that remains unexplained, has a value of f2 = .866. This signifies large effects of the endogenous variable in the model. Performing variance-based SEM on mixed model is equal to redundancy analysis (Fornell et al. 1988; Davcik 2011). Redundancy refers to the mean variance in the dependent construct, which is predicted by the independent constructs of the model (cf. Chin 1998b; Davcik 2011). Redundancy analysis in the model shows a good fit of the brand success factor, because it reveals a low level of redundancy (.092).
TAKE IN TABLE 4
The standard method to test the significance of variance-based SEM results is the application of nonparametric bootstrapping technique (Henseler et al. 2009; Davcik 2011). The inner path coefficients and corresponding statistics (t-statistics, standard deviations and standard errors) are presented in Table 4. The authors have found that consumer orientation and strategy are highly related to brand success (p ≤ .01). The differentiation and knowledge variables have a medium effect on the brand success (p ≤ .05). The relation between the two factors (organization and values) and brand success have no statistical significance. This empirically suggests that the overall influence of brand success is primarily explained by consumer orientation, differentiation, knowledge and strategy.
5. CONCLUSIONS
The authors have made a first attempt to determine the underlying factors of brand success as well as to make the connection between them. The study makes a conceptual contribution, based on empirical analysis, in further refinement of the eight constructs that have not been well specified and investigated in marketing literature. In order to achieve such a comprehensive goal several aims and results have arisen.
The first aim of this study was to develop a brand success scale. This scale was developed in an interactive process combining theory and empirical frameworks from other industries with opinions and Delphi-studies among marketing managers. The scale developed contributes as a benchmark for future studies on brand success.
The second aim was to investigate basic factors that can constitute successful brand development. The research findings suggest that there are four underlying factors, which are significantly related to the brand success. These factors were labeled as consumer orientation, differentiation, brand knowledge and strategy. The results, presented in Table 3, suggest that the model has predictive relevance and all variables are well reconstructed. The authors have showed that differentiation, based on brand value and consumers’ perception about the quality of the brand (cf. Davcik et al, 2010), is a tool that drives brand success in the market. An applied strategy plays important role in the success of brands. The authors have successfully tested importance of different indicators that may influence the applied brand strategy, testing both strategic orientations: value-based and feature-based strategy (cf. Fuchs & Diamantopoulos 2010). The finding that brand knowledge is of the highest importance for brand success brings new theoretical challenges. Knowledge needed to develop the brand value is resident in many sources such as suppliers, institutes or just general trend or demographic knowledge. On the other hand, as Hunt & Derozier (2004) emphasize, the capability of anticipating and envisioning future trends in customer needs and wants is crucial for successful brand management. It is well known where such knowledge can be found, but previous studies have pointed out the problem of bringing acquired knowledge to use in development processes. These issues have been addressed in the context of product development, but the transformation of models to a brand development context and the testing in industry specific context would contribute to theoretical understanding as well as offer important implications for managers.
The Wald test has been employed to analyze the difference and significance between Italian and Swedish companies. The test findings are consistent with the expectation that there is a significant difference among factors in two countries, namely with brand success, importance in a brand knowledge sources, company values as well as a brand influence
8
on organization. However, the authors have also found consumer orientation, brand differentiation and strategy priorities have no statistical significance across the groups. At first glance this result can be rather strange and confusing, as it could be expected that there are significant differences across markets and business practices. The authors believe that these results indicate an important message. These three factors are related to the strategic side of the brand management process, rather than tactical and operational, and can represent the strategic orientation of the companies. This finding indicates similar marketing logic, applied marketing strategies and consumer orientation between Italian and Swedish companies.Finally, this study has contributed with a multifaceted scale to measure factors with effect on
brand success. In contrast to other measuring scales, measures in this study take a wider grip and are therefore more applicable in practical situations as well as useful for research. The influence of the scales from the Delphi group of managers has also contributed to the usefulness of the scales.
A limitation of the study is the relatively small respondent sample, even though it satisfies statistical and research standards. This is the case due to a relatively narrow industry segment of the enriched-food industry. It will be valuable to expand this research on other food segments, to replicate this study in other countries and to adjust it for other industries with the attempt to validate current findings and to draw conclusions that are more general on brand success and its antecedents.
REFERENCES
Aaker, David (1989). Managing assets and skills: the key to a sustainable competitive advantage. California Management Review, 31 (2), 91-106
Aaker, David (1991). Managing Brand Equity: Capitalizing on the value of a brand name, New York: The Free Press
Aaker, David, Kumar, V. and Day, G. (2004). Marketing Research, 8th edition, New York: John Wiley & Sons
Adams, J. (1995). Brands at the crossroads. American Advertising, 11 (3), 18-20
Agres, Stuart J. and Tony M. Dubitsky (1996). Changing Need for Brands. Journal of Advertising
Research, Jan/Feb, 21-30
Albers, Sönke (2010). PLS and Success Factor Studies in Marketing. In Handbook of Partial Least
Squares: Concepts, Methods and Applications, Espozito Vinzi, V., Chin, W.W., Henseler, L. and Wang, H., eds., 1st ed., (pp. 409-426), Springer Annacker, Dirk and Lutz Hildebrandt (2004).
Unobservable effects in structural models of business performance. Journal of Business Research, 57 (May), 507-517
Anderson, James C. And David W. Gerbing (1988). Structural Equation Modeling in Practice: A Review and Recommended Two-Step Approach. Psychological Bulletin, 103 (3), 411-423 Berry, L. (2000). Cultivating Service Brand Equity.
Journal of the Academy of Marketing Science, 28 (1), 128-137.
Boesso, G., Davcik, N. St. and Favotto, F. (2009). Health-enhancing products in the Italian food industry: multinationals and SMEs competing on yogurt. Journal of Agrobiotechnology
Management and Economics, 12 (2), 155-166 Bogue, Joe and Sorenson, Douglas (2001). An
exploratory study of consumers' attitudes towards health-enhancing foods. Agribusiness Discussion Paper, No. 36, Department of Food Business & Development, University College Cork, Cork Buil, Isabel, Eva Martinez and Leslie de Chernatony
(2010). Brand Equity: A Higher-Order Formative Measure. In Contemporary Issues in Brand Research, George Christodoulides et al., eds. Athens: ATINER, 257-270
Cenfetelli, Ronald T. and Geneviève Bassellier (2009). Interpretation of Formative Measurement in Information Systems Research. MIS Quarterly, 33 (4), 689-707
Chin, Wynne W. (1998a). Issues and Opinion on Structural Equation Modeling. MIS Quarterly, 22 (1), vii-xvi
Chin, Wynne W. (1998b). The Partial Least Squares Approach to Structural Equation Modeling. In Modern Methods for Business Research, Marcoulides G.A., ed. Mahwah: Lawrence Erlbaum Associates, 295-358
Churchill, Gilbert A. and Dawn Iacobucci (2009), Marketing Research: Methodological Foundations, 10th ed., South-Western College Pub, Cincinnati, Ohio
Clark, Bruce H. and Tim Ambler (2001). Marketing Performance Measurement: Evaluation of Research and Practice. International Journal of Business Performance Management, 3 (Winter), 231-244
9
Crawford, M. (1993). New Products Management.Homewood: Irwin
Cronbach, Lee J. (1951). Coefficient Alpha and the Internal Structure of Tests. Psychometrika, vol. 16 (3), 297-334
Cyert, Richard and James March (1963). A Behavioral Theory of the Firm, Blackwell Publishers, Massachusetts
Davcik, Nebojsa St. (2011). The use and misuse of structural equation modeling in business research: A review and critique. Mimeo, (under review) Davcik, Nebojsa St., Giacomo Boesso and Francesco
Favotto (2010). Does Branding Drive Price Differentiation? Functional, Organic & Wellness Food in Italy. In Contemporary Issues in Brand Research, George Christodoulides et al., eds., Athens: ATINER, 293-305
de Chernatony, Leslie & Susan Cottam (2006). Internal brand factors driving successful financial services brands. European Journal of Marketing, 40 (5/6), 611-633
Deng, Shengliang and Jack Dart (1994). Measuring Market Orientation: A Multi-factor, Multi-item Approach. Journal of Marketing Management, 10 (8), 725-742
Diamantopoulos, Adamantios and Judy A. Siguaw (2006). Formative Versus Reflective Indicators in Organizational Measure Development: A
Comparison and Empirical Illustration. British Journal of Management, 17 (4), 263-282
Diamantopoulos, Adamantios and Heidi M. Winklhofer (2001). Index Construction with Formative Indicators: An Alternative to Scale Development. Journal of Marketing Research, XXXVIII (May), 269-277.
Edwards, Jeffrey R. and Richard P. Bagozzi (2000). On the Nature and Direction of Relationships Between Constructs and Measures (lead article), Psychological Methods, 5 (2), 155-174.
Fornell, Claes, Donald W. Barclay and Byong-Duk Rhee (1988). A model and simple iterative algorithm for redundancy analysis. Multivariate Behavioral Research, 23 (3), 349-360
Fornell, Claes and Fred L. Bookstein (1982). Two structural Equation Models: LISREL and PLS Applied to Consumer Exit-Voice Theory. Journal of Marketing Research, XIX (November), 440-452
Fornell, Claes and David F. Larcker (1981). Evaluating Structural Equation Models with Unobservable
Variables and Measurement Error. Journal of Marketing Research, XVIII (February), 39-50 Frishammar, J. (2002). Characteristics in information processing approaches. International journal of information management, 22, 143-156. Fuchs, Christoph and Adamantios Diamantopoulos
(2010). Evaluating the effectiveness of brand-positioning strategies from a consumer
perspective. European Journal of Marketing, 44 (11/12), 1763-1786
Guttman, Louis (1945). A basis for analyzing test-retest reliability. Psychometrika, 10 (4), 255-282 Jaworski, Bernard J. and Ajay K. Kohli (1993). Market
Orientation: Antecedents and Consequences. Journal of Marketing, 57 (July), 53-70
Hair, Joseph F., William Black, Barry J. Babin, Rolph Anderson (2010). Multivariate data analysis, 7th ed., Prentice Hall
Hair, Joseph F., Marko Sarstedt, Christian M. Ringle and Jeannette A. Mena (2011). An assessment of the use of partial least squares structural equation modeling in marketing research, Journal of the Academy of Marketing Science, doi:
10.1007/s11747-011-0261-6, published online: 07 June 2011
Harman, H. (1967). Modern factor analysis, 2nd ed., University of Chicago Press, Chicago Henseler, Jorg, Christian M. Ringle and Rudolf R.
Sinkovics (2009). The use of partial least squares path modeling in international marketing. Advances in International Marketing, 20, 277-319
Hunt, Shelby D. and Caroline Derozier (2004). The Normative Imperatives of Business and Marketing Strategy: Grounding Strategy in Resource-Advantage Theory. Journal of Business & Industrial Marketing, 19 (1), 5-22.
King, S. (1991). Brand-building in the 1990s. Journal of Consumer Marketing, 8 (4), 43-52
Kotler, Philip (1999). Marketing Management; The Millennium Edition, Prentice Hall International, Upper Saddle River, NJ
Kotler, Philip and Gary Armstrong (1999). Principles of Marketing; 8th edition, Prentice Hall International, Upper Saddle River, NJ
Knox, Simon (2000). Branding and positioning. In Marketing Management: A Relationship Marketing Perspective by Cranfield School of Management, MacMillan Press Ltd., London
10
Lawrence, Paul R. and Jay W. Lorsch (1967).Differentiation and Integration in Complex Organizations. Administrative Science Quarterly, 12 (1), 1-47
MacKenzie, Scott B., Philip M. Podsakoff and Cheryl B. Jarvis (2005). The problem of Measurement Model Misspecification in Behavioral and Organizational Research and Some
Recommended Solutions. Journal of Applied Psychology, 90 (4), 710-730
Marcoulides, George A. and Carol Saunders (2006). PLS: A Silver Bullet. MIS Quarterly, 30 (2), iii-ix McDonald, G., Killerby, S., Maplesden, F. and Rolland
D. (2007). Developing a stakeholder analysis to aid bio-based product innovation. Journal of Product & Brand Management, 16 (6), 386-400. Mintzberg, Henry (1980). Structure in 5'S: A Synthesis
of the Research on Organization Design. Management Science, 26 (3), 322-341
Narver, J.C. and S. Slater (1990). The Effect of a Market Orientation on Business Profitability. Journal of Marketing, 54 (October), 20-35
Nevo, A. (2001). Measuring Market Power in the Ready-to-Eat Cereal Industry. Econometrica, 69, 307-342
O’Sullivan, Don and Andrew V. Abela (2007).
Marketing Performance Measurement Ability and Firm Performance. Journal of Marketing, 71 (April), 79-93
Pappu, Ravi, Pascale G. Quester, and Ray W. Cooksey (2005). Consumer-based brand equity: improving the measurement – empirical evidence. Journal of Product & Brand Management, 14(3), 143 – 154 Park, C.S. and Srinivasan, V. (1994). A survey-based
method for measuring and understanding brand equity and its extendibility. Journal of Marketing Research, 31 (2), 271-288
Podsakoff, Phillip M. and Organ, Dennis W. (1986). Self-reports in organizational research: Problems
and prospects. Journal of Management, 12 (Winter), 531-544
Porter, Michael E. (1996). What is Strategy?. Harvard Business Review, Nov-Dec, 61-77
Porter, Michael E. (1998), On Competition, Boston: Harvard Business School Press
Rundquist, Jonas (2011, forthcomming, pre-print). The ability to integrate different types of knowledge and its effect on innovation performance.
International Journal of Innovation Management. Sandvik, Izabela L. and Kare Sandvik (2003). The
impact of market orientation on product innovativeness and business performance. International Journal of Research in Marketing, 20, 355-376
Singh, Satyendra and Ashok Ranchhod (2004). Market orientation and customer satisfaction: Evidence from British machine tool industry. Industrial Marketing Management, 33, 135-144 Sousa, Carlos M.P. and Frank Bradley (2009). Price
adaptation in export markets. European Journal of Marketing, 43 (3 / 4), 438-458
Venkatraman, N. and Vasudevan Ramanujam (1987). Measurement of business economic performance: an examination of method convergence. Journal of Management, 13 (1), 109-122
Weick, Karl E., Kathleen M. Sutcliffe and David Obstfeld (2005). Organizing and the Process of Sensemaking. Organization Science, 16 (4), 409-421
Werts, C.E., Linn, R.L. and Karl G. Jöreskog (1974). Intraclass reliability estimates: Testing structural assumptions. Educational and Psychological Measurement, 34 (1), 25-33
Wong, Ho Y., and Bill Merrilees (2005). A brand orientation typology for SMEs: A case research approach. Journal of Product and Brand Management, 14 (3), 155-162
11
Table 1: Unidimensionality and composite reliability
Constructs Initial No. of items Remain ed items AVE Reliability measures Cronbach’s Alpha Guttman’s λ Composite reliability (ρc) Brand Success 6 6 ---- --- ---- ---- Consumer orientation 5 5 .484 .702 .714 .819 Brand knowledge 6 6 ---- ---- ---- ---- New brand
development 5 5 n/a .641 .662 n/a
Values 5 5 .451 .736 .752 .781
Brand
differentiation 5 5 ---- ---- ---- ----
Organization 5 4 .338 .700 .707 .670
Strategy 5 5 .561 .809 .813 .863
Table 2: Descriptive and measurement statistics
Factor Group t–value
(p-value) VIF mean SD
Brand success Italian 2.2879 (0.026)** --- 5.2281 .50678 Sweden 4.6581 1.02309 Consumer orientation Italian 0.1829 (0.8556) 2.371 5.5263 .80058 Sweden 5.4821 .8941 Brand knowledge Italian 3.9053 (0.0003)*** 1.485 4.1316 .8436 Sweden 3.3803 .5997 Values Italian 2.5149 (0.0148)** 2.032 5.7263 .70304 Sweden 5.0821 1.0008 Differentiation Italian .06551 (0.5151) 2.016 5.9211 .97913 Sweden 5.7692 .7465 Organization Italian 1.7673 (0.0836)* 1.297 4.9737 .75413 Sweden 4.4936 1.0583 Strategy Italian 0.8834 (0.3808) 2.274 5.7368 .68655 Sweden 5.5231 .93765 Number of employees Italian 4.1562 (0.0001)*** --- 3.47 --- Sweden 2.46 --- Annual income Italian 0.6309 (0.5307) --- 3.47 --- Sweden 3.33 ---
12
Table 3: Structural model criterions
Q2 ƒ2 R2 q2 Redundancy Success .230 .866 .464 .299 .092 Consumer orientation .495 --- --- .980 --- Differentiation .236 --- --- .309 --- Knowledge .289 --- --- .407 --- Values .367 --- --- .580 --- Organization .323 --- --- .477 --- Strategy .425 --- --- .739 ---
Table 4: Inner path model coefficients and statistics
Note: ** p≤ .01; * p≤ .05
APPENDIX
Table 5: Item scales
Paths t statistics Standardized β coefficients p-value Standard deviation
Standard error
Consumer orientation -> Success 3.3092 .6020 .001** .1819 .1819
Differentiation -> Success 1.7684 .2344 .040* .1325 .1325
Knowledge -> Success 1.9560 .2474 .026* .1264 .1264
Organization -> Success 0.4729 .0747 .319 .1581 .1581
Strategy -> Success 3.3606 .4560 .001** .1356 .1356
13
Scale Scale items
Brand success (Relative to competitors…)
1. Our brand has achieved a premium price position on the market.
2. In relation to our competitors, our brand has contributed to a higher profit margin 3. Our brand performance results in satisfactory market share
4. Our brand has built higher brand loyalty than our competitors 5. Returns on investments are better for us than for our competitors 6. Our brand value is higher than our direct competitors
Consumer orientation (We serve consumers’ best interests by delivering a brand that…)
1. Is created according to highest technological standards in industry
2. Obtain best organoleptic characteristics of our product without any artificial ingredients
3. In our communication efforts with consumers (advertisement, internet, product package, etc.) we always deliver accurate and consumer-friendly information
4. Is beyond consumers expectations
5. Is seen by consumers as creative and value driven
Brand differentiation
(The most important variables for successful brand differentiation are…)
1. Consumer's perception of our brand 2. Unique product with strong brand personality
3. Consumer's experience of the brand (satisfaction/dissatisfaction, loyalty, etc.) 4. Communication with consumers (advertising, packaging, free phone line, web, etc.) 5. Close identification with famous person or public movement / event
Brand knowledge
(The most important knowledge can be obtained from: )
1. Consumers (market research, consumers’ feed-back, etc.) 2. Supply-chain (suppliers, partners, distribution channels) 3. In-house (knowledge and experience of employees) 4. Academia (university, journals, etc.)
5. Competition (analysis of competitors’ brand performances, benchmarking, etc.)
6. Consulting agency (consulting firm, standards and certification agencies, marketing agency)
New brand development --- EXC.
(Our company develop new brand because our goal is…)
1. To keep the current customers 2. To create new markets 3. To compete with competition
4. To expand our brand extension and brand visibility 5. It is expected by our stakeholders.
Values
(Most important values for company are: )
1. Environmental standards and regulations 2. Consumer’s long-term benefits 3. Growth of the company
4. Stakeholders satisfaction with company’s performance 5. Operational efficiency
Organization
(Brand influence and changes the organization…)
1. A new brand gives new sense for organization (new knowledge, new business practice, etc.) 2. A new brand requires new organizational form
3. A new brand requires new marketing solutions and investments (programmes in marketing mix, new event management, etc.)
4. With a new brand it is necessary for our firm to invest in the education of employees and consumers 5. It is best to fit a new brand within existing organizational forms and business strategies --- EXC.
Brand strategy
(The priorities in creating your competitive strategy are: )
1. Pricing compared to competition 2. Distribution channels
3. Consumer’s long-term benefits 4. Technical quality of the product 5. Operational efficiency Note: EXC – excluded during the composite reliability refinement