Tolerance to salinity in Jatropha curcas are genotype-dependent
A tolerância à salinidade em pinhão manso é dependente do genótipo
DOI:10.34117/bjdv5n10-347
Recebimento dos originais: 27/09/2019 Aceitação para publicação: 29/10/2019
Natália Corte-Real
Doutora em Botânica
Universidade Federal Rural de Pernambuco Centro de Biologia, Recife, PE, Brazil
E-mail: [email protected]
Pedro Vitor Vieira da Cunha de Miranda
Laboratório de Ecofisiologia Vegetal Universidade Federal de Pernambuco Departamento de Botânica, Recife, PE, Brazil
E-mail: [email protected]
Laurício Endres
Laboratório de Fisiologia Vegetal Universidade Federal de Alagoas Centro de Agronomia, Maceió, AL, Brazil
E-mail: [email protected]
Edivan Rodrigues de Souza
Laboratório de Física do Solo
Universidade Federal Rural de Pernambuco Departamento de Agronomia, Recife, PE, Brazil
E-mail: [email protected]
Marcelo Francisco Pompelli
Universidade Federal de Pernambuco
Departamento de Botânica, Recife, PE, Brazil, ZipCode 50670-901 Corresponding author
E-mail: [email protected]
ABSTRACT
Dissonant results in Jatropha curcas tolerance to salinity obtained by different research groups in several countries suggest that tolerance is connected to variation of the genetic origin of the genotypes used. To verify this hypothesis, this work compared the physiological, photochemical and nutritional responses of different genotypes from J. curcas under to saline stress. Seeds of six genotypes of
J. curcas (CNPAE112, CNPAE114, JCAL171, CNPAE183, CNPAE218, and CNPAE304) were
germinated and fertirigated for three months with a Hoagland nutrient solution at 50%. After that, the plants received different concentrations of NaCl (0, 250, 500 and 750 mM) added to the nutritious solution for 48 h (maximum stress). Later, the salt was washed out from the substrate with salt-free solutions. Afterwards, the plants were cultivated for more 914 h to plant recovery. Gas exchanges,
fluorescence chlorophyll a, osmotic potential and concentration of macro- and micronutrients of leaves were quantified. Physiological analyzes showed that genotypes CNPAE112, CNPAE114, and JCAL171 were more tolerant to salt stress due to complete recovery of their gas exchange rates after transferring plants to salt-free media. The genotypes CNPAE218 and CNPAE304 were more sensitive to saline stress, showing no recovery of the gas exchange and no recovering of maximum
quantum efficiency of PSII, besides having high concentrations of Na+ in leaf after transferring plants to salt-free media. The genotype CNPAE183 was shown to be intermediate to the two previously situations. Therefore, we can suggest that CNPAE112, CNPAE114, and JCAL171 presented higher tolerance to saline stress, while CNPAE218, CNPAE304 showed to be more sensitive.
Keywords: NaCl, Physic nut, Abiotic Stress, Gas Exchange, Biofuel, Principal Component Analysis RESUMO
Resultados não conclusivos na tolerância à salinidade do pinhão manso foram recentemente obtidos por diferentes grupos de pesquisa em vários países, o que sugere que a tolerância à salinidade está ligada à variação da origem genética dos genótipos utilizados. Para verificar esta hipótese, este trabalho comparou as respostas fisiológicas, fotoquímicas e nutricionais de diferentes genótipos de
J. curcas sob estresse salino. Sementes de seis genótipos de J. curcas (CNPAE112, CNPAE114,
JCAL171, CNPAE183, CNPAE218 e CNPAE304) foram germinadas e fertirigidas por três meses com uma solução nutritiva de Hoagland a 50%. Depois disso, as plantas receberam diferentes concentrações de NaCl (0, 250, 500 e 750 mM) adicionadas à solução nutritiva por 48 h (estresse máximo). Posteriormente, o sal foi lavado do substrato com soluções livres de NaCl e as plantas foram cultivadas por mais 914 h para recuperação do estresse. Foram quantificadas as trocas gasosas, a fluorescência da clorofila a, o potencial osmótico e a concentração de macro e micronutrientes das folhas. Análises fisiológicas mostraram que os genótipos CNPAE112, CNPAE114 e JCAL171 se mostraram mais tolerantes ao estresse salino devido à recuperação completa de suas trogas gasosas após a transferência de plantas para meios sem sal. Por outro lado, os genótipos CNPAE218 e CNPAE304 foram os mais sensíveis ao estresse salino,os quais não mostraram recuperação das trocas gasosas e recuperação da máxima eficiência quântica de PSII, além de apresentarem altas
concentrações de Na+ nas folhas após a transferência das plantas para meios sem sal. O genótipo
CNPAE183 mostrou ser intermediário para as duas situações anteriores. Portanto, podemos sugerir que CNPAE112, CNPAE114 e JCAL171 apresentaram maior tolerância ao estresse salino, enquanto CNPAE218, CNPAE304 mostraram-se mais sensíveis.
Palavras-chave: NaCl, pinhão-manso, estresse abiótico, trocas gasosas, biocombustível, análise de
componentes principais
1 INTRODUCTION
Most of the soils around the world are affected by the presence of salts that can promote salt stress on plants and limit production (Rahdari and Hoseini 2011). Binzel and Reuveni (1994) revealed that the salt-affected area is almost three times larger than the arable agricultural land. Salinity is one of the most severe abiotic stresses faced by plants, because, besides reducing the osmotic potential of the soil, the salinity stress is also closely connected to the osmotic stress and the boosting of the hiperionic condition on plants (Munns 2011). High salinity level causes ionic imbalance, disturbs the
ion homeostasis of plant cells, and affects the distributions and supply of essential mineral nutrients, such as K+, Ca2+, and Mn2+ and thus affecting the normal physiology of plant cells (Wang et al. 2012).
The impact of salinity stress can affect, directly or indirectly, energetic ways, like photosynthesis, above all due to the cytotoxic effect from the backlog of ions; reduction of the disponibility and diffusion of CO2 induced by stomatic and mesophyll limitation; the changes on the photosynthetic apparatus, chlorophyll breakdown, damage to chloroplast; decrease of quantic efficiency of the photosystem (PS) II; and increase dissipation of energy on the form of fluorescence and heat, as previously reported by Tominaga et al. (2014) in land cultivation of J. curcas under drought stress. All these changes lead to biochemical disturbance, compromising the growth and vegetal development (Wang et al. 2012). At long term can affect the species productivity.
The response of plants to the salinity stress depends on a number of factors, like the concentration of salt in the soil, the time of exposure to the stressful condition, the age of the plant, the studied species and even the genotype or the variety (Silva et al. 2015; Trebbi et al. 2015; Laviola
et al. 2018), in a way that plants can be classified in more tolerant and more sensitive to salinity.
The physic nut (Jatropha curcas L.) is a woody-shrub species belonging to the Euphorbiaceae family. The geographic center of origin of J. curcas remains controversial but is believed to be native to Central America or Mexico, where it occurs naturally in forests in coastal regions (Pecina-Quintero
et al. 2014; Guo et al. 2016). Due to its performance superiority and environmental concerns, J. curcas is widely distributed in tropical and subtropical areas, especially in Central and South
America, Africa, India and South East Asia (Schmook and Seralta-Peraza 1997). In recent years, this species has been researched for the exploitation of commercial biodiesel production (Alburquerque
et al. 2017; Silitonga et al. 2017). This species has a short period of growth until the first fruit harvest
(Corte-Real et al. 2016), and low seed cost (Silitonga et al. 2017). A single Jatropha plant (non-improved genetic material) can yield more than 2.5 kg of seeds with high oil content (40-80%) (Pompelli et al. 2010b; Pandey et al. 2012; Singh et al. 2013). Its major fatty acids are oleic acid (34.3-45.8%; 18:1), linoleic acid (29.0-44.2%; 18:2), palmitic acid (14.1-15.3%; 16:0) and stearic acid (3.7-9.8%; 18:0) (Gubitz et al. 1999; Andrade et al. 2017). For instance, if 1,250 plants can be grown in one hectare (spaced 4×2 m apart), Jatropha can produce from 937 to 1,250 kg of oil per hectare. To put in perspective, soybean, the most planted oilseed crop in Brazil, produces on average 500 kg of oil per hectare. Added to this, Jatropha is a perennial crop, which means that it can be commercially explored for a long period (Laviola et al. 2018). Moreover, this species, shows good adaptation to different agroclimatic conditions (Divakara et al. 2010; Pompelli et al. 2010a; Santos
et al. 2013), surviving on infertile soils (Sarin et al. 2007), making this species suitable for cultivation
with food production or environmental conservation (Tominaga et al. 2014). The physiological characteristics of the species, associated with its economic potential, can transform J. curcas as an efficient substitute to be used as fuel for diesel, its utilization as a new source of oil has tremendous scope in contributing to growing needs of the country for energy resources (Pompelli et al. 2011; Pandey et al. 2012; Baroutian et al. 2013).
Characteristics of economic potential, robustness, easy propagation, resistance to drought and saline condition (Mastan et al. 2012), high oil content, low seed cost, fast growth and easy propagation, and easy adaptation to a wide range of agroclimatic conditions (Gubitz et al. 1999; Divakara et al. 2010; Pompelli et al. 2010a; Mastan et al. 2012; Contran et al. 2013; Moncaleano-Escandon et al. 2013; Andrade et al. 2017) lead this species in a potential model to future studies in salinity tolerance. Thus, several works are being developed in recent years, searching to understand and explore the different mechanisms of response from the J. curcas opposing various environmental conditions (Pandey et al. 2012; Contran et al. 2013; Shrivastava and Kumar 2015). However, there is not a consensus yet about tolerance to salinity of this species. One of the reasons for this divergence can be related to the diversity in physiological response among genotypes in different studies (Mastan
et al. 2012). On this meaning, the main hypothesis that this study intends to select genotypes that
present physiological characteristics of salt tolerance that in a way can help on the selection of elite genotypes. Our studies had the goal to select J. curcas genotypes more tolerant to the saline environment through assessing its physiological responses to salt stress.
2 MATERIAL AND METHODS
2.1. PLANT MATERIAL AND GROWTH CONDITIONS
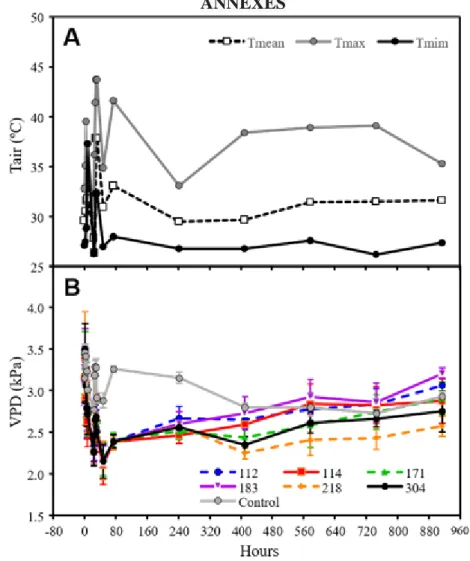
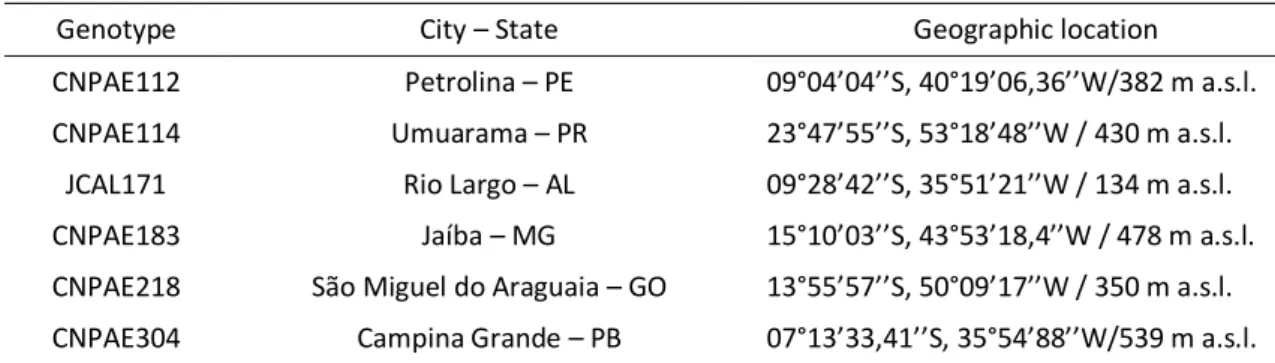
For this experiment, the seeds of six J. curcas genotypes (Table 1) distributed throughout the different regions of Brazil, given by Brazilian Agricultural Research Corporation (Embrapa Agroenergy; Brasília, DF – Brazil), were kept at 4°C until their use (Moncaleano-Escandon et al. 2013). Germination was carried out in a greenhouse (8°02"59.0' S; 34°56"54.9' W). The seeds were germinated in polypropylene boxes (200 x 200 x 50 mm) containing 5 kg of river washed sand, air-dried, where 20 seeds were soaked in each experimental boxes. Along with the experiments, the temperature was recorded during the experiments using a portable mini climate station (mod. KR420, Akron Measure Instrument, Leuven, Belgium) every fifteen minutes, 24 h per day. The mean temperature and relative humidity along the germination were, respectively,28.7 ± 3.8°C and 73.2 ± 14.2% (Fig. 1).
With the emergence of the first eophylls, the seedlings were standardized and individualized in plastic pots (9 L), filled with 9 kg of washed sand, where the seedlings remained for at least 15 days, being fertiirrigated every two days with nutrient solution of Hoagland (Epstein 1972) at 50%
(pH 5.8). Subsequently, the nutrient solution was replaced by the Hoagland full strength. After 3 months of seedling nursing, an experiment was carried out with a 6 x 4 factorial arrangement and 4 repetitions. The factors used were six genotypes (CNPAE112; CNPAE114; JCAL171; CNPAE183, CNPAE214 and CNPAE304), and four saline concentrations (0, 250, 500 and 750 mM L-1 of NaCl). The saline treatments were added to the Hoagland nutrient solution, corresponding to 1.4; 23.1; 36.3 and 46.8 dS m-1 of electrical conductivity of a nutrient solution, respectively.
After 3 months to acclimation, all plant was irrigated daily, according to the treatment, with 800 mL of saline solution (enough volume to occur leaching), in the early hours of the morning (06:00-07:00 h). The plant was considered stressed when the net photosynthesis (PN) of the leaves were lower than 10% of those measured in control plants leaves, which occurred after 48 h salt stress. Hereafter referred to as maximum stress. After 48 h of salt stress, the saline condition was removed from the system with continuous washes with deionized water until a decrease in the electrical conductivity of the leachate was lower than 3 dS m-1. After that, the plants were fertirigated with full strength Hoagland nutrient solution salt-free for recovering from salt stress. Plants were considered recovered when PN of the stressed plants was similar (p ≥ 0.05) to those measured in control plants.
2.2.GAS EXCHANGE MEASUREMENTS
In two first days, leaf gas exchange was measured at different times (07:00, 09:00, 11:00, 13:00, 15:00 h, solar time). Net photosynthesis (PN), stomatal conductance (gs), internal-to-ambient CO2 concentration (Ci/Ca) and the leaf-to-air vapor pressure deficit (VPD) were quantified. After salt stress alleviation, all the photosynthetic parameters were measured one time per week, always in about 09:00 h. Gas exchange was measured using a portable system (Li-6400; Li-Cor, Lincoln, NE, USA). For this measurement, we selected two healthy leaves per plant. Measurements were conducted in a greenhouse under a clear sky and the leaf was exposed to the irradiance of saturation of 1,000 mol m-2 s-1 (as previously tested by light curves versus net photosynthesis), fixed CO2 concentration in 390 mol mol-1 and air flow of 400 mol s-1.
2.3. PHOTOCHEMICAL EFFICIENCY
In the same moments of gas exchange measurements, the chlorophyll a fluorescence parameters were measured after 30 min with dark-adapted leaves and 1,000 mol m-2 s-1 of actinic light (Genty et al. 1989; Maxwell and Johnson 2000).The maximum Chl fluorescence of photosystem II (Fv/Fm), ratio between variable fluorescence to initial fluorescence (Fv/F0), photochemical (qP), and non-photochemical quenching (NPq), and quantum efficiency of photochemistry (PSII) were
measured using a portable fluorometer (FluorPen, mod FP100, Photon Systems Instruments, Drasov, Czech Republic).
2.4. PREDAWN LEAF OSMOTIC POTENTIAL (S)
To measure the leaf osmotic potential (s), whole, and healthy leaves were collected from the middle third of the aerial part of the plant, between 04:00 and 04:30 h (in the predawn), at two moments during the experiment: (i) in maximum stress and (ii) in plant recovery. The leaves were identified and promptly placed under refrigeration (4ºC) for a maximum of 24 hours when the tissues were macerated and centrifugated at 15,000 g for 10 minutes at 4°C. A 10 L aliquot of extracts were used to determine its osmolality through a vapor pressure osmometer (Vapro, mod 5600, Wescor, Inc., Logan, UT, USA). Using the equations proposed by Van’t Hoff (Prickett et al. 2008), the osmolality was converted to osmotic potential, given in MPa.
2.5. LEAF MINERAL ELEMENTS
Concentrations of macro- and micronutrients in leaves were measured in leaf samples collected from the middle third of the aerial part of the plant, in both maximum stress and after recovery. Leaf dry mass was obtained after oven-drying at 60°C for 72 h. Leaves were then ground into a fine powder to pass a 40- mesh sieve, and determined nutrients contents, such as, nitrogen (N), phosphorus (P), potassium (K+), magnesium (Mg2+), calcium (Ca2+), sodium (Na+), and chloride (Cl-) in accord of Silva (2009).
2.6. PRINCIPAL COMPONENT ANALYSIS AND HIERARCHICAL CLUSTERING
Physiological and morphological parameters were used to construct a principal component analysis with the PCA function of the Minitab 18.1.0.0 (Minitab LLC, State College, PA, USA). The summary function of PCA was used to calculate the proportion of the variance of each physiological and nutritional parameter explained by each principal component. For hierarchical clustering, the Euclidean distance was used with the R index in the Minitab 18.1.0.0 (Minitab LLC, Pennsylvania State University, PA, USA).
2.7. STATISTICAL ANALYSIS
The results obtained were submitted to a variance analysis (ANOVA) and the averages were compared by the test Student-Newman-Keuls to 5% level of significance, or a test T to a comparison between to saline concentration (0 mM and 750 mM of NaCl), trough the Sigmaplot 11.0.0.77 (Systat Software Inc. San Jose, CA, USA).
3 RESULTS
In general, the plants submitted to 250 and 500 mM of NaCl concentrations did not present visual symptoms of toxicity caused by salinity stress. On the other hand, plants submitted to a 750 mM, presented symptoms of salinity stress, characterized by chlorosis on older leaves, followed by leaf abscission just after the maximum stress. After the fall of old leaves, most of the genotypes, presented leaf regrowth, with exception of plants from the genotype CNPAE218 and CNPAE304, which had reduced leaf production on the period of recovery, even presenting necrosis of stalk tissues (Supplementary Figure S1).
All the genotypes studied presented the same behavior, in reference to the net photosynthesis, when subjected to 250 mM and 500 mM de NaCl, showing the interaction between studied genotypes and salt concentration (Table 2). In this way, wanting to comprehend the different behaviors between the genotypes of J. curcas only the data of 750 mM of NaCl were considered, to make a parallel between this concentration and control treatment, exempt from NaCl (Fig. 2).
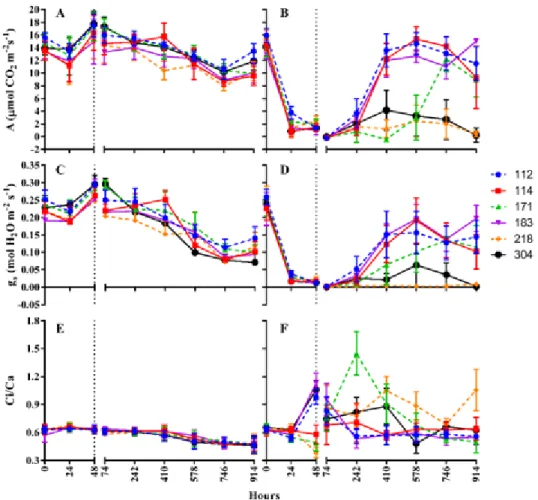
In all studied genotypes, the gas exchanges parameters were reduced with salt incorporation on the substrate (Fig. 2B), followed by the fall of gs (Fig. 2D) when compared with plants of control (Fig. 2A and 2C). These alterations occurred since the first hours of inclusion of salt to the substrate, reaching the maximum stress in 48 h from the beginning of the differentiation of treatment. The Ci/Ca ratio presented distinct intraspecific behavior. On maximum stress, the genotype CNPAE112, CNPPAE183 and CNPAE304 presented meaningful elevation Ci/Ca ratio with values from 1.20 ± 0.33, 1.13 ± 0.34 e 1.06 ± 0.55, respectively (Fig. 2F). A different profile was observed in genotypes CNPAE114, JCAL171, and CNPAE218 which maintained the values of Ci/Ca similar to the registered before the maximum stress.
On the recovery period, plants from the genotype CNPAE112, CNPAE114, and CNPAE183 subjected to salinity reached photosynthetic rates close to values registered in control treatment after 410 h of experiment (Fig. 2B), followed by an increase of gs (Fig. 2D). The genotype JCAL171 presented a slower recovery, reaching values similar to control only after 746 h. On the other hand, the genotypes CNPAE304 and CNPAE218 don’t show recovery of their photosynthetic rates as well as their gs, even after 914 hours of removal of salt in the substrate.
On all treatments, the gs sharply increased towards its maximum at a VPD. For CNPAE112, CNPAE183, CNPAE304, CNPAE114, JCAL171 and CNPAE218 and the correlation coefficient was 0.457 (p = 0.008), 0.456 (p = 0.009), 0.421 (p = 0.016), 0.390 (p = 0.027), 0.384 (p = 0.033) and 0.369 (p = 0.038), respectively. However, when all data were pooled, the correlation coefficient was strongly increased to 0.659 (p ≤ 0.0001), evidencing a strong influence of the VPD on gas exchange (Fig. 3).
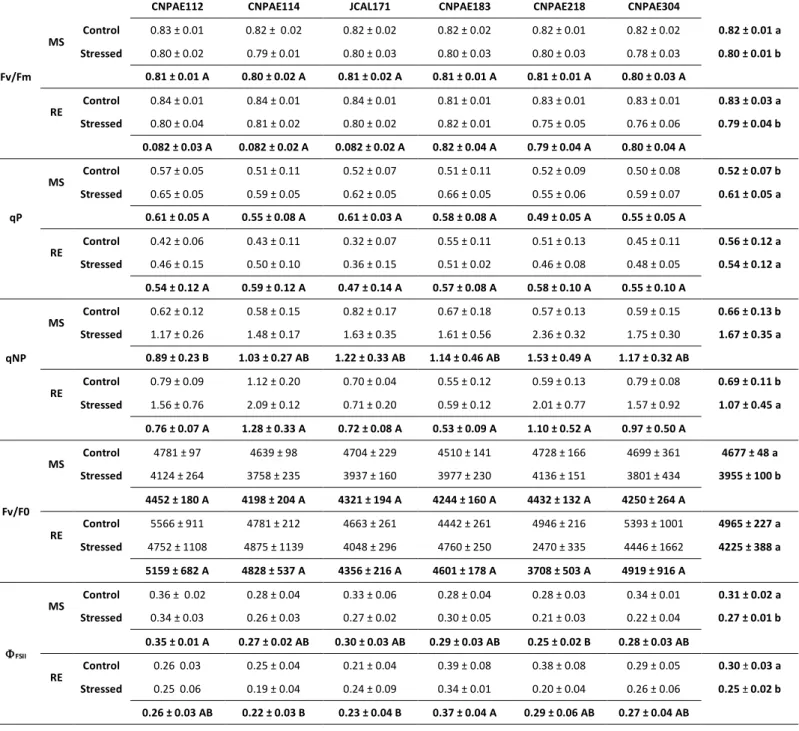
All fluorescence parameters also were affected by the presence of salt (Table 3). In this sense, Fv/Fm and Fv/F0 were not significantly different between genotypes, although plants subjected to salinity showed a decrease of 2.4% and 15.4% to every variable respectively. On the recovery, the plants subjected to salinity showed a small improvement in both parameters, even remaining with ratios relatively lower, when compared to control plants (Table 3). This lower efficiency of conversion photochemistry (PSII) energy was reduced in ~15% by stress (Table 3). The large fraction of the absorbed energy was utilized via regulated thermal dissipation when the PSII was extremely low (Table 3). The mean maximum qNP achieved in the salt-stressed plants ranged to 1.17 and 2.36, respectively in CNPAE112 and CNPAE218. In this sense, de qNP in stressed plants were 1.9x, 2.0x, 2.4x, 2.7x, 3.0x, and 4.1x higher in CNPAE112, JCAL171, CNPAE183, CNPAE304, and CNPAE218, than the respective control (Table 3). On the recovery the difference observed on qNP of the stressed and control plants were abruptly decreased in CNPAE114, JCAL171, and CNPAE183, but maintained high in CNPAE112 (2x higher), CNPAE218 (3.4x higher), and CNPAE304 (2.0x higher). This decrease shows that the plants had conditions to recovery, but this recovery was not complete in CNPAE112, CNPAE218, and CNPAE304 genotypes.
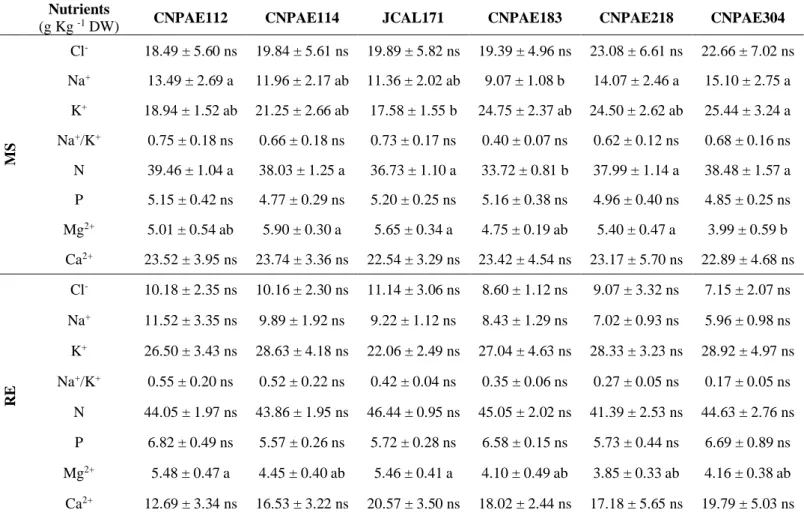
In maximum stress, the genotypes presented the meaningful difference between each other only in the nutritional parameters, in regard to the content of K+, N, and Mg2+, beside the Na+ (Table 4). This way, it was possible to observe that the genotypes CNPAE304 and CNPAE183 were the most divergent because there is a greater accumulation of Na+ (66.5%) on the genotype CNPAE304 in relation to CNPAE183. This low concentration of Na+ in CNPAE183 contributed to this genotype presenting the lowest value of the ratio Na+/K+ (0.40), even though it is not significantly different from other genotypes. It is worth noting that to highlight that in the moment of recovery, the level of all the nutrients was different of the ones obtained in the maximum stress, once that, regardless of the genotype evaluated, the levels of K+, N and P were significantly increased in the recovery compared to plants under salinity. Other minerals, like Cl-, Na+ and Ca2+ were decreased in recovery, while Mg2+ maintained itself stable (Table 4). Comparing stressed plants, regardless of genotype, the levels of Cl-, Na+ e Ca2+ were respectively increased in 507.6%, 95.1% and 40% in stressed plants compared to the control ones. On the other hand, the levels of K+ and N were respectively reduced in 15.6% and 6.2% in stressed plants compared to control (Table 4).
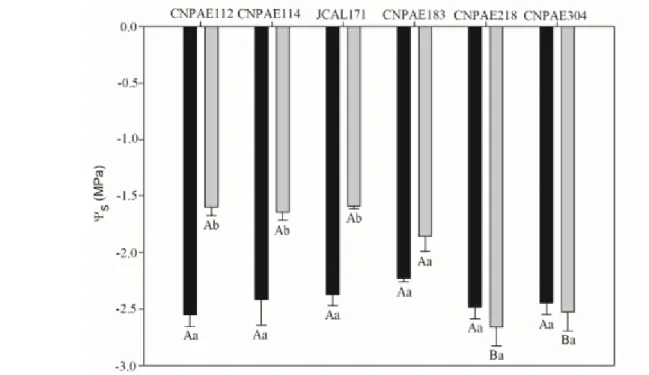
Among all analyzed parameters, the s was one of the most affected by stress. In maximum stress, all genotypes showed similar s, while in the recovery CNPAE218 and CNPAE304 differed between other genotypes because their s were maintained lower, with values similar to those measured in the maximum stress. In distinct form, genotypes CNPAE112, CNPAE114, CNPAE183,
and JCAL171 showed s 37.2%, 32.0%, 32.9%, and 16.6% higher in recovery plants when compared to those values measured in maximum stress (Fig. 4).
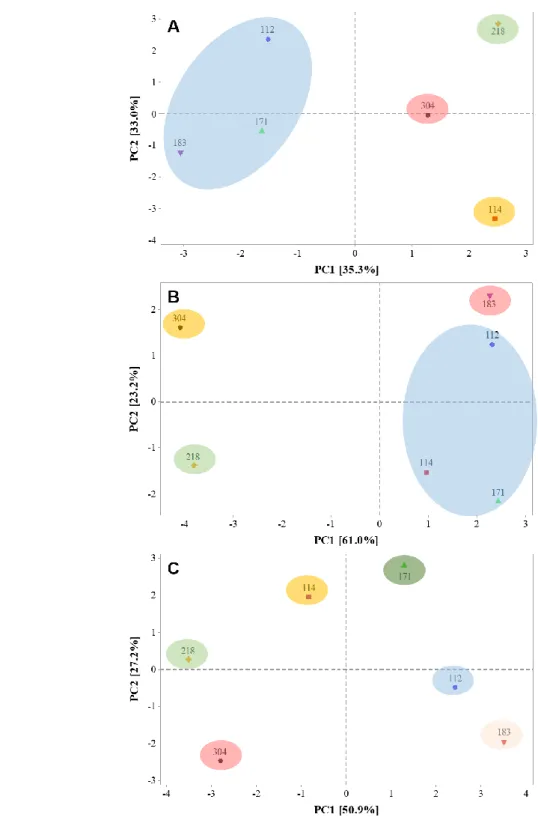
All parameters shown so far appear to separate more tolerant genotypes from more sensitive genotypes. To confirm this separation, a PCA was performed for two sampled times, i.e., 48 hours or stress (maximum stress) and 914 hours of stress (recovery) (Fig. 5, and Supplementary Fig. 2). The PCA results revealed a clear influence among times of stress on the modulation of some parameters. However, in maximum stress (Fig. 5A), the genotypes CNPAE112, JCAL171 and CNPAE183 form a unique cluster, while in recovery (Fig. 5B), the genotypes CNPAE114, JCAL171 and CNPAE112 form a unique cluster, showing that the pattern visualized in all data (Fig. 5C) was merged and cannot be distinguished from each other. In addition, in maximum stress, the physiological and nutrition status were important variables to determine de separation in the first component (Supplementary Fig. S2). The main variables were Cl-, Na+, WUEi and PN (0.286, 0.274, 0.270 and 0.246, respectively) (Supplementary Table S2). Noteworthy, the WUEi, Fv:Fm, T, s, PN, Fv:F0, Ci:Ca and gs has also great influence in the separation the treatments when compared only recovery plants (0.307, 0.305, 0.299, 0.295, 0.290, 0.285, 0.273, and 0.268, respectively) (Supplementary Table S3). In contrast, when all data were pooled there was no formation of groups, and each genotype behaved differently from one another. In all case, the Euclidean method showed a similarity of 70% (Fig. 2).
4 DISCUSSION
The parameters of gas exchange in the genotypes of J.curcas were reduced by the addition of NaCl in the nutritious solution since the first hours of treatment. The plants subject to 750 mM of NaCl presented a progressive decrease in the parameters of gs and PN until the moment of maximum stress. This decline in gas exchange is related to the immediate response to from plants subjected to osmotic deficit imposed by the high saline concentration, once that the presence of salt in a solution of the soil decreases the osmotic potential of the soil (Parihar et al. 2015). The stomatic closure, is a strategy that allows cutting the excessive loss of water through transpiration, favors the maintenance of the hydric status of the plant (Flexas and Medrano 2002), beside reducing the flow of ions from the substrate to the aerial part (Praxedes et al. 2010), preventing the damage related to cytotoxic effect caused by excessive accumulation, mainly, of Na+ and Cl- (Gupta and Huang 2014). On the other hand, the stomatic closure reduces the flux of CO2 to the inside of the substomatal chamber, resulting in the decrease of photosynthetic rate, observed since the first hours of salinity treatment, the decrease of availability and fixation of CO2 compromises the second stage of photosynthesis and the supply of ADP and NADP+, used in the photochemical step. This way, when occurs, the decrease on the contribution of CO2 without the decrease in availability in luminous energy a growth on the
susceptibility of photochemical damage is noticed, inducing strong disturbances in the photochemical reaction (Krause and Weis 1991; Maxwell and Johnson 2000) and generating reactive oxygen species (ROS) due to a smaller availability of NADP+ as a final receptor of electrons (Pompelli et al. 2010a; Campos et al. 2012; Dusenge et al. 2015).
In reason of osmotic deficit, imposed by the presence of salt in the substrate, the plants of
J. curcas reduced their osmotic potential, in favor of water absorption, a fact previously reported by
several studies on this species (Silva et al. 2009; Silva et al. 2010; Díaz-López et al. 2012a), which corroborates the data presented on our study. With the removal of the saline condition of the substrate, the s did not differ between the treatments only in CNPAE183, CNPAE218, and CNPAE304. The decrease of s for woody species is recognized as a mechanism to support the effects of salinity stress and dimmer the hydric deficit. This osmotic adjustment favors the catchment of water by roots and can be assigned to synthesis or translocation of substance or ions which can act as osmoregulators and osmoprotectants, including cations and anions, present on the saline solution like Na+ and Cl- or found on the leaves (Silva et al. 2010; Campos et al. 2012). These findings do not confirm studies of Tominaga et al. (2014) who described that J. curcas responds to decrease gs under progressive drought while maintaining the leaf water content predawn leaf water potential, and the difference in leaf water potentials between predawn and midday as low as well-watered plants, indicating that it has a desiccation postponement strategy. Adverse effects on physiology and metabolism of the plants, due to exposure to NaCl, are caused, mainly, by the cytotoxic effect of ions Na+ and Cl- in high concentrations and changes in the nutritional balance (Díaz-López et al. 2012b). Confirming the studies already described in the literature, with the addition of NaCl on the substrate, the plants subjected to 750 mM de NaCl absorbed high quantities of ions of the solution on the soil, mainly of Cl-, which possibly caused the symptoms of visual toxicity characterized by chlorosis in older leaves, followed by abscission. The high concentrations of ions Cl- on leaves may cause degradation of chlorophyll, causing damage on the photosystems (Asada 1999; Pompelli et al. 2010c; Tavakkoli et
al. 2011), favoring the fall of photosynthesis rate and damage to the photosynthetic apparatus of some
genotypes studied. Díaz-López et al. (2012a) suggests that J. curcas seedlings exhibit a moderate tolerance to salinity, as the plants were able to tolerate up to 4 dS m-1, equivalent to 30 mM NaCl, while Fu et al. (2019) described that a transgenic J. curcas expressing sbNHX1 gene, which encodes an active vacuolar Na+/H+ antiporter could enhance tolerance up to 200 mM NaCl. Our study contradicts these studies since in this study, we tested 25x greater than salt concentration tested by Díaz-López et al. (2012a) or 4 times greater than salt concentration described by Fu et al. (2019). The complete recovery of gas exchange in JCAL171, CNPAE114, and CNPAE112 genotypes confirm our hypothesis that J. curcas is strongly tolerant to salinity, considered by some authors
(Díaz-López et al. 2012a; Fu et al. 2019) like a halophyte plant. The accumulation of Na+ in the leaves in the genotypes on maximum stress revealed to be an important indicator of behavior from different genotypes compared to saline stress. This way, the genotype CNPAE183 presented higher success in ionic selectivity, avoiding the build-up of Na+ on the leaves, which is important for protecting the enzymatic metabolism (Hussain et al. 2016). This behavior was observed by J. curcas and proven by analysis between the relation of those cations, which revealed an increase in the ratio Na+/K+ in plants subjected to salinity, evidencing a higher absorption and translocation of sodium to the leaves, in detriment of potassium (Garcia et al. 2007). In this sense, a smaller Na+/K+ is considered as a brand of tolerance for plants subjected to salinity, a fact proven in many studies, including J. curcas (Greenway and Munns 1980; Hauser and Horie 2010; Roy et al. 2014; Silva et al. 2015; Melo et al. 2017). According to Greenway and Munns (1980), glycophytes plants must present a Na+/K+ ratio equal or smaller than 0.6, are more metabolic efficient, it is suggested that the genotype CNPAE183 presents a higher selective ionic capacity, favoring the metabolic balance, when compared to the other genotypes tested in this study. After 914 hours, all genotypes decreased the values of Na+/K+ ratio, reaching averages that allow the proper maintenance of the metabolism. This cutback can be explained by the increase of K+ concentration, absorbed through this period, and by the decrease of Na+ concentration, eliminated by the fall of old leaves or in the function of the dilution effect as mentioned by Rosolem et al. (2004), once that the plant continues to present growth. Even though in recovery the plants subjected to salinity meaningfully reduced their levels of Cl- and Na+, the values presented are still high, circumstantial evidence that the fall of old leaves is not enough to remove the excess of those ions in plants after stress, even after the 35 days in recovery. It’s necessary to emphasize that the genotype CNPAE183 showed the lowest fall in the levels of Cl- and Na+ compared to the others, probably because of the fact that this genotype already showed lower values of those ions in maximum stress.
After maximum stress, the genotypes presented different behaviors about the photosynthetic rates. This difference showed trough different speeds of recovery that may show an intraspecific variation and strong evidence to the selection of more tolerant genotype (Bastos et al. 2011). Some works (Hussain et al. 2017; Yu et al. 2017) showed that genotypes more sensible tends to present a slower recovery of the physiological process when compared to more tolerant genotypes. In this sense, it is postulated that the complete recovery of photosynthetic rates, after stress, may be a strong indicator that the salinity did not no meaningful harm to the photochemical apparatus (Flexas and Medrano 2002; Sales et al. 2013) or that the regulatory mechanisms of protection were more active. From this assumption, it is believed that the genotypes CNPAE183, CNPAE112, CNPAE114, and JCAL171, were more efficient, presenting high tolerance to salinity stress than the genotypes
CNPAE218 and CNPAE304. This distinction between the genotypes evaluated it is due to the fact that these last ones did not recover their photosynthetic rates even after the withdrawal from the stressful condition, compromising the growth and production of biomass, evidenced by the suppression of new leaves and necrosis of the stalk (Supplementary Fig. S1). Such observations indicate a strong influence of specific genetic variants on the expression of the phenotype more tolerant or sensible to salinity in this species, on the interactions with abiotic factors. Moreover, the behavior of genetic diversity between Brazilian and Americas genotypes with greater similarities between then (Montes et al. 2013; Osorio et al. 2014; Laviola et al. 2018; Sánchez-Velázquez et al. 2018) could be influenced to nonseparating genotypes CNPAE183, JCAL171, and CNPAE112.
Environmental factors, like high values of VPD, may lead to photochemical damage on leaves (Ranjan et al. 2012; Tominaga et al. 2014; Hsie et al. 2015; Mendes et al. 2017). In this study, we demonstrated that the gs responded linearly to the VPD regardless of the treatment. In accord of Tominaga et al. (2014), diurnally, the VPD outside the chamber (measured for reference) fluctuated similarly to the one inside the chamber, suggesting that theVPD inside the chamber was not elucidated by the transpiration via stomatal behavior. Results of the water treatment showed that J. curcas has a high capacity for regulated thermal energy dissipation that flexibly adjusts PSII quantum efficiency to the capacity of CO2 fixation and must be critically important for this strict water (Tominaga et al. 2014). Starting from this, we can postulate that the non-recovery of the genotypes CNPAE218 and CNPAE304 could not be connected with their heat dissipation, because this genotype shows the higher values of qNP. However, the PSII of this genotype were lesser than other evaluated genotypes. Some authors (Tominaga et al. 2014; Hsie et al. 2015) demonstrated that the stomata of J. curcas did not close completely even in hight VPD allowing the diffusion of CO2 to the substomatal chamber. This idea was confirmed when we consider that the Ci:Ca ratio rarely decreased 0.5, strong evidence that it was not the stomatic closure was not the main reason for the decrease in photosynthetic rates. Other factors may have lead to the decline of photosynthetic rates; between those are: (i) damage in the photosynthetic apparatus and to the Calvin cycle (Egneus et al. 1975; Farquhar et al. 1980; Cen and Sage 2005; Araújo et al. 2008; Kalaji et al. 2014), (ii) decrease in mesophilic conductance (Keenan et al. 2010; Griffiths and Brent 2013) and (iii) decrease on the rate of electron transport between the photosystems (Kanechi et al. 1996; Flexas et al. 1999), factors that can decrease or slow down the speed in which the internal carbon is used. Besides that, in stress conditions, the internal concentration of carbon (Ci) grows, due to the routing of CO2 coming from cellular respiration to the substomatal chamber (Zlatev and Yordanov 2004). Problems on the photosynthetic machinery (Silva
of internal CO2, may have added to increase in Ci/Ca ratio (Tooulakou et al. 2016) and, in some genotypes, increase the speed of the recovery of photosynthetic rates.
The parameters of fluorescence of the chlorophyll a is changed in answer to abiotic stress, like salinity (Baker 2008), and showed to be an important variable in setting tolerance of genotypes (Netondo et al. 2004; Bacarin et al. 2011), because the changes in stability in those parameters have been treated as one of the primary effects of salinity in photosynthetic rates. All data about fluorescence parameters of chlorophyll a measured in this study showed a tendency to decrease in efficiency of the photosystem II in all genotypes, in maximum stress. This decrease is chiefly denoted in recuperation, where the genotypes CNPAE218 and CNPAE304 shows high non-photochemical quenching and lowest means in PSII efficiency. These parameters allied with visual symptoms permit us to infer that these genotypes were sensitive to salt stress, while JCAL171, CNPAE114, CNPAE112 were tolerant to salinity and CNPAE being considered moderately tolerant to salinity. The decrease in Fv:Fm ratio throughout the application of NaCl in the genotypes CNPAE218 and CNPAE304 to 0.75 and 0.76, respectively, linked with the increase of Ci:Ca ratio are circumstantial evidence that support the hypothesis that the non-stomatic factors are responsible for cutback of photosynthesis after the stress phase (Medrano et al. 2002) in those genotypes. This behavior, allied to the decrease in gas exchange parameters such as gs and PN, as well as the increase of internal carbon concentration, reinforces the idea that alternative ways of energy, main photorespiration can be used by the genotypes CNPAE218 and CNPAE304. Some studies (Zheng et al. 2009; Díaz-López et al. 2012a; Verma et al. 2013; Ploschuk et al. 2014) combining electron transport rate and CO2 assimilation rate indicated that the antioxidant activity and cyclic electron flow around PSI in water-stressed Jatropha leaves can be a sink of electrons, thus reducing the stress on photosystems.
Based on physiological, photoprotectors and nutritional data, we could conclude that the genotypes CNPAE112, CNPAE114, and CNPAE183 presented themselves as like candidates more tolerant to salinity, showing speedy recovery of photosynthetic rates and growth when NaCl is taken from the system. On the other hand, the concentration of 750 mM of NaCl showed to be highly harmful to genotypes CNPAE218 and CNPAE304, therefore, this genotypes showed to be more sensitive than the others, or yet, do not seem to have a molecular mechanism of genetic and metabolic regulation that make viable physiological recovery after the maximum stress caused by salinity. The genotype JCAL171 was tolerant, showing a slow recovery capacity after being subjected to severe salinity conditions, unlike other genotypes, probably due to the different tolerance strategy (likely presence of intermediary mechanisms of metabolic and genetic regulation, promoter of salinity tolerance). So, different genotypes of J. curcas presented diversified answers when subjected to saline
stress. Studies like this, allied to identifications of regulatory genic ways may help to understand the different regulatory ways between these genotypes under salinity stress.
ACKNOWLEDGMENT
The author's thanks to the National Council for Scientific and Technological Development (CNPq Grants 404357/2013-0). Natália Corte-Real and Pedro V.V.C. Miranda thanks the Foundation for Science and Technology of Pernambuco, FACEPE (Grants IBPG-0709-2.07/13, and BIC-0080-2.03/15) and Marcelo F. Pompelli thanks to the National Council for Scientific and Technological Development (CNPq Grants 163524/2017-3) to scholarship. The authors would also like to thank Dr. Agnaldo Rodrigues de Melo Chaves, Brazilian Agricultural Research Corporation, Embrapa, Semiárido, Petrolina, PE, Brazil, and the Embrapa Agroenergy, Brasília, DF, Brazil by the supply of seeds used on this work.
Conflicts of Interest
All authors contributed substantially and approved the final submission.
All authors declare that they have no conflict of interest.
REFERENCES
Alburquerque, N, García-Almodóvar, RC, Valverde, JM, Burgos, L, Martínez-Romero, D (2017) Characterization of Jatropha curcas accessions based in plant growth traits and oil quality. Ind Crops
Prod 109, 693-698.
Andrade, IPS, Folegatti, MV, Santos, ONA, Fanaya Júnior, ED, Barison, A, Santos , ADC (2017) Fatty acid composition of Jatropha curcas seeds under different agronomical conditions by means of 1H HR-MAS NMR. Biomass Bioenerg 101, 30-34.
Araújo, WL, Dias, PC, Moraes, GABK, Celin, EF, Cunha, RL, Barros, RS, DaMatta, FM (2008) Limitations to photosynthesis in coffee leaves from different canopy positions. Plant Physiol
Biochem 46, 884-890.
Asada, K (1999) The water-water cycle in chloroplasts: scavenging of active oxygens and dissipation of excess photons. Ann Rev Plant Phys 50, 601-639.
Bacarin, MA, Deuner, S, Silva, FSP, Cassol, D, Silva, DM (2011) Chlorophyll a fluorescence as indicative of the salt stress on Brassica napus L. Braz J Plant Physiol 23, 245-253.
Baker, NR (2008) Chlorophyll fluorescence: a probe of photosynthesis in vivo. Annu Rev Plant Biol
59, 89-113.
Baroutian, S, Aroua, MK, Raman, AAA, Shafie, A, Ismail, RA, Hamdan, H (2013) Blended aviation biofuel from esterified Jatropha curcas and waste vegetable oils. J Taiwan Inst Chem Eng 44, 911-916.
Bastos, EA, Nascimento, SP, Silva, EM, Freire Filho, FR, Gomide, RL (2011) Identification of cowpea genotypes for drought tolerance. Rev Ciência Agr 42, 100-107.
Binzel, ML, Reuveni, M (1994) Cellular mechanisms of salt tolerance in plant cells. Hortic Rev 16, 33-70.
Campos, MLO, Hsie, BS, Granja, JAA, Correia, RM, Silva, SRS, Almeida-Cortez, JS, Pompelli, MF (2012) Photosynthesis and antioxidant activity mechanisms in Jatropha curcas L. under salt stress.
Braz J Plant Physiol 24, 55-67.
Cen, Y-P, Sage, RF (2005) The regulation of rubisco activity in response to variation in temperature and atmospheric CO2 partial pressure in sweet potato. Plant Physiol 139, 979-990.
Chaves, MM, Costa, JM, Zarrouk, O, Pinheiro, C, Lopes, CM, Pereira, JS (2016) Controlling stomatal aperture in semi-arid regions-The dilemma of saving water or being cool? Plant Sci 251, 54-64.
Contran, N, Chessa, L, Lubino, M, Bellavite, D, Roggero, PP, Enne, G (2013) State-of-the art of the
Jatropha curcas productive chain: From sowing to biodiesel and by-products. Ind Crops Prod 42,
202-215.
Corte-Real, N, Endres, L, Santos, KPO, Figueirêdo, RCB, Arruda, ECP, Ulisses, C, Pompelli, MF (2016) Morphoanatomy and ontogeny of the fruit and seeds of Jatropha curcas L.: A promising biofuel plant. In 'The Promising Future of Jatropha curcas: Proprieties and potential applications.' (Eds MR Segura-Campos, D Betancur-Ancova.) pp. 141-158. (Nova Science Publishers, Inc.: Hauppauge, NY)
Díaz-López, L, Gimeno, V, Lidón, V, Simón, I, Martínez, V, García-Sánchez, F (2012a) The tolerance of Jatropha curcas seedlings to NaCl: An ecophysiological analysis. Plant Physiol Bioch
Díaz-López, L, Gimeno, V, Simón, I, Martínez, V, Rodrígues-Ortega, WM, García-Sánchez, F (2012b) Jatropha curcas seedlings show a water conservation strategy under drought conditions based on decreasing leaf growth and stomatal conductance. Agr Water Manage 105, 48-56.
Divakara, BN, Upadhyaya, HD, Wani, SP, Laxmipathi-Gowda, CL (2010) Biology and genetic improvement of Jatropha curcas L. A review. Appl Energ 87, 732-742.
Dusenge, ME, Wallin, G, Gârdesten, J, Niyonzima, F, Adolfsson, L, Nsabimana, D, Uddling, J (2015) Photosynthetic capacity of tropical montane tree species in relation to leaf nutrients, successional strategy and growth temperature. Oecologia 117, 1183-1194.
Egneus, H, Heber, U, Kirk, M (1975) Reduction of oxygen by the electron transport chain of chloroplasts during assimilation of carbon dioxide. Biochim Biophys Acta 408, 252-268.
Epstein, E (1972) 'Mineral nutrition of plants: principles and perspectives.' (John Wiley & Sons: New York)
Farquhar, GD, von Caemmerer, S, Berry, JA (1980) A biochemical model of photosynthetic CO2 assimilation in leaves of C3 species. Planta 149, 78-90.
Flexas, J, Escalona, JM, Medrano, H (1999) Water stress induces different levels of photosynthesis and electron transport rate regulation in grapevines. Plant Cell Environ 22, 39-48.
Flexas, J, Medrano, H (2002) Drought-inhibition of photosynthesis in C3 plants: stomatal and non-stomatal limitations revisited. Ann Bot 89, 183–189.
Fu, Q, Tao, Y-B, Xu, Z-F (2019) Genetic transformation and transgenics of Jatropha curcas, a biofuel plant. In 'Jatropha, Challenges for a New Energy Crop.' (Eds S Mulpuri, N Carels, B Bahadur.) pp. 79-92. (Springer: Singapore)
Garcia, GO, Ferreira, PA, Miranda, GV, Neves, JCL, Moraes, WB, Santos, DB (2007) Teores foliares dos macronutrientes catiônicos e suas relações com o sódio em plantas de milho sob estresse salino.
Idesia 25, 93-106.
Genty, B, Briantais, JM, Baker, NR (1989) The relationship between the quantum yield of photosynthetic electron transport and quenching of chlorophyll fluorescence. Biochim Biophys Acta
Greenway, H, Munns, R (1980) Mechanisms of salt tolerance in nonhalophytes. Annu Rev Plant
Physiol Plant Mol Biol 31, 149-190.
Griffiths, H, Brent, RH (2013) Mesophyll conductance: internal insights of leaf carbon exchange.
Plant Cell Environ 36, 733-735.
Gubitz, GM, Mittelbach, M, Trabi, M (1999) Exploitation of the tropical oil seed plant Jatropha
curcas L. Biores Technol 67, 73-82.
Guo, G-Y, Chen, F, Shi, X-D, Tian, Y-S, Yu, M-Q, Han, X-Q, UYuan, L-C, Zhang, Y (2016) Genetic variation and phylogenetic relationship analysis of Jatropha curcas L. inferred from nrDNA ITS sequences. C R Biol 339, 337-346.
Gupta, B, Huang, B (2014) Mechanism of salinity tolerance in plants: physiological, biochemical, and molecular characterization. Int J Genomics 2014, 1-18.
Hauser, F, Horie, T (2010) A conserved primary salt tolerance mechanism mediated by HKT transporters: a mechanism for sodium exclusion and maintenance of high K+/Na+ ratio in leaves during salinity stress. Plant Cell Environ 33, 552-565.
Hsie, BS, Mendes, KR, Antunes, WC, Endres, L, Campos, MLO, Souza, FC, Santos, ND, Singh, B, Arruda, ECP, Pompelli, MF (2015) Jatropha curcas L. (Euphorbiaceae) modulates stomatal traits in response to leaf-to-air vapor pressure deficit. Biomass Bioenerg 81, 273-281.
Hussain, MI, Lyra, D-A, Farooq, M, Nikoloudakis, N, Khalid, N (2016) Salt and drought stresses in safflower: a review. Agron Sustain Dev 36, 1-31.
Hussain, S, Zhang, J-H, Zhong, C, Zhu, L-F, Cao, X-C, Yu, S-M, Bohr, JA, Jin, Q-Y (2017) Effects of salt stress on rice growth, development characteristics, and the regulating ways: A review.
J Integrative Agr 16, 2357-2374.
Kalaji, HM, Jajoo, A, Oukarroum, A, Brestic, M, Zivcak, M, Samborska, IA, Cetner, MD, Lukasik, I, Goltsev, V, Ladle, RJ, Dabrowski, P, Ahmad, P (2014) The use of chlorophyll fluorescence kinetics analysis to study the performance of photosynthetic machinery in plants. Emerg Technol Manag Crop
Stress Tolerance 2,
Kanechi, M, Uchida, N, Yasuda, T, Yamaguchi, T (1996) Non-stomatal inhibition associated with inactivation of rubisco in dehydrated coffee leaves under unshaded and shaded conditions. Plant Cell
Keenan, T, Sabate, S, Gracia, C (2010) The importance of mesophyll conductance in regulating forest ecosystem productivity during drought periods. Glob Change Biol 16, 1019-1034.
Krause, GH, Weis, E (1991) Chrolophyll fluorescence and photosynthesis: The Basics. Annu Rev
Plant Phys 42, 313-349.
Laviola, BG, Alves, AA, Rosado, TB, Bhering, LL, Formighieri, EF, Peixoto, LA (2018) Establishment of new strategies to quantify and increase the variability in the Brazilian Jatropha genotypes. Ind Crop Prod 117, 216-223.
Mastan, SG, Rathore, MS, Bhatt, VD, Chikara, J (2012) Assessment of changes in DNA methylation by methylation-sensitive amplification polymorphism in Jatropha curcas L. subjected to salinity stress. Gene 508, 125-129.
Maxwell, K, Johnson, GN (2000) Chlorophyll fluorescence - a practical guide. J Exp Bot 51, 659-668.
Medrano, H, Escalona, JM, Bota, J, Gulías, J, Flexas, J (2002) Regulation of photosynthesis of C3 plants in response to progressive drought: stomatal condutance as a reference parameter. Ann Bot 89, 895-905.
Melo, HF, Souza, ER, Duarte, HHF, Cunha, JC, Santos, HRB (2017) Gas exchange and photosynthetic pigments in bell pepper irrigated with saline water. Rev Bras Eng Agr Amb 21, 38-43.
Mendes, KR, Granja, JAA, Ometto, JP, Antonino, ACD, Menezes, RSC, Pereira, EC, Pompelli, MF (2017) Croton blanchetianus modulates its morphophysiological responses to tolerate drought in a tropical dry forest. Funct Plant Biol 44, 1-10.
Moncaleano-Escandon, J, Silva, BCF, Silva, SRS, Granja, JA, Alves, MCJL, Pompelli, MF (2013) Germination responses of Jatropha curcas L. seeds to storage and aging. Ind Crops Prod 44, 684-690.
Montes, JM, Technow, F, Bohlinger, B, Becker, K (2013) Seed quality diversity, trait associations and grouping of accessions in Jatropha curcas L. Ind Crop Prod 51, 178-185.
Munns, R (2011) Plant adaptation to salt and water stress: differences and commonalities. Adv Bot
Netondo, GH, Onyango, JC, Beck, E (2004) Sorghum and salinity: II. Gas exchange and chlorophyll fluorescence of sorghum under salt stress. Crop Sci 44, 806-811.
Osorio, LRM, Salvador, AFT, Jongschaap, REE, Perez, CAA, Sandoval, JEB, Trindade, LM, Visser, RGF, van Loo, EN (2014) High level of molecular and phenotypic biodiversity inJatropha curcasfrom Central America compared to Africa, Asia and South America. BMC Plant Biol 14, 1-19.
Pandey, VC, Singh, K, Singh, JS, Kumar, A, Singh, B, Singh, RP (2012) Jatropha curcas: A potential biofuel plant for sustainable environmental development. Renew Sust Energy Rev 16, 2870-2883.
Parihar, P, Singh, S, Singh, R, Singh, VP, Prasad, SM (2015) Effect of salinity stress on plants and its tolerance strategies: a review. Environ Sci Pollut Res 22, 4056-4075.
Pecina-Quintero, V, Anaya-López, JL, Zamarripa-Colmenero, A, Núñez-Colín, CA, Montes-García, N, Solís-Bonilla, JL, Jiménez-Becerril, MF (2014) Genetic structure of Jatropha curcas L. in Mexico and probable centre of origin. Biomass Bioenerg 60, 147-155.
Ploschuk, EL, Bado, LA, Salinas, M, Wassner, DF, Windauer, LB, Insausti, P (2014) Photosynthesis and fluorescence responses of Jatropha curcas to chilling and freezing stress during early vegetative stages. Environ Exp Bot 102, 18-26.
Pompelli, MF, Barata-Luís, RM, Vitorino, HS, Gonçalves, ER, Rolim, EV, Santos, MG, Almeida-Cortez, JS, Ferreira, VM, Lemos, EE, Endres, L (2010a) Photosynthesis, photoprotection and antioxidant activity of purging nut under drought deficit and recovery. Biomass Bioenerg 34, 1207-1215.
Pompelli, MF, Ferreira, DTRG, Cavalcante, PPGS, Salvador, TL, Hsie, BS, Endres, L (2010b) Environmental influence on the physico-chemical and physiological properties of Jatropha curcas L. seeds. Aust J Bot 58, 421-427.
Pompelli, MF, Martins, SCV, Antunes, WC, Chaves, ARM, DaMatta, FM (2010c) Photosynthesis and photoprotection in coffee leaves is affected by nitrogen and light availabilities in winter conditions. J Plant Physiol 167, 1052-1060.
Pompelli, MF, Orozco, AJ, Oliveira, MTO, Rodrigues, BM, Barbosa, MO, Santos, MG, Oliveira, AFM, Almeida-Cortez, JS (2011) Crise energética mundial e o papel do Brasil na problemática de biocombustíveis. Revista Agronomía Colombiana 29, 361-371.
Praxedes, SC, Lacerda, CF, DaMatta, FM, Prisco, JT, Gomes-Filho, E (2010) Salt tolerance is associated with differences in ion accumulation, biomass allocation and photosynthesis in cowpea cultivars. J Agron Crop Sci 196, 193-204.
Prickett, RC, Elliott, JAW, Hakda, S, McGann, LE (2008) A non-ideal replacement for the Boyle van’t Hoff equation. Cryobiology 57, 130-136.
Rahdari, P, Hoseini, SM (2011) Salinity stress: A review. Tech J Engin & App Sci 1, 63-66.
Ranjan, S, Singh, R, Soni, DK, Pathre, UV, Shirke, PA (2012) Photosynthetic performance of
Jatropha curcas fruits. Plant Physiol Bioch 52, 66-76.
Reubens, B, Achten, WMJ, Maes, WH, Danjon, F, Aerts, R, Poesen, J, Muys, B (2011) More than biofuel? Jatropha curcas root system symmetry and potential for soil erosion control. J Arid
Environm 75, 201-205.
Rosolem, CA, Pace, L, Crusciol, CAC (2004) Nitrogen management in maize cover crop rotations.
Plant Soil 264, 261-271.
Roy, SJ, Negrão, S, Tester, M (2014) Salt resistant crop plants. Curr Opin Biotechnol 26, 115-124.
Sales, CRG, Ribeiro, RV, Silveira, JAG, Machado, EC, Martins, MO, Lagôa, AMMA (2013) Superoxide dismutase and ascorbate peroxidase improve the recovery of photosynthesis in sugarcane plants subjected to water deficit and low substrate temperature. Plant Physiol Bioch 73, 326-336.
Sánchez-Velázquez, JU, Pacheco, N, López-Puc, G, Ramos-Díaz, A (2018) Behavior of genetic diversity in F1 crosses of selected accessions of J. curcas. Ind Crop Prod 122, 669-674.
Santos, CM, Veríssimo, V, Wanderley-Filho, HCL, Ferreira, VM, Cavalcante, PGS, Rolim, EV, Endres, L (2013) Seasonal variations of photosynthesis, gas exchange, quantum efficiency of photosystem II and biochemical responses of Jatropha curcas L. grown in semi-humid and semi-arid areas subjeted to water stress. Ind Crops Prod 41, 203-213.
Sarin, R, Sharma, M, Sinharay, S, Malhotra, RK (2007) Jatropha-palm biodiesel blends: an optimum mix for Asia. Fuel 86, 1365-1371.
Schmook, B, Seralta-Peraza, L (1997) J. curcas: distribution and uses in the Yucatan Peninsula of Mexico. In 'Biofuels and Industrial Products from Jatropha curcas.' (Eds GM Gübitz, M Mittelbach, M Trabi.) pp. 53-57. (Dbv-Verlag für die Technische Universität Graz: Berlin)
Shrivastava, P, Kumar, R (2015) Soil salinity: a serious environmental issue and plant growth promoting bacteria as one of the tools for its alleviation. Saudi J Biol Sci 22, 123-131.
Silitonga, AS, Hassan, MH, Ong, HC, Kusumo, F (2017) Analysis of the performance, emission and combustion characteristics of a turbocharged diesel engine fuelled with Jatropha curcas biodiesel-diesel blends using kernel-based extreme learning machine. Environ Sci Pollut Res 24, 25383-25405.
Silva, EN, Silva, SLF, Viégas, RA, Silveira, JAG (2010) The role of organic and inorganic solutes in the osmotic adjustment of drought-stressed Jatropha curcas plants. Environ Exp Bot 69, 279-285.
Silva, EN, Silveira, JAG, Rodrigues, CRF, Lima, CS, Viégas, RA (2009) Contribuição de solutos orgânicos e inorgânicos no ajustamento osmótico de pinhão-manso submetido à salinidade. Pesqui
Agropecu Bras 44, 437-445.
Silva, EN, Silveira, JAG, Rodrigues, CRF, Viégas, RA (2015) Physiological adjustment to salt stress in Jatropha curcas is associated with accumulation of salt ions, transport and selectivity of K+, osmotic adjustment and K+/Na+ homeostasis. Plant Biol 17, 1023-1029.
Silva, FC (2009) 'Manual de análises químicas de solos, plantas e fertilizantes, 2. ed.' (Embrapa Informação Tecnológica: Brasília)
Silva, PEM, Cavatte, PC, Morais, LE, Medina, EF, DaMatta, FM (2013) The functional divergence of biomass partitioning, carbon gain and water use in Coffea canephora in response to the water supply: implications for breeding aimed at improving drought tolerance. Environ Exp Bot 87, 49-57.
Singh, R, Pandey, RM, Singh, B (2013) Genetic association, divergence and variability studies for seed yield and oil content and its contributing traits in Jatropha (Jatropha curcas L.). J Med Plants
Res 7, 1931-1939.
Tavakkoli, E, Fatehi, F, Coventry, S, Rengasamy, P, McDonald, GK (2011) Additive effects of Na+ and Cl– ions on barley growth under salinity stress. J Exp Bot 62, 2189-203.
Tominaga, J, Inafuku, S, Coetzee, T, Kawamitsu, Y (2014) Diurnal regulation of photosynthesis in
Jatropha curcas under drought during summer in a semi-arid region. Biomass Bioenerg 67, 279-287.
Tooulakou, G, Giannopoulos, A, Nikolopoulos, D, Bresta, P, Dotsika, E, Orkoula, MG, Kontoyannis, CG, Fasseas, C, Liakopoulos, G, Klapa, MI, Karabourniotis, G (2016) Alarm photosynthesis: calcium oxalate crystals as an internal CO2 source in plants. Plant Physiol 171, 2577-2585.
Trebbi, D, Papazoglou, EG, Saadaoui, E, Vischi, M, Baldini, M, Stevanato, P, Cettul, E, Sanzone, AP, Gualdi, L, Fabbri, A (2015) Assessment of genetic diversity in different accessions of Jatropha
curcas. Ind Crops Prod 75, 35-39.
Verma, KK, Singh, M, Gupta, RK, Verma, CL (2013) Photosynthetic gas exchange, chlorophyll fluorescence, antioxidant enzymes, and growth responses of Jatropha curcas during soil flooding.
Turk J. Bot 37, 1-11.
Wang, WY, Yan, XF, Jiang, Y, Qu, B, Xu, YF (2012) Effects of salt stress on water content and photosynthetic characteristics in Iris lactea var. chinensis seedlings. Middle East J Sci Res 12, 70-74.
Yu, Y, Ni, Z, Chen, Q, Qu, Y (2017) The wheat salinity-induced R2R3-MYB transcription factor TaSIM confers salt stress tolerance in Arabidopsis thaliana. Biochem Bioph Res Co 491, 642-648.
Zheng, YL, Feng, YL, Lei, YB, Yang, C-Y (2009) Different photosynthetic responses to night chilling among twelve populations of Jatropha curcas. Photosynthetica 47, 559-566.
Zlatev, Z, Yordanov, I (2004) Effects of soil drought on photosynthesis and chlorophyll fluorescence in common bean plants. Bulg J Plant Physiol 30, 3-18
ANNEXES
Fig. 1. Air temperature (Tair, A) and vapor pressure deficit (VPD) registered along the experiments. To Tair we used the
mean values between the point of the gas exchange was collected and 15 minutes after that. To VPD we used only data for 750 mM of NaCl along the experiment.
Fig. 2. Net photosynthesis (A; A and B), stomatal conductance (gs; C and D) and internal-to-ambient CO2 concentration
(Ci/Ca; E and F) of six genotype of young plants of Jatropha curcas without salt conditions (A, C and E) and under 750 mM NaCl (B, D and F). Hours: 0, before stress; 48 hours, maximum stress (vertical dotted line); 74 to 914 hours, recovery period. Each point denotes means ± standard error. n = 4
Fig. 3. Relationship between vapor pressure deficit (VPD) and stomatal conductance in six genotype of young plants of
Jatropha curcas. To construct this graph all values were used without distinct the salt concentration but preserving its
Fig. 4. Osmotic potential of six genotype of young plants of Jatropha curcas under 750 mM, sampled in 48 hours, maximum stress (black bars) and 914 hours, recovery (gray bars). Means with different lowercase letters denotes significant differences to stressed and recovery within each genotype and uppercase letters denotes significant differences to genotypes within each salt concentration. The values denotes means ± standard error. n = 4
Fig. 5. Principal component analysis (PCA) of the physiological and nutritional parameters of six genotypes of Jatropha
curcas. Score plots are based on 48 hours of stress, maximum stress (A) and after 914 hours of stress, recovery (B). Data
of 48 hours and 914 hour of stress were pooled together in C. In A and B, the large circles represent the four clusters formed by the Euclidean distance method considering ~70% of similarity.
Supplementary Fig. S2. Loading plot of the physiological and nutritional parameters of six different genotype of Jatropha
curcas. Score plots are based on 48 hours of stress, maximum stress (A) and after 914 hours of stress, recovery (B). Data
of 48 hours and 914 hour of stress were pooled together in C. In Loading plot the direction and length of the lines are directly proportional to variables importance in separating groups. PC1, Principal Component 1; PC2, Principal Component 2. gs, stomatal conductance; T, transpiration; PN, net photosynthesis; Na+, sodium; Cl-, chloride; K+,
potassium; Mg+2, magnesium; WUE
i, intrinsic water use efficiency; F0, minimum fluorescence; s, osmotic potential;
ETR, electron transport rate; PSII, quantum efficiency of photochemistry; Ci:Ca, and internal-to-ambient CO2
concentration; qP, photochemical quenching, Fv:Fm, maximum fluorescence of photosystem II, Fv:F0, ratio between variable fluorescence to initial fluorescence.
Table 1. Information and location of the six genotypes of Jatropha curcas selected
Genotype City – State Geographic location
CNPAE112 Petrolina – PE 09°04’04’’S, 40°19’06,36’’W/382 m a.s.l. CNPAE114 Umuarama – PR 23°47’55’’S, 53°18’48’’W / 430 m a.s.l.
JCAL171 Rio Largo – AL 09°28’42’’S, 35°51’21’’W / 134 m a.s.l. CNPAE183 Jaíba – MG 15°10’03’’S, 43°53’18,4’’W / 478 m a.s.l. CNPAE218 São Miguel do Araguaia – GO 13°55’57’’S, 50°09’17’’W / 350 m a.s.l. CNPAE304 Campina Grande – PB 07°13’33,41’’S, 35°54’88’’W/539 m a.s.l.
Table 2. Significance levels for studied variables, considering the isolated effect of genotype (A),
salinity (B) and interaction (A x B) at maximum stress (MS) and recovery (RE)
Variables Genotype (A) Salinity (B) Interaction (A x B)
MS RE MS RE MS RE A ns ** *** ns ns *** gs ns *** *** ns ns ** Ci:Ca ** * ** *** * ns Fv/Fm ns ns *** ** ns ns Fv/Fo ns ns *** ns ns ns FSII ns * * * ns ns qNP ns ns *** * ns ns qP ns ns ** ns ns ns w ns ns *** ns ns ns Cl ns ns *** *** ns ns Na ** ns *** *** ns ns K * ns * *** ns ns Na/K ns ns *** ** ns ns N ** ns ** ns ns ns P ns ns ns ns ns ns Mg ** * *** ns ns ns Ca ns ns ** ns ns ns
Table 3. Maximum fluorescence of photosystem II (Fv:Fm), photochemical quenching (qP), non-photochemical
quenching (qNP), ratio between variable fluorescence to initial fluorescence (Fv:F0) and quantum efficiency of photochemistry (PSII) of six Jatropha curcas genotypes submitted to 750 mM (stressed) and without salt (control) at maximum stress (MS) and recovery (RE).
CNPAE112 CNPAE114 JCAL171 CNPAE183 CNPAE218 CNPAE304
Fv/Fm MS Control 0.83 ± 0.01 0.82 ± 0.02 0.82 ± 0.02 0.82 ± 0.02 0.82 ± 0.01 0.82 ± 0.02 0.82 ± 0.01 a Stressed 0.80 ± 0.02 0.79 ± 0.01 0.80 ± 0.03 0.80 ± 0.03 0.80 ± 0.03 0.78 ± 0.03 0.80 ± 0.01 b 0.81 ± 0.01 A 0.80 ± 0.02 A 0.81 ± 0.02 A 0.81 ± 0.01 A 0.81 ± 0.01 A 0.80 ± 0.03 A RE Control 0.84 ± 0.01 0.84 ± 0.01 0.84 ± 0.01 0.81 ± 0.01 0.83 ± 0.01 0.83 ± 0.01 0.83 ± 0.03 a Stressed 0.80 ± 0.04 0.81 ± 0.02 0.80 ± 0.02 0.82 ± 0.01 0.75 ± 0.05 0.76 ± 0.06 0.79 ± 0.04 b 0.082 ± 0.03 A 0.082 ± 0.02 A 0.082 ± 0.02 A 0.82 ± 0.04 A 0.79 ± 0.04 A 0.80 ± 0.04 A qP MS Control 0.57 ± 0.05 0.51 ± 0.11 0.52 ± 0.07 0.51 ± 0.11 0.52 ± 0.09 0.50 ± 0.08 0.52 ± 0.07 b Stressed 0.65 ± 0.05 0.59 ± 0.05 0.62 ± 0.05 0.66 ± 0.05 0.55 ± 0.06 0.59 ± 0.07 0.61 ± 0.05 a 0.61 ± 0.05 A 0.55 ± 0.08 A 0.61 ± 0.03 A 0.58 ± 0.08 A 0.49 ± 0.05 A 0.55 ± 0.05 A RE Control 0.42 ± 0.06 0.43 ± 0.11 0.32 ± 0.07 0.55 ± 0.11 0.51 ± 0.13 0.45 ± 0.11 0.56 ± 0.12 a Stressed 0.46 ± 0.15 0.50 ± 0.10 0.36 ± 0.15 0.51 ± 0.02 0.46 ± 0.08 0.48 ± 0.05 0.54 ± 0.12 a 0.54 ± 0.12 A 0.59 ± 0.12 A 0.47 ± 0.14 A 0.57 ± 0.08 A 0.58 ± 0.10 A 0.55 ± 0.10 A qNP MS Control 0.62 ± 0.12 0.58 ± 0.15 0.82 ± 0.17 0.67 ± 0.18 0.57 ± 0.13 0.59 ± 0.15 0.66 ± 0.13 b Stressed 1.17 ± 0.26 1.48 ± 0.17 1.63 ± 0.35 1.61 ± 0.56 2.36 ± 0.32 1.75 ± 0.30 1.67 ± 0.35 a 0.89 ± 0.23 B 1.03 ± 0.27 AB 1.22 ± 0.33 AB 1.14 ± 0.46 AB 1.53 ± 0.49 A 1.17 ± 0.32 AB RE Control 0.79 ± 0.09 1.12 ± 0.20 0.70 ± 0.04 0.55 ± 0.12 0.59 ± 0.13 0.79 ± 0.08 0.69 ± 0.11 b Stressed 1.56 ± 0.76 2.09 ± 0.12 0.71 ± 0.20 0.59 ± 0.12 2.01 ± 0.77 1.57 ± 0.92 1.07 ± 0.45 a 0.76 ± 0.07 A 1.28 ± 0.33 A 0.72 ± 0.08 A 0.53 ± 0.09 A 1.10 ± 0.52 A 0.97 ± 0.50 A Fv/F0 MS Control 4781 ± 97 4639 ± 98 4704 ± 229 4510 ± 141 4728 ± 166 4699 ± 361 4677 ± 48 a Stressed 4124 ± 264 3758 ± 235 3937 ± 160 3977 ± 230 4136 ± 151 3801 ± 434 3955 ± 100 b 4452 ± 180 A 4198 ± 204 A 4321 ± 194 A 4244 ± 160 A 4432 ± 132 A 4250 ± 264 A RE Control 5566 ± 911 4781 ± 212 4663 ± 261 4442 ± 261 4946 ± 216 5393 ± 1001 4965 ± 227 a Stressed 4752 ± 1108 4875 ± 1139 4048 ± 296 4760 ± 250 2470 ± 335 4446 ± 1662 4225 ± 388 a 5159 ± 682 A 4828 ± 537 A 4356 ± 216 A 4601 ± 178 A 3708 ± 503 A 4919 ± 916 A FSII MS Control 0.36 ± 0.02 0.28 ± 0.04 0.33 ± 0.06 0.28 ± 0.04 0.28 ± 0.03 0.34 ± 0.01 0.31 ± 0.02 a Stressed 0.34 ± 0.03 0.26 ± 0.03 0.27 ± 0.02 0.30 ± 0.05 0.21 ± 0.03 0.22 ± 0.04 0.27 ± 0.01 b 0.35 ± 0.01 A 0.27 ± 0.02 AB 0.30 ± 0.03 AB 0.29 ± 0.03 AB 0.25 ± 0.02 B 0.28 ± 0.03 AB RE Control 0.26 0.03 0.25 ± 0.04 0.21 ± 0.04 0.39 ± 0.08 0.38 ± 0.08 0.29 ± 0.05 0.30 ± 0.03 a Stressed 0.25 0.06 0.19 ± 0.04 0.24 ± 0.09 0.34 ± 0.01 0.20 ± 0.04 0.26 ± 0.06 0.25 ± 0.02 b 0.26 ± 0.03 AB 0.22 ± 0.03 B 0.23 ± 0.04 B 0.37 ± 0.04 A 0.29 ± 0.06 AB 0.27 ± 0.04 AB
Table 4. Nutritional variables of six genotypes of Jatropha curcas at 750 mM NaCl at maximum stress (MS) and recovery (RE)
Nutrients
(g Kg -1 DW) CNPAE112 CNPAE114 JCAL171 CNPAE183 CNPAE218 CNPAE304
MS Cl- 18.49 ± 5.60 ns 19.84 ± 5.61 ns 19.89 ± 5.82 ns 19.39 ± 4.96 ns 23.08 ± 6.61 ns 22.66 ± 7.02 ns Na+ 13.49 ± 2.69 a 11.96 ± 2.17 ab 11.36 ± 2.02 ab 9.07 ± 1.08 b 14.07 ± 2.46 a 15.10 ± 2.75 a K+ 18.94 ± 1.52 ab 21.25 ± 2.66 ab 17.58 ± 1.55 b 24.75 ± 2.37 ab 24.50 ± 2.62 ab 25.44 ± 3.24 a Na+/K+ 0.75 ± 0.18 ns 0.66 ± 0.18 ns 0.73 ± 0.17 ns 0.40 ± 0.07 ns 0.62 ± 0.12 ns 0.68 ± 0.16 ns N 39.46 ± 1.04 a 38.03 ± 1.25 a 36.73 ± 1.10 a 33.72 ± 0.81 b 37.99 ± 1.14 a 38.48 ± 1.57 a P 5.15 ± 0.42 ns 4.77 ± 0.29 ns 5.20 ± 0.25 ns 5.16 ± 0.38 ns 4.96 ± 0.40 ns 4.85 ± 0.25 ns Mg2+ 5.01 ± 0.54 ab 5.90 ± 0.30 a 5.65 ± 0.34 a 4.75 ± 0.19 ab 5.40 ± 0.47 a 3.99 ± 0.59 b Ca2+ 23.52 ± 3.95 ns 23.74 ± 3.36 ns 22.54 ± 3.29 ns 23.42 ± 4.54 ns 23.17 ± 5.70 ns 22.89 ± 4.68 ns RE Cl- 10.18 ± 2.35 ns 10.16 ± 2.30 ns 11.14 ± 3.06 ns 8.60 ± 1.12 ns 9.07 ± 3.32 ns 7.15 ± 2.07 ns Na+ 11.52 ± 3.35 ns 9.89 ± 1.92 ns 9.22 ± 1.12 ns 8.43 ± 1.29 ns 7.02 ± 0.93 ns 5.96 ± 0.98 ns K+ 26.50 ± 3.43 ns 28.63 ± 4.18 ns 22.06 ± 2.49 ns 27.04 ± 4.63 ns 28.33 ± 3.23 ns 28.92 ± 4.97 ns Na+/K+ 0.55 ± 0.20 ns 0.52 ± 0.22 ns 0.42 ± 0.04 ns 0.35 ± 0.06 ns 0.27 ± 0.05 ns 0.17 ± 0.05 ns N 44.05 ± 1.97 ns 43.86 ± 1.95 ns 46.44 ± 0.95 ns 45.05 ± 2.02 ns 41.39 ± 2.53 ns 44.63 ± 2.76 ns P 6.82 ± 0.49 ns 5.57 ± 0.26 ns 5.72 ± 0.28 ns 6.58 ± 0.15 ns 5.73 ± 0.44 ns 6.69 ± 0.89 ns Mg2+ 5.48 ± 0.47 a 4.45 ± 0.40 ab 5.46 ± 0.41 a 4.10 ± 0.49 ab 3.85 ± 0.33 ab 4.16 ± 0.38 ab Ca2+ 12.69 ± 3.34 ns 16.53 ± 3.22 ns 20.57 ± 3.50 ns 18.02 ± 2.44 ns 17.18 ± 5.65 ns 19.79 ± 5.03 ns
Means followed by the same letters did not differ significantly between genotypes by the Student Newman Keuls test (p < 0.05) for the same variable. ns = not significant.